. 2021 Feb 12:10:610651.
doi: 10.3389/fonc.2020.610651. eCollection 2020.

P. aeruginosa Mediated Necroptosis in Mouse Tumor Cells Induces Long-Lasting Systemic Antitumor Immunity

Affiliations

P. aeruginosa Mediated Necroptosis in Mouse Tumor Cells Induces Long-Lasting Systemic Antitumor Immunity

Jia-Long Qi et al. Front Oncol. .

Abstract

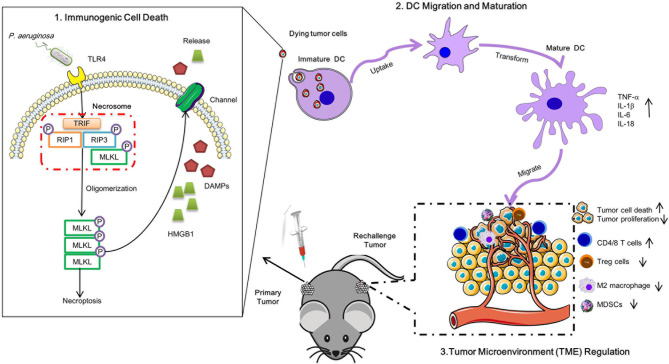
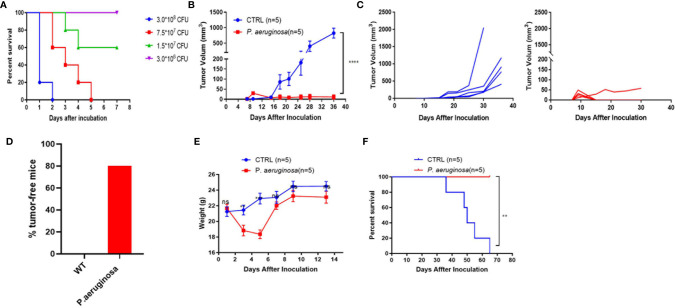
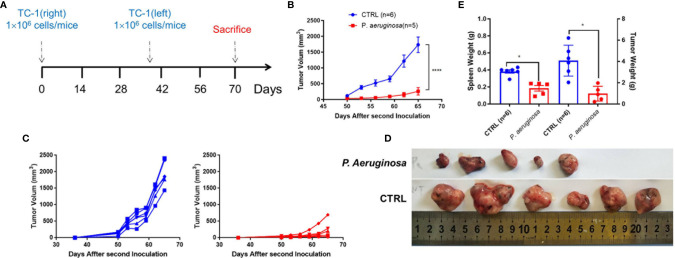
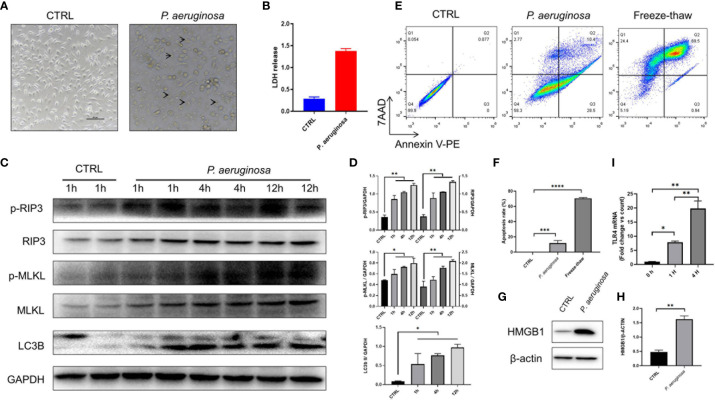
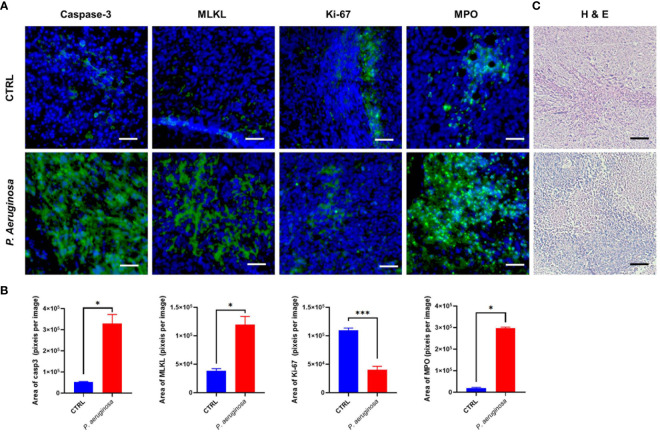
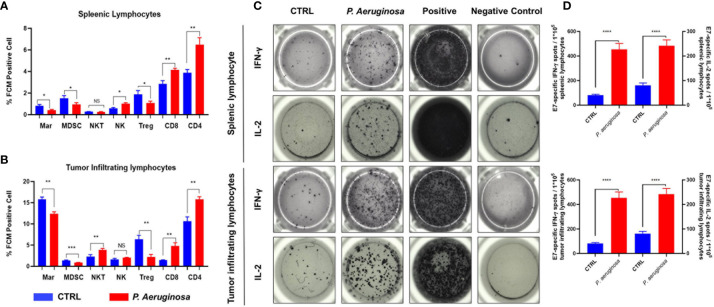
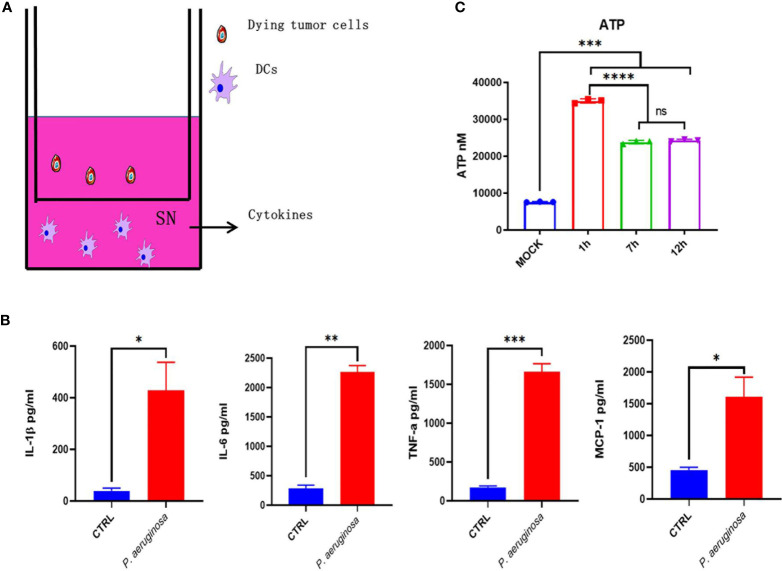
Necroptosis is a form of programmed cell death (PCD) characterized by RIP3 mediated MLKL activation and increased membrane permeability via MLKL oligomerization. Tumor cell immunogenic cell death (ICD) has been considered to be essential for the anti-tumor response, which is associated with DC recruitment, activation, and maturation. In this study, we found that P. aeruginosa showed its potential to suppress tumor growth and enable long-lasting anti-tumor immunity in vivo. What's more, phosphorylation- RIP3 and MLKL activation induced by P. aeruginosa infection resulted in tumor cell necrotic cell death and HMGB1 production, indicating that P. aeruginosa can cause immunogenic cell death. The necrotic cell death can further drive a robust anti-tumor response via promoting tumor cell death, inhibiting tumor cell proliferation, and modulating systemic immune responses and local immune microenvironment in tumor. Moreover, dying tumor cells killed by P. aeruginosa can catalyze DC maturation, which enhanced the antigen-presenting ability of DC cells. These findings demonstrate that P. aeruginosa can induce immunogenic cell death and trigger a robust long-lasting anti-tumor response along with reshaping tumor microenvironment.

Keywords: P. aeruginosa; antitumor immunity; dying tumor cell; necroptosis; tumor microenvironment.


Conflict of interest statement

The authors declare that the research was conducted in the absence of any commercial or financial relationships that could be construed as a potential conflict of interest.

Figures

Graphical Abstract
Graphical Abstract
Schematic diagram of P. aeruginosa mediated anti-tumor immunity. A single low dose of P. aeruginosa injection not only curbed the growth of treated tumors in situ but also delayed the proliferation of distant tumors. P. aeruginosa active PANoptosis signaling pathways and triggered tumor cells death in a TLR4 dependent manner in vitro. Meanwhile, the necrotic-like dying tumor cells release HMGB1 matured DC cells, resulting in the reshaped tumor microenvironment in anti-tumor immunity.
Figure 1
Figure 1
The low sublethal dose of P. aeruginosa co-injection inhibits tumor growth in the mouse TC-1 model. (A) Survival rate of mice subcutaneously challenged by a gradient of P. aeruginosa concentrations (n=8). Mice were continuously monitored for 7 days, which was considered the endpoint. (B) Tumor growth curve shown as average tumor volumes and standard error of the mean per group (n=5). (C) Tumor growth curve of individual mice are shown for control (n=5) and P. aeruginosa (n=5) co-injected groups. Numbers in the panel demonstrated tumor size and the number of mice are still alive at day 40. This experiment was repeated twice. (D) Tumor-free mice percentage. Tumors were grown at early stage in both group, but only one tumor-bearing in P. aeruginosa co-injected group to the endpoint and all mice in control group were tumor-bearing mice. (E) The mice body weight monitor curve. After bacteria-tumor mix injection, all mice weight was continuously monitored for 14 days. The weight of mice in P. aeruginosa co-injected group dropped down at early stage and recovered at day 7. (F) Survival curves of tumor bearing mice (n=5). All mice in control group were dead before day 70 after tumor cells incubation while none of the dead mice appeared in the P. aeruginosa co-injected group. Data are means ± SEM. Paired Student’s t-test was performed for mice body weight comparisons, Two-way ANOVA for tumor growth curve comparisons, and survival curve analysis by Log Rank (Mantel-cox) test. ** indicate P-values ≤ 0.01, *** indicate P-values ≤ 0.001, **** indicate P-values ≤ 0.0001, and ns indicates non-significance.
Figure 2
Figure 2
Development of long-lasting antitumor immunity against TC-1 tumor cells following P. aeruginosa co-injection. (A) Schematic diagram of the procedures for tumor rechallenge experiment. Tumor-free mice were rechallenged with 1 × 10⁶ TC-1 tumor cells again at day 40 on the other side of the primary tumor. (B) Rechallenged tumor growth curve shown as average tumor volumes and standard error of the mean per group (n=5–6). Statistical analysis was performed with two-way ANOVA after Bonferroni correction. (C) Rechallenged tumor growth curve of individual mice are shown for control (n=6) and P. aeruginosa (n=5) co-injected groups. Numbers in the panel demonstrated tumor size and the number of mice are still alive at day 40. This experiment was repeated twice. (D) Representative photographs of rechallenged tumor tissues harvested from each group. (E) Tumor and spleen weight of tumor-bearing mice at the end of the experiment. Data are means ± SEM. Paired Student’s t-test was performed for spleen and tumor weight comparisons and two-way ANOVA for tumor growth curve comparisons. * indicate P-values ≤ 0.05 was considered significant, **** indicate P-values ≤ 0.0001, and ns indicates non-significance.
Figure 3
Figure 3
P. aeruginosa incubation triggered PANoptosis in TC-1 tumor cells.1 × 106 tumor cells were infected with 10 MOI P. aeruginosa for 1 h, 4 h, and 12 h, cell culture supernatants were gently removed and tumor cells were photographed and harvested for immunoassay. (A) Representative photographs of tumor cells treated with or without P. aeruginosa. After incubation, tumor cells were swollen and lysed under the microscope. Arrow represented dying cells. (B) Histogram analysis of lactate dehydrogenase (LDH) release. LDH releasements are represented for tumor cell death in vitro. (C) Western blots of RIP3/pRIP3/MLKL/pMLKL and LC3B in TC-1 cells treated with P. aeruginosa. The WB bands intensity was quantified by image J software. (D) Histogram analysis of the ratio of pRIP3/GAPDH, pMLKL/GAPDH, RIP3/GAPDH, MLKL/GAPDH, LC3B II/GAPDH. (E) Represent FCM images of 7AAD-Annexin V-PE assay. Freeze-thawed TC-1 cells were performed as positive control. (F) The results of cell apoptosis assay. (G) Western blots of HMGB1. (H) Histogram analysis of HMGB1 expression. (I) Histogram analysis of TLR4 expression by RT-PCR in a time-dependent manner. Data are means ± SEM. Paired Student’s t-test was performed for two group comparisons and one-way ANOVA for three groups. * indicate P-values ≤ 0.05 was considered significant, ** indicate P-values ≤ 0.01, *** indicate P-values ≤ 0.001, **** indicate P-values ≤ 0.0001, and ns indicates non-significance.
Figure 4
Figure 4
Immunofluorescence assay for the detection of cell death and proliferation in tumor tissues. (A) Representative images of the immunofluorescence assay for tumor tissue sections. Caspase-3 staining was identified as cell apoptosis; MLKL staining was identified as cell necroptosis; MPO staining was identified as Neutrophils (31); Ki-67 staining was identified as cell proliferation. Cell nuclei were stained with DAPI. (B) Quantitative analysis of FITC positive cells in tumor tissues. All experiments were repeated three times. The area of immunofluorescence intensity was quantified by image J software. (C) H & E staining for tumor tissue sections collected at the experimental end point. Data are means ± SEM. Paired Student’s t-test was performed for comparisons. * indicate P-values ≤ 0.05 was considered significant, *** indicate P-values ≤ 0.001, and ns indicates non-significance.
Figure 5
Figure 5
P. aeruginosa mediated anti-tumor response remodeled systematic and tumor microenvironment immune cell profiles and promoted lymphocytes activation. Histogram analysis of immune cell profiles in (A) splenic lymphocytes and (B) tumor infiltrating lymphocytes by FCM. CD3+CD4+ staining cells were identified as CD4 T cells; CD3+CD8+ staining cells were identified as CD8 T cells; CD4+CD25+ Foxp3+ staining cells were identified as Treg cells; CD3-NK1.1+ staining cells were identified as NK cells; CD3+NK1.1+ staining cells were identified as NK T cells; CD11b+Gr-1+ staining cells were identified as MDSC cells; CD11b+F4/80+ staining cells were identified as macrophages cells; (C) representative images of ELISPOT assay. Indicated 1 × 10⁵ splenic lymphocytes and tumor infiltrating lymphocytes were stimulated with 2 ug/ml E7 specific peptides. Spots were represented as activated lymphocytes, PMA was performed as positive control. (D) Quantitative analysis of antigen specific IFN-γ- and IL-2-expressing lymphocytes detected by ELISPOT. Data are means ± SEM. Paired Student’s t-test was performed for comparisons. * indicate P-values ≤ 0.05 was considered significant, ** indicate P-values ≤ 0.01, *** indicate P-values ≤ 0.001, **** indicate P-values ≤ 0.0001, and ns indicates non-significance.
Figure 6
Figure 6
Dying tumor cells trigger DC maturation. (A) Schematic diagram of incubation of DC2.4 with dying tumor cells. (B) The concentration of cytokines with IL-1β, IL-6, TNF-α, and MCP-1 in DC supernatant after treatment. (C) Histogram analysis of ATP releasement. One-way ANOVA and paired Student’s t-test was performed for comparisons. * indicate P-values ≤ 0.05 was considered significant, ** indicate P-values ≤ 0.01, and *** indicate P-values ≤ 0.001, **** indicate P-value ≤ 0.0001.

Similar articles

Cited by

References

    1. Elinav E, Garrett WS, Trinchieri G. The cancer microbiome. Nat Rev Cancer (2019) 19:371–6. 10.1038/s41568-019-0155-3 - DOI - PMC - PubMed
    1. Zitvogel L, Ayyoub M, Routy B, Kroemer G. Microbiome and Anticancer Immunosurveillance. Cell (2016) 165:276–87. 10.1016/j.cell.2016.03.001 - DOI - PubMed
    1. Pope JL, Tomkovich S, Yang Y, Jobin C. Microbiota as a mediator of cancer progression and therapy. Trans Res J Lab Clin Med (2017) 179:139–54. 10.1016/j.trsl.2016.07.021 - DOI - PMC - PubMed
    1. Decker WK, da Silva RF, Sanabria MH, Angelo LS, Guimarães F, Burt BM, et al. . Cancer Immunotherapy: Historical Perspective of a Clinical Revolution and Emerging Preclinical Animal Models. Front Immunol (2017) 8:829. 10.3389/fimmu.2017.00829 - DOI - PMC - PubMed
    1. Chowdhury S, Castro S, Coker C, Hinchliffe TE, Arpaia N. Programmable bacteria induce durable tumor regression and systemic antitumor immunity. Nat Med (2019) 25:1057–63. 10.1038/s41591-019-0498-z - DOI - PMC - PubMed

LinkOut - more resources