. 2021 Feb 11:9:562908.
doi: 10.3389/fcell.2021.562908. eCollection 2021.

FOntCell: Fusion of Ontologies of Cells

Affiliations

FOntCell: Fusion of Ontologies of Cells

Javier Cabau-Laporta et al. Front Cell Dev Biol. .

Abstract

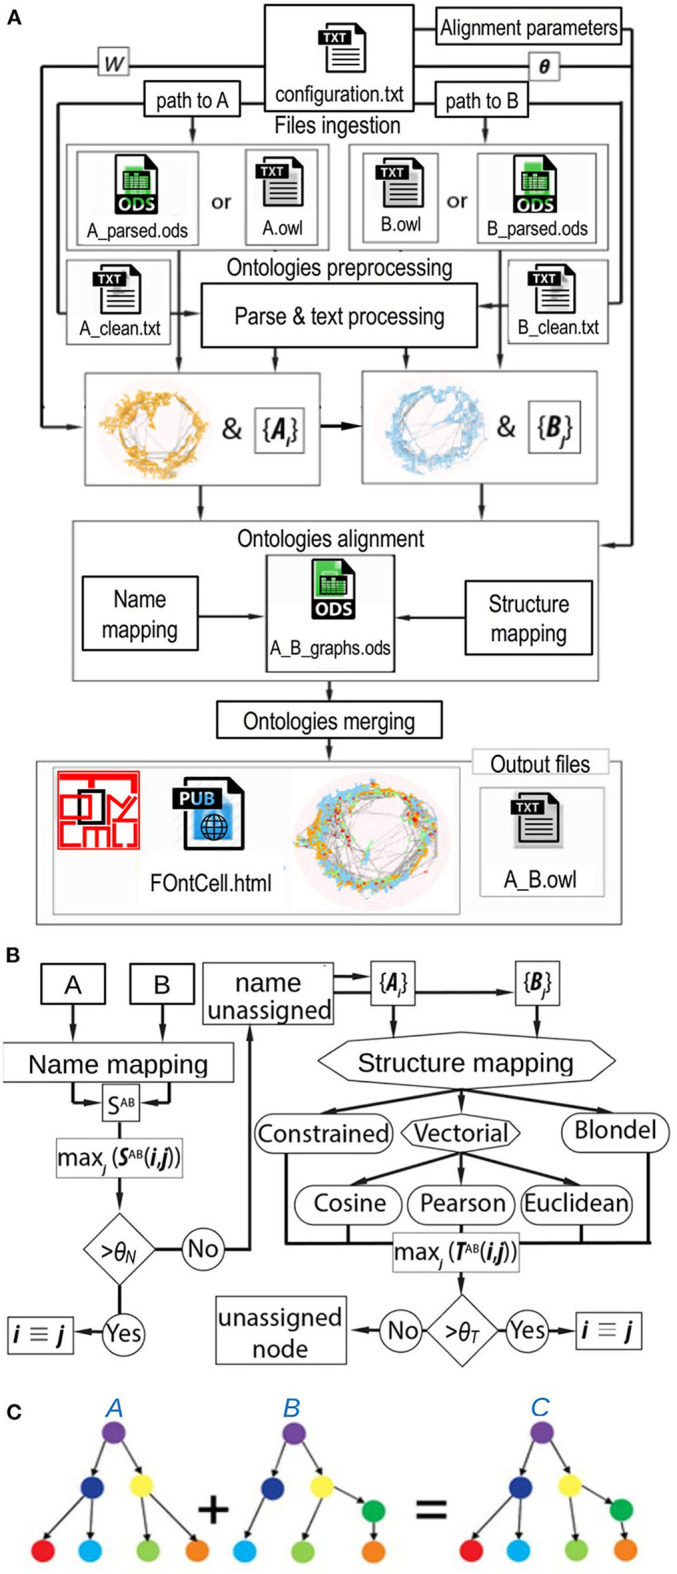
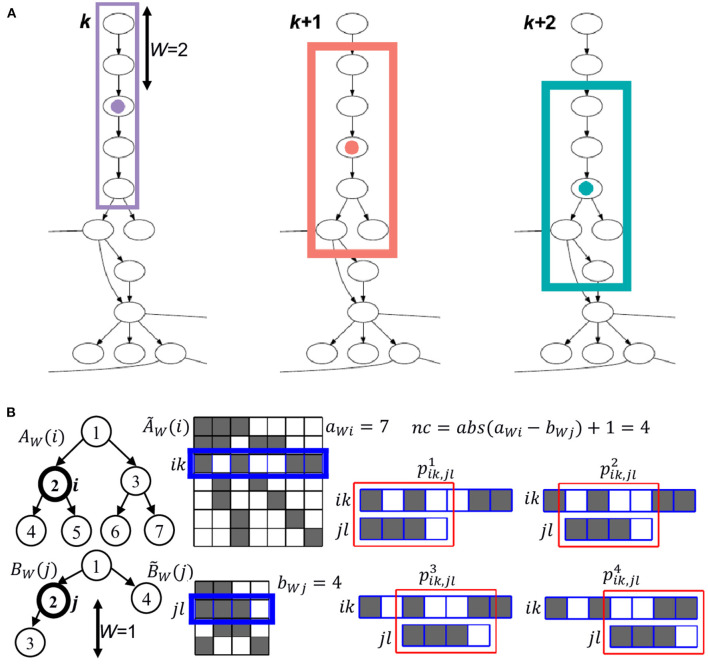
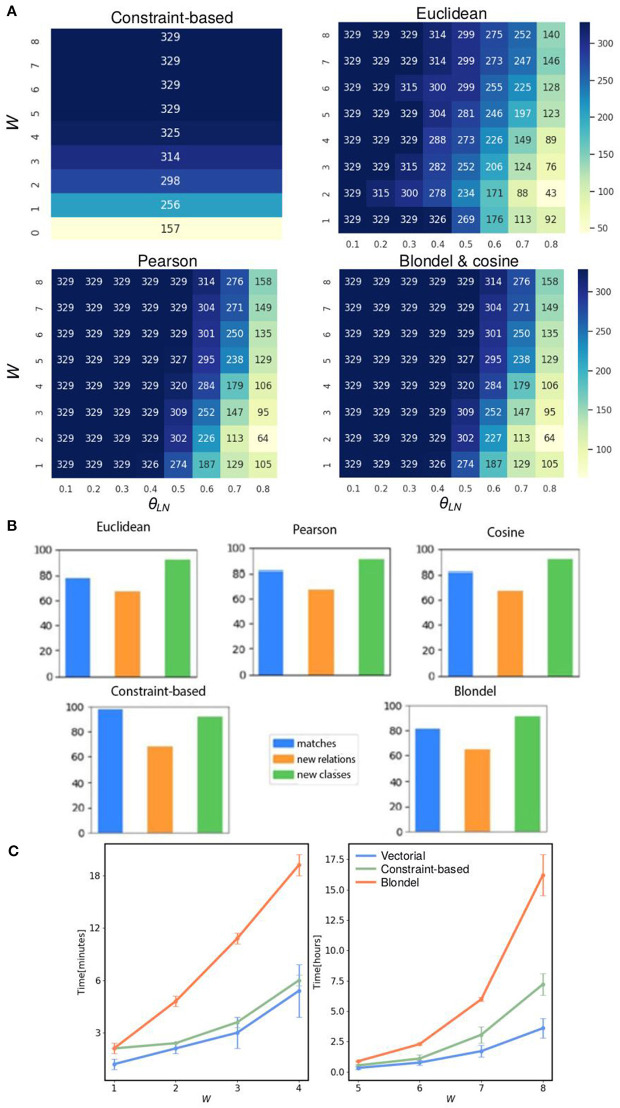
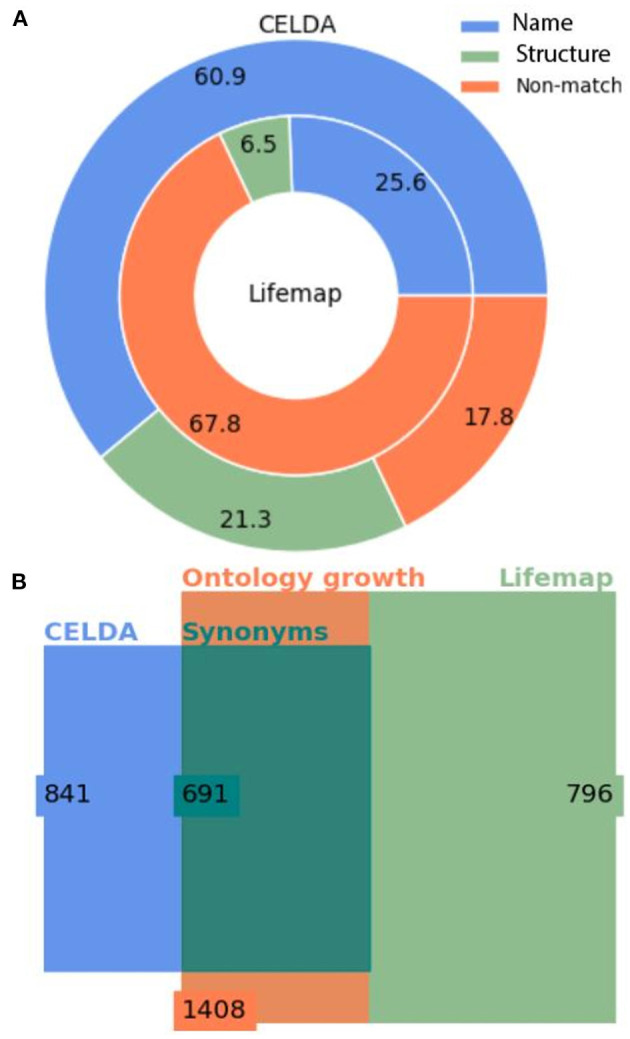
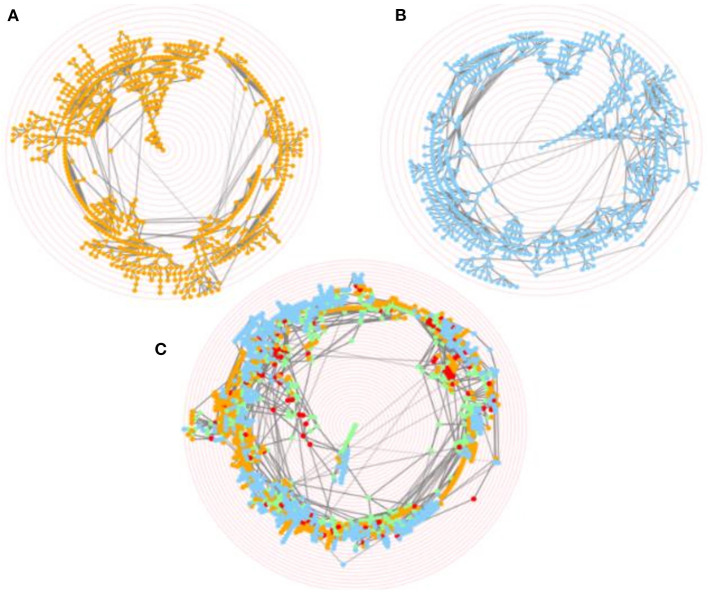
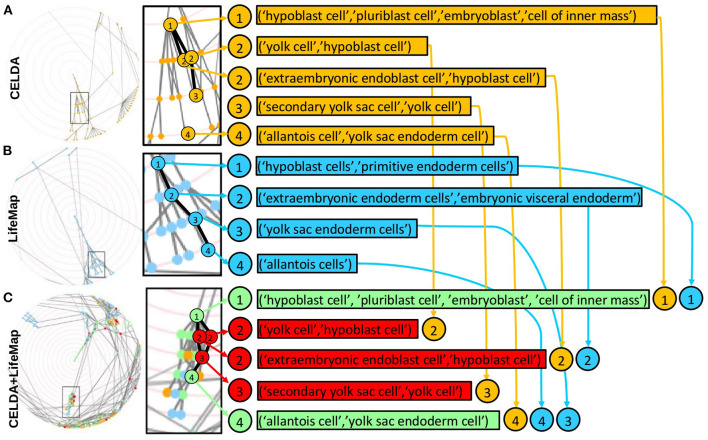
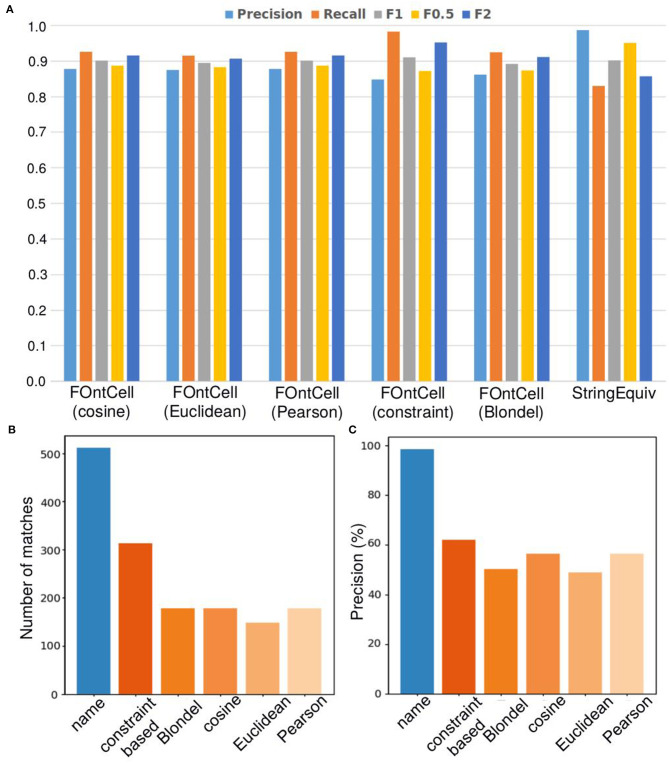
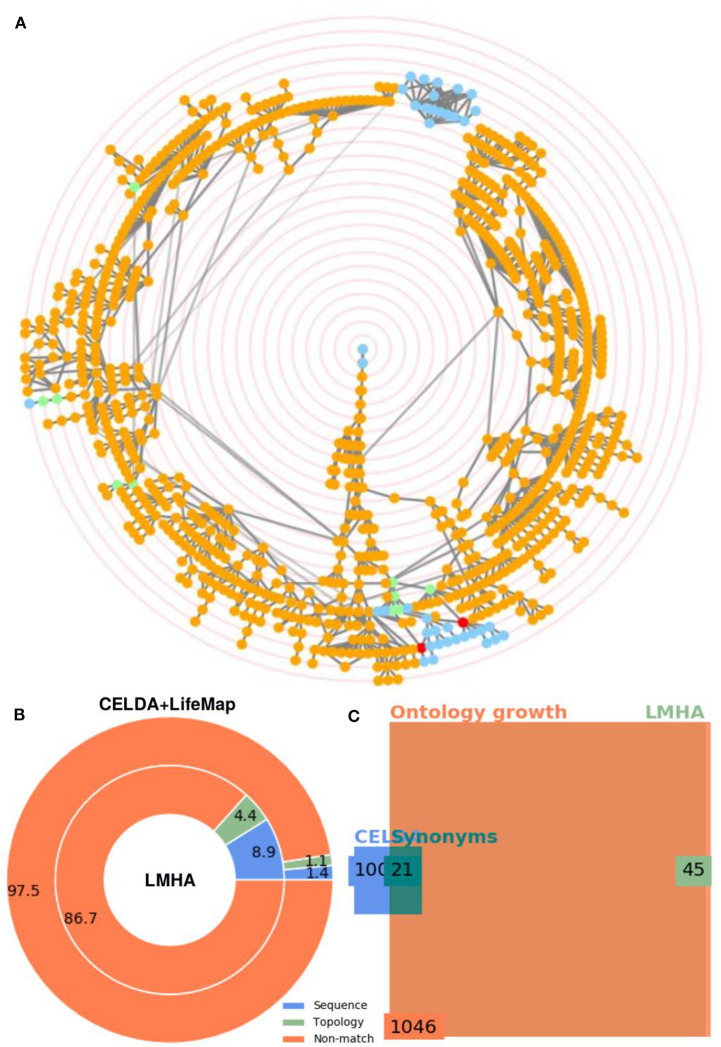
High-throughput cell-data technologies such as single-cell RNA-seq create a demand for algorithms for automatic cell classification and characterization. There exist several cell classification ontologies with complementary information. However, one needs to merge them to synergistically combine their information. The main difficulty in merging is to match the ontologies since they use different naming conventions. Therefore, we developed an algorithm that merges ontologies by integrating the name matching between class label names with the structure mapping between the ontology elements based on graph convolution. Since the structure mapping is a time consuming process, we designed two methods to perform the graph convolution: vectorial structure matching and constraint-based structure matching. To perform the vectorial structure matching, we designed a general method to calculate the similarities between vectors of different lengths for different metrics. Additionally, we adapted the slower Blondel method to work for structure matching. We implemented our algorithms into FOntCell, a software module in Python for efficient automatic parallel-computed merging/fusion of ontologies in the same or similar knowledge domains. FOntCell can unify dispersed knowledge from one domain into a unique ontology in OWL format and iteratively reuse it to continuously adapt ontologies with new data endlessly produced by data-driven classification methods, such as of the Human Cell Atlas. To navigate easily across the merged ontologies, it generates HTML files with tabulated and graphic summaries, and interactive circular Directed Acyclic Graphs. We used FOntCell to merge the CELDA, LifeMap and LungMAP Human Anatomy cell ontologies into a comprehensive cell ontology. We compared FOntCell with tools used for the alignment of mouse and human anatomy ontologies task proposed by the Ontology Alignment Evaluation Initiative (OAEI) and found that the Fβ alignment accuracies of FOntCell are above the geometric mean of the other tools; more importantly, it outperforms significantly the best OAEI tools in cell ontology alignment in terms of Fβ alignment accuracies.

Keywords: Human Cell Atlas (HCA); Ontology Alignment Evaluation Initiative (OAEI); automatic ontology merging; cell ontology; ontology alignment; ontology merging.


Conflict of interest statement

The authors declare that the research was conducted in the absence of any commercial or financial relationships that could be construed as a potential conflict of interest. The handling editor declared a past collaboration with one of the authors MA-B.

Figures

Figure 1
Figure 1
FOntCell algorithm. (A) FOntCell software flux diagram with the main functionalities of files ingestion, ontologies preprocessing, ontology parsing, ontologies alignment, ontologies merging, and generation of output files. Together with the ontology files, the user feeds the alignment parameters: W, window length, and the similarities threshold vector θ = {θN, θT, θLN}. (B) Flux diagram of the FOntCell alignment algorithm combining the name mapping (left) and the structure mapping (right) using five alternative mapping methods. {Ai} and {Bj} denote the sets of subgraphs around nodes i and j of ontology A and B, respectively. The rhombi and octagons mark two or three alternative decisions, respectively. (C) Conceptual example of merging of ontologies. For merging two ontologies A and B into an ontology C, FOntCell aligns equivalent classes between A and B, and then merges the non-common relations that branch from the equivalent classes. Equivalent classes are marked with same colors in the two ontologies A and B.
Figure 2
Figure 2
Convolutional graph matching of FOntCell. (A) Example of three consecutive steps of the sliding window of length W = 2 used in the calculation of the structure convolutional matching. For each central (generator) node, marked with a colored circle, the nodes involved in the calculation of the structure convolutional matching are framed with a rectangle of the same color as its corresponding central node. (B) Example of graph convolution, for a sliding window of length W = 1, between two subgraphs AW(i) and BW(j) (left) with generator nodes i and j, adjacency matrices A~W(i) and B~W(j) (center), and number of nodes aWi = 7 and bWj = 4, respectively. The connected nodes are represented by dark cells in the adjacency matrices. For each row k of A~W(i), and l of B~W(j), a vectorial convolution is calculated. The step for the rows k = 3 of A~W(i), and l = 2 of B~W(j), is marked in blue as an example. The nc = abs(aWj - bWi) + 1 = 4 sliding windows of the shorter row jl of B~W(j) over the longer row ik of A~W(i) are marked in red (right), and the respective nc convolution similarities pik,jlc for each slide c are calculated using one of the metrics M = {1 - cosine, Euclidean, 1 - Pearson}.
Figure 3
Figure 3
FOntCell performance merging CELDA with LifeMap. (A) Heat maps of the matches obtained with two-parameter combinations, window length and name score threshold, using five structure matching methods: the three vectorial structure matching {cosine, Euclidean, Pearson}; constraint-based structure matching, and Blondel structure matching. The two optimized parameters are the window length W and the local sequence threshold θLN in the ranges [0.1, 0.8] and [1, 8], respectively, using steps of 0.1 for θLN, and 1 for W. Bluer color corresponds to higher number of synonyms. (B) Percentages of matches, new classes and new relations, obtained with the five structure matching methods with merging alignment parameters W = 4, θN = 0.85, and θLN = 0.7. (C) Run time for the five structure-matching methods for θN = 0.85, and θLN = 0.7, and window sizes W in the range [1, 8]. The vectorial structure matching {cosine, Euclidean, Pearson} have similar run time lines and are represented by a single line.
Figure 4
Figure 4
Statistics of the merging of CELDA and LifeMap with the cosine structure matching metric. (A) Donut plot of the percentages of classes added by name mapping vs. the classes added by structure mapping to CELDA (outer circle) from LifeMap (inner circle). (B) Square Euler-Venn diagram with the number of classes before and after merging. The blue and light green rectangles frame the number of classes in CELDA and LifeMap, respectively, before the merging, the dark green rectangle frames the sum of name and structure equivalent classes, and the orange rectangle frames the total number of classes in the resultant CELDA and LifeMap merged ontology. Alignment parameters W = 4, θLN = 0.7 and θN = 0.85.
Figure 5
Figure 5
Merging of CELDA and LifeMap ontologies. Screenshots of the interactive circular Directed Acyclic Graphs (DAGs) of (A) CELDA, (B) LifeMap and (C) the merged CELDA + LifeMap ontology, respectively. The orange and blue nodes are the non-matched contributions from ontology A and ontology B, respectively. The green and red nodes are the nodes with name and structure mapping, respectively. The ontology labels associated to the nodes appear when hovering over the nodes. The concentric red rings are zoom guides.
Figure 6
Figure 6
Zooms of regions of CELDA, LifeMap and the merged ontology where FOntCell performs name and structure mapping. (Left) Screenshots of the interactive circular Directed Acyclic Graphs (DAGs) of (A) CELDA, (B) LifeMap and (C) the merged CELDA+LifeMap ontology. (Right) Zoomed regions with corresponding lists of cell types. The synonymous names in each list are separated by commas. The orange and blue nodes are the non-matched contributions from CELDA and LifeMap, respectively. The green and red nodes are the nodes with name and structure mapping, respectively. The numbers inside circles indicate the relative parent-child relationship in ascending order.
Figure 7
Figure 7
Alignment performance of the different mapping methods of FOntCell when merging CELDA and LifeMap. (A) Precision, recall and Fβ alignment accuracies of the different structure mapping methods combined with name mapping (FOntCell), and of name mapping applied separately (StringEquiv). (B) Number of matches during ontology matching with the different mapping methods. Name mapping is shown in blue and the structure mappings in different hues of orange. (C) Precision of the name matching and the different structure mapping methods. Name mapping is shown in blue and the structure mappings in different hues of orange. Alignment parameters W = 4, θLN = 0.7 and θN = 0.85.
Figure 8
Figure 8
Merging of CELDA + LifeMap with LungMAP Human Anatomy (LMHA) ontology. (A) Circular Directed Acyclic Graph (DAG) of the merged ontology. The orange and blue nodes are the non-matched contributions from CELDA+LifeMap and LMHA, respectively. The green and red nodes are the nodes with name and structure mapping, respectively. In the interactive application generated automatically in html by FOntCell, the ontology labels associated to the nodes appear when hovering over the nodes. The concentric red rings are zoom guides. (B) Donut plot of the percentages of classes added by name mapping vs. the classes added by structure mapping to the merged CELDA + LifeMap (outer circle) from LMHA (inner circle). (C) Square Euler-Venn diagram with the number of classes before and after the merge. The blue and light green rectangles frame the number of classes in CELDA + LifeMap and LMHA before the merging, respectively, the dark green rectangle frames the sum of name and structure equivalent classes, and the orange rectangle frames the total number of classes in the resultant CELDA + LifeMap + LMHA merged ontology. Alignment parameters W = 4, θLN = 0.7 and θN = 0.85.

Similar articles

References

    1. Ascension A. M., Araúzo-Bravo M. J. (2020). “BigMPI4py: python module for parallelization of big data objects discloses germ layer specific DNA demethylation motifs,” in IEEE/ACM Transactions on Computing Biology and Bioinformatics (New York, NY: IEEE; ). - PubMed
    1. Bard J., Rhee S. Y., Ashburner M. (2005). An ontology for cell types. Genome Biol. 6:R21 10.1186/gb-2005-6-2-r21 - DOI - PMC - PubMed
    1. Blondel V. D., Gajardo A., Heymans M., Senellart P., Van Dooren P. (2004). A measure of similarity between graph vertices: applications to synonym extraction and web searching. SIAM Rev. 46, 647–666. 10.1137/S0036144502415960 - DOI
    1. Boldog E., Bakken T. E., Hodge R. D., Novotny M., Aevermann B. D., Baka J., et al. . (2018). Transcriptomic and morphophysiological evidence for a specialized human cortical GABAergic cell type. Nat. Neurosci. 21, 1185–1195. 10.1038/s41593-018-0205-2 - DOI - PMC - PubMed
    1. Busse J., Humm B., Lübbert C., Moelter F., Reibold A., Rewald M., et al. (2015). Actually, what does “ontology” mean?: A term coined by philosophy in the light of different scientific disciplines. J. Comp. Inform. Technol. 23, 29–41. 10.2498/cit.1002508 - DOI

LinkOut - more resources