. 2020 Dec;1(12):1153-1166.
doi: 10.1038/s43018-020-00133-0. Epub 2020 Nov 9.

CD25-Treg-depleting antibodies preserving IL-2 signaling on effector T cells enhance effector activation and antitumor immunity

Affiliations

CD25-Treg-depleting antibodies preserving IL-2 signaling on effector T cells enhance effector activation and antitumor immunity

Isabelle Solomon et al. Nat Cancer. 2020 Dec.

Abstract

Intratumoral regulatory T cell (Treg) abundance associates with diminished anti-tumor immunity and poor prognosis in human cancers. Recent work demonstrates that CD25, the high affinity receptor subunit for IL-2, is a selective target for Treg depletion in mouse and human malignancies; however, anti-human CD25 antibodies have failed to deliver clinical responses against solid tumors due to bystander IL-2 receptor signaling blockade on effector T cells, which limits their anti-tumor activity. Here we demonstrate potent single-agent activity of anti-CD25 antibodies optimized to deplete Tregs whilst preserving IL-2-STAT5 signaling on effector T cells, and demonstrate synergy with immune checkpoint blockade in vivo. Pre-clinical evaluation of an anti-human CD25 (RG6292) antibody with equivalent features demonstrates, in both non-human primates and humanized mouse models, efficient Treg depletion with no overt immune-related toxicities. Our data supports the clinical development of RG6292 and evaluation of novel combination therapies incorporating non-IL-2 blocking anti-CD25 antibodies in clinical studies.


Conflict of interest statement

Competing Interests A patent application WO/2018/167104, with relevance to this work has been filed by Cancer Research Technology Limited and Tusk Therapeutics and we want to declare our relationship with this patent. I.S. F.A.V., S.A.Q., K.S.P., A.G., J.S., P.M., are named inventors on these patents. F.A.V., S.A.Q., I.S. and K.S.P. receive royalties related to these patents. S.A.Q. is an advisor to TUSK/Roche. M.A., R.F., J.E., C.M., J.S., B.J., L.L., H.K., J.B., S.B., C.B., E. M-B. and R.S. are employees of Roche, which plan clinical development of the drug. M.A., R.F., J.E., C.M., J.S., B.J., H.K., J.B., S.B., C.B., E. M-B. and R.S. have shares in the companies to which the patents belong.

Figures
Extended Data Fig. 1
Extended Data Fig. 1. αCD25NIB promotes single dose, single agent activity against established tumors
(A) Balb/C mice were injected with 500,000 CT26 tumor cells. Treatment was started on day 6 post-tumor inoculation. (B) Mean tumor volume of the tumor-bearing mice in (A), n=10 mice/group. Data are presented as mean values +-SEM.
Extended Data Fig. 2
Extended Data Fig. 2. αCD25NIB depletes Tregs and drives effector immune responses.
C57BL6 mice were injected with 500,000 MC38 tumor cells. Once tumors were palpable, on day 7, mice were injected IP with αPC61/αCD25NIB/αCD25NIB + αIL2 (200μg). Tumors and LN were harvested on day 15 post-tumor inoculation and processed as described in materials and methods section. (A) Graph showing % FoxP3+ cells of total CD4+ cells. (B) Absolute number of Tregs shown as number of Tregs/g of tumor. p-value=0.0003 between No Tx and αCD25NIB group. ****=p-value <0.0001 (C) Ratio of effector T cells over Tregs. For CD8/Treg ratio, P-value between No tx versus αCD25NIB=0.0008, and between No tx and αCD25NIB + αIL2 =0.0045. For CD4 Eff/Treg ratio, p-value between no tx and /αCD25PC61 = 0.0056, between No tx and αCD25NIB=0.0002, between no tx and αCD25NIB + αIL2=0.0001. For NK/Treg ratio, p-value=0.0001 for no tx versus αCD25PC61, 0.0010 for no tx versus αCD25NIB and 0.0004 for No tx versus αCD25NIB + αIL2. (D) Representative FACS plots showing Granzyme B expression versus Ki67 expression in CD8, CD4 effectors and NK cells. (E) Graph showing percentage of Granzyme B+ cells in different effector subsets. (F) Graph showing the Mean Fluorescence Intensity of Granzyme of the effector cells plotted in (E). For CD8 cells, p-value between No tx group and αCD25NIB =0.0001. For CD4 Eff, p-values between No tx versus αCD25NIB =0.0007, for αCD25NIB versus αCD25PC61=0.0009, and between αCD25NIB and αCD25NIB + αIL2 group= 0.0002. For NK cells, p-value between No tx group and αCD25NIB group=0.0164 and between αCD25NIB and αCD25NIB + αIL2 group=0.0280. Quantification plots: mean ± SEM, 1-way ANOVA, Tukey’s multiple comparisons test (ns=p>0.05, *p<0.05, **p<0.01, ***p<0.001, ****p<0.0001).
Extended Data Fig. 3
Extended Data Fig. 3. Binding of αCD25NIB, RG6292 and Daclizumab to mouse, human and cynomolgus CD25 positive cells. ADCC and ADCP capacity of RG6292.
For binding experiments with RG6292 and Daclizumab, SU-DHL1 tumor cells (human CD25+, (A)) and HSC-F cells (cynomolgus CD25+, (B)) were used. To quantify binding of αCD25NIB, splenocytes were isolated of spleens resected from female C57BL/6-Foxp3tm1Flv/J mice (C) Cells were incubated with indicated serial dilutions of the test antibody detected then by fluorescently labeled 2nd antibody against human and mouse Fcγ, respectively. Living mouse Treg cells (Aqua-, mRFP+ singlets) and tumor cells (Aqua-, singlets), respectively, were gated and the mean fluorescence intensity of the secondary antibody was plotted. EC50 values were calculated by as described in the data analysis section in materials and methods. Shown are technical duplicates of one representative experiment out of several independent ones conducted (N>2). (D) RG6292 (and the fully fucosylated version RG6292 (FF)) depleted via ADCC in-vitro differentiated Treg cells using purified, IL-2 activated NK cells. Shown are technical duplicates of one representative experiment out of several independent ones conducted (N>2). (E) RG6292 and RG6292 (FF) mediated ADCP of in-vitro differentiated Treg cells when co-cultured with MCSF differentiated macrophages. Flow cytometric analysis was performed to determine percentage of phagocytosis. Shown are technical duplicates of one representative experiment out of several independent ones conducted (N>2). (F) Schematics of binder selection.
Extended Data Fig. 4
Extended Data Fig. 4. Anti-human-CD25NIB (RG6292) depletes Treg and drives T cell activation in tumor-bearing humanized mice.
Stem cell humanized female NOG mice bearing an established s.c. BxPC-3 tumor were injected i.p. with vehicle, RG6292 [4 mg/kg] or Ipilimumab [10 mg/kg]. After 72 hrs, splenocytes, blood lymphocytes and tumor infiltrating lymphocytes were isolated and evaluated for counts of activated CD8+ T cells (huCD45+, huCD3+, huCD8+ huCTLA-4+) and Tregs (huCD45+, huCD3+, huCD4+, huFoxP3+) as well as for markers of recent T cell activation. (A) Ipilimumab as well as RG6292 decreased the intratumoral Treg counts. An increase of intratumoral activated CD8+ T cell count was only evident after administration of RG6292. Normalized counts were plotted for the respective treatment groups. Each symbol represents one animal (n=5 mice), CD8 and Treg cells are connected for the same animals (B) Intratumoral CD8+ T cells after RG6292 treatment were highly activated and had increased levels of HLA-DR, PD-1 and CTLA-4 (MFI as well as % of positive cells). Each symbol represents one animal (n=5 mice). The box and whiskers plots show minima and maxima and the median. Statistical analysis of RG6292 and Ipilimumab treated groups against vehicle group is indicated. Data was analyzed using 2-way ANOVA, Dunnet’s multiple comparisons test (ns=p>0.05, *p<0.05, **p<0.01, ***p<0.001, ****p<0.0001) (p-value between RG6292 and Ipilimumab was 0.0001 for CTLA4 MFI on CD8 T cells and 0.0008 for HLA-DR on CD8 T cells. (C) Representative FACS plots showing CD25 expression versus FoxP3 expression in CD4+ T cells and PD-1 expression versus CTLA-4 expression in CD8+ T cells for vehicle, RG6292 and Ipilimumab treated animals.
Extended Data Fig. 5
Extended Data Fig. 5. Open-book representation of the interaction site between CD25 and Fab RG6292.
CD25 shown as surface colored in yellow with residues contributing to the interface highlighted in salmon. Fab light and heavy chain are colored in cyan and blue. Residues from the heavy chain CDR1, CDR2 and CDR3 contributing to the interface are labeled and the surface colored in dark pink, magenta and light pink, respectively. Light chain residues of CDR1 to 3 contributing to the interface are labeled and shown in yellow, lime green and green, respectively.
Fig. 1
Fig. 1. Characterization of non-IL-2 blocking anti-mouse CD25 mAbs (αCD25NIB).
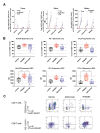
(A) and (B) Pan T cells were isolated from splenocytes. 200,000 cells were plated and rested for 2 hours at 37°C. Antibodies were added at 50μg/ml and incubated with the cells for 30 mins at 37°C, following which cells were stimulated with IL-2 (50U/ml) for 10 mins at 37°C. Cells were stained for pStat5 as described and % Stat5 phosphorylation by different subsets of cells was recorded. (A) Representative histograms showing percentage of STAT5 phosphorylation observed in Tregs post-incubation with the antibodies listed. (B) Graph showing percentage of Stat5 phosphorylation observed in Tregs post-incubation with the antibodies listed. Data represented as mean of triplicates ±SEM. p<0.0001. (C) (D) (E) and (F) C57BL6 mice were injected with 500,000 MCA205 tumor cells. Once tumors were palpable, mice were injected IP with αCD25PC61or αCD25NIB antibodies (200μg) on days 5, 10 and 14. Tumors were harvested on day 15 post-tumor inoculation (C). Tumors were processed as described in materials and methods section. 200,000 cells were plated in a 96-well plate, antibody was either added at 50μg/ml for 30 mins (E and F) or omitted (D) followed by IL-2 stimulation (50U/ml) for 10 mins. Cells were fixed and stained for pSTAT5 as described. (D) Graphs showing percentage of STAT5 phosphorylation by CD8 (p=0.0021 between No Tx and αCD25PC61), CD4 Eff (p=0.0077 between No Tx and αCD25PC61) and Treg cells (p=0.0004 between No Tx and αCD25PC61 and p=0.0429 between No Tx and αCD25NIB) (n=5 mice/group). (E) Representative histograms showing percentage of STAT5 phosphorylation by CD8, CD4 eff and Treg cells post-treatments with antibodies shown in (F). (F) Graphs showing percentage of STAT5 phosphorylation by CD8, CD4 Eff and Treg cells (p=0.0080) between No Tx and αCD25NIB (n=5 mice/group). All quantification plots: mean, 1-way ANOVA, Tukey’s multiple comparisons test (ns=p>0.05, *p<0.05, **p<0.01, ***p<0.001, ****p<0.0001).
Fig. 2
Fig. 2. Monotherapy αCD25NIB drives rejection of established tumors in different mouse models.
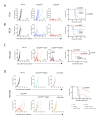
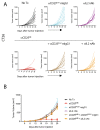
(A) Balb/C mice were injected with 500,000 CT26 tumor cells. Treatment with αCD25PC61/αCD25NIB was started on day 6 post-tumor inoculation. On the left, growth curves showing growth of tumor. On the right, survival. (B) C57BL6 mice were injected s.c. with 1,000,000 MC38 tumor cells in Matrigel. Treatment started on day 6 post-tumor inoculation. On the left, growth curves showing growth of tumor. On the right, survival. (C) C57BL6 mice were injected with 500,000 MCA205 tumor cells. Treatment started day 6, and continued weekly afterwards for 4 consecutive weeks for the αCD25NIB weekly group. On the right, survival, p=0.0399 between αCD25NIB day 6 and αCD25NIB weekly group. (D) C57BL6 mice were injected with 500,000 MCA205 tumor cells. Treatment started on day 6 post tumor inoculation. Survival of these mice shown on the right. Analysis of Kaplan-Meier survival curves was done using a two-sided log-rank test.
Fig. 3
Fig. 3. αCD25NIB and αCD25PC61 promote equivalent Treg depletion but different effector T cell activation in vivo.
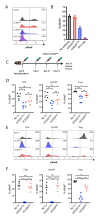
C57BL6 mice were injected with 500,000 MCA205 tumor cells. Once tumors were palpable, on day 5, mice were injected IP with αCD25PC61/αCD25NIB/αCD25NIB + αIL2 (200μg). Tumors and LN were harvested on day 12 post-tumor inoculation and processed as described in materials and methods. (A) Representative FACS plots showing expression of FoxP3 versus CD25 in CD4+ T cells. (B) Graph showing % FoxP3+ cells of total CD4+ cells. (C) Absolute number of Tregs shown as number of Tregs/g of tumor. P-value=0.0086 for No Tx vs αCD25PC61 and p=0.0204 for No Tx vs aCD25NIB group.(D) Ratio of effector T cells over Tregs. On the left, p value for CD8/Treg ratio between No Tx and aCD25NIB= 0.0003. On the right, p value for NK/Treg ratio between No Tx and αCD25NIB=0.0170. (E) Representative FACS plots showing Granzyme B expression versus Ki67 expression in CD8, CD4 effectors and NK cells. (F) Graph showing percentage of Granzyme B+ cells in different effector subsets. In the CD8 subset, p-value between no Tx and αCD25NIB group=0.0452 and 0.0012 for No Tx vs αCD25NIB+ αIL2 group. For the CD4 eff group, p value for No tx vs αCD25PC61=0.0221, between No tx and αCD25NIB=0.0059, between No tx and αCD25NIB +αIL2=0.0276. For the NK subset, p value between the no tx and αCD25NIB group=0.0232. (G) Graph showing the Mean Fluorescence Intensity of Granzyme B of the effector cells plotted in (F). In the CD8 subset, p value for no tx vs αCD25PC61=0.0222, and 0.0190 for No tx vs αCD25NIB + αIL2 group. For the CD4 eff subset, p value between No tx and αCD25NIB=0.0112. For the NK subset, p-value for No tx vs αCD25NIB=0.0057 and between αCD25PC61 vs αCD25NIB=0.0295. All quantification plots: mean, 1-way ANOVA, Tukey’s multiple comparison test (ns=p>0.05, *p<0.05, **p<0.01, ***p<0.001, ****p<0.0001).
Fig. 4
Fig. 4. αCD25NIB as a substrate for combination immunotherapy
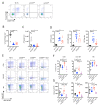
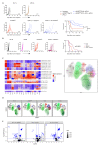
(A) C57BL6 mice were injected with 500,000 MCA205 tumor cells. Treatment with αPD-L1 (200μg) was started day 6, continued on days 9, 12 and 18. Groups receiving αCD25NIB received either 1 dose at day 10 or an additional dose at day 15. Representative growth curves on the left, cumulative survival from 2 independent experiments of those mice is shown on the right. (B) C57BL6 mice were injected with 50,000 B16BL6 tumor cells. Treatment with Gvax was on days 6,9 and 12. αCD25NIB (200μg) was administered on day 5. Cumulative survival of 2 independent experiments shown on the right, representative growth curves on the left. Analysis of Kaplan-Meier survival curves was done using a two-sided log-rank test, p value between αCD25NIB and αPD-L1+ αCD25NIB group=0.0073. (C) (D) and (E) C57BL6 mice were injected with 50,000 B16BL6 tumor cells and treatment was administered as described in (B). Tumors and LN were harvested on day 15 post-tumor inoculation and processed as described in materials and methods section. (C) Lymphoid cell populations integrated across all samples. Heatmap on the left shows min-max scaled, median marker expression of 20 subpopulations identified by unsupervised clustering. The identities of each cluster are annotated based on previously published analyses. The relationship between these clusters in UMAP dimension reduced space is shown in the plot on the right, and the effects of treatment on the lymphoid landscape are shown in (D). Volcano plots in (E) represent differential cluster abundance in comparisons of each treatment group against control.
Fig. 5
Fig. 5. A novel anti-human CD25NIB promotes effective Treg depletion in patient-derived tumor samples in vitro.
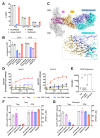
(A) RG6292 did not block IL-2 signaling in a pSTAT5 assay using human PBMCs. Daclizumab was used as blocking control, human IgG1 isotype or untreated samples as reference control. Cells were incubated with 10 μg/ml antibody followed by 10 U/ml IL-2 for 10 min. pSTAT5 was analyzed on CD4+, CD8+ and Treg cells. Shown is the mean of technical duplicates with SD. (B) RG6292 did not negatively impact Granzyme B induction and proliferation of αCD3/αCD28 activated Pan T cells, other than addition of antibodies either neutralizing IL-2 (αIL-2nAB) or blocking binding of IL2 to CD25 (Daclizumab). Antibodies were tested for 72 hours at 10 μg/ml. Shown is the mean of technical triplicates with SD. (C) The Fab fragment of RG6292 binds CD25 opposite of the IL2-CD25 interaction site. Shown is the superposition of the Fab RG6292 - CD25 structure with the IL2 quaternary signaling complex structure (PDB accession code 2B5I). The overlay was prepared using all atoms of CD25. IL2Rβ and IL2Rγ of the quaternary complex are shown as white transparent surface whereas IL2 is highlighted in magenta and CD25 in yellow/ red. The Fab light and heavy chains of RG6292 are colored in cyan and blue, respectively. The close-up section provides a detailed view onto the epitope and paratope area with residues labeled contributing to the interface. Further details are provided in the Supplementary Tables 2-5 and Extended Data Figure 5. (D) RG6292 mediated mostly depletion of CD25 high expressing regulatory T cells and not that of activated CD8 and CD4 effector T cells when present during polyclonal activation (αCD3 coated beads) of human PBMC. The counts of activated regulatory and non-regulatory CD4+ and CD8+ T cells within the PBMC sample were quantified on day 3 by flow cytometry and lysis by PBMC endogenous FcR+ cells was calculated. Shown is the mean of technical triplicates with SEM. (E) CD25 staining was performed to confirm target expression on Treg cells (CD4+ FoxP3+ CFSE high), activated CD4 (CD4+ FoxP3-CD69+) and CD8 T cells (CD8+ CD69+) shown in (D). (F and G) Graphs showing the killing of FoxP3+CD25+ cells within human tumors (frozen dissociated tumor cells obtained from Conversant Bio) supplemented with allogeneic NK cells mediated by RG6292 (and the fully fucosylated (FF) or Fc silent version of RG6292). Shown is the mean of technical duplicates with SD. All quantification plots: 2-way ANOVA, Sidak’s multiple comparisons test (ns=p>0.05, *p<0.05, **p<0.01, ***p<0.001, ****p<0.0001).
Fig. 6
Fig. 6. Anti-human-CD25NIB (RG6292) depletes Treg and drives T cell activation in tumor-bearing humanized mice and cynomolgus monkey.
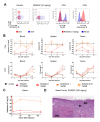
(A and B) Stem cell humanized female NOG mice bearing an established s.c. BxPC-3 tumor were injected i.v. with vehicle, RG6292 [10, 1, 0.1 and 0.01 mg/kg]. Splenocytes, blood lymphocytes and tumor infiltrating lymphocytes were isolated 1, 4, 7 and 14 days after injection and evaluated for depletion of Tregs (huCD45+, huCD3+, huCD4+, huCD25+, huFoxP3+) and activation of CD8+ T cells (huCD45+, huCD3+, huCD8+ GranzymeB+). (A) Representative dot plots and histograms showing the decrease of FoxP3 and the increase of Granzyme B expression on intra-tumoral CD4+ and CD8+ T cells 14 days after treatment with RG6292 compared to vehicle-injected animals. (B) Systemic and dose-dependent decrease in Tregs and an increase in activated CD8+ T cells, respectively, was only evident after administration of RG6292. Each symbol represents the mean of 4 animals, and error bars indicate the SD. Statistical analysis (2 way ANOVA, Dunnet’s multiple comparisons test (ns=p>0.05, *p<0.05, **p<0.01,) of RG6292 treated groups against the vehicle group is indicated. Actual p-values are summarized in tabular form in the supplementary data 1 (C and D) The toxicity and pharmacokinetic/pharmacodynamic (PK/PD) relationship of RG6292 was evaluated in cynomolgus monkeys following Q2W (C) or weekly (D) Repeated IV administrations during 4 (D) and 2 weeks (C), respectively. Shown is the mean of three animals (male and female) +/- SD. (D) The only drug-related finding after application of supra-pharmacological doses (here 100 mg/kg/dose; Q2W) in the 4-week toxicity study, was an exacerbation of ulcerative/erosive rhinitis at 30 and 100 mg/kg shown in the right image (left image of nasal cavity from an unaffected animal for comparison), characterized by (partial) loss of epithelium (arrow) accompanied by inflammatory cell infiltrates (asterisk) in the nasal cavities of individual animals. Reversibility of the nasal lesions was demonstrated. The 4-week GLP toxicity study was conducted according to regulatory guidelines once.

Comment in

References

    1. Plitas G, Rudensky AY. Regulatory T cells: Differentiation and function. Cancer Immunol Res. 2016;4:721–725. - PMC - PubMed
    1. Elpek KG, Lacelle C, Singh NP, Yolcu ES, Shirwan H. CD4 + CD25 + T Regulatory Cells Dominate Multiple Immune Evasion Mechanisms in Early but Not Late Phases of Tumor Development in a B Cell Lymphoma Model. J Immunol. 2007;178:6840–6848. - PubMed
    1. Golgher D, Jones E, Powrie F, Elliott T, Gallimore A. Depletion of CD25+ regulatory cells uncovers immune responses to shared murine tumor rejection antigens. Eur J Immunol. 2002;32:3267–3275. - PubMed
    1. Jones E, et al. Depletion of CD25+ regulatory cells results in suppression of melanomagrowth and induction of autoreactivity in mice. Cancer Immun. 2002 - PubMed
    1. Onizuka S, et al. Tumor rejection by in vivo administration of anti-CD25 (interleukin-2 receptor α) monoclonal antibody. Cancer Res. 1999 - PubMed

Publication types