. 2021 Feb;2(2):174-188.
doi: 10.1038/s43018-020-00150-z. Epub 2020 Dec 7.

Single-cell analyses reveal YAP/TAZ as regulators of stemness and cell plasticity in Glioblastoma

Affiliations

Single-cell analyses reveal YAP/TAZ as regulators of stemness and cell plasticity in Glioblastoma

Martina Castellan et al. Nat Cancer. 2021 Feb.

Abstract

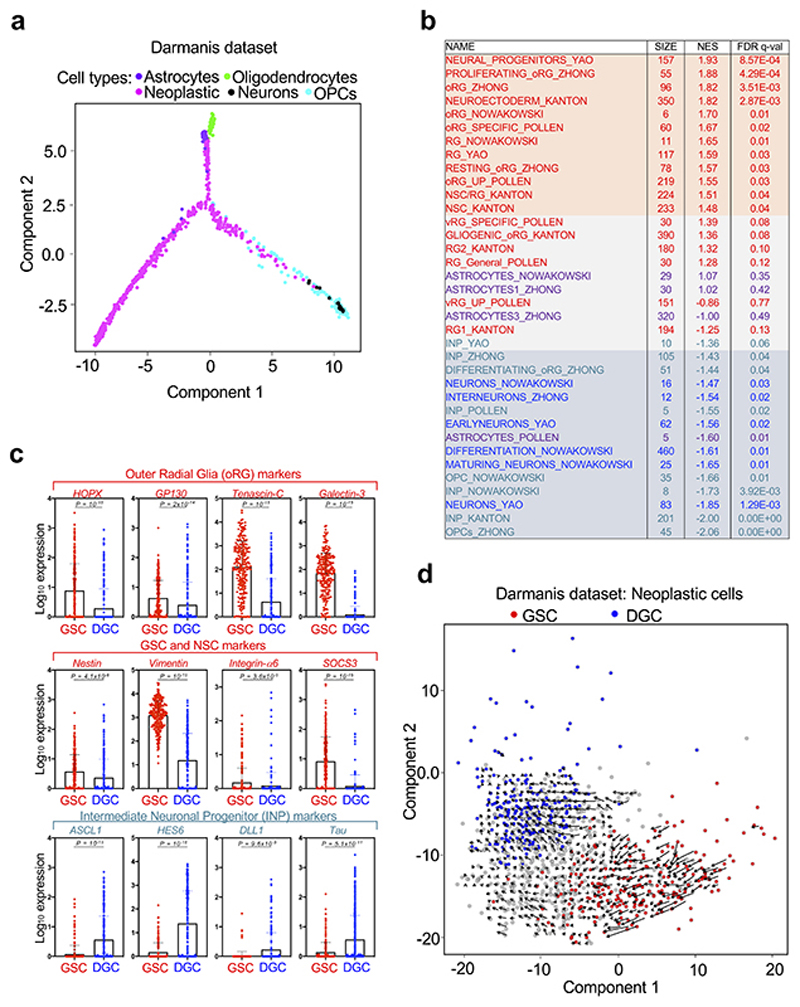
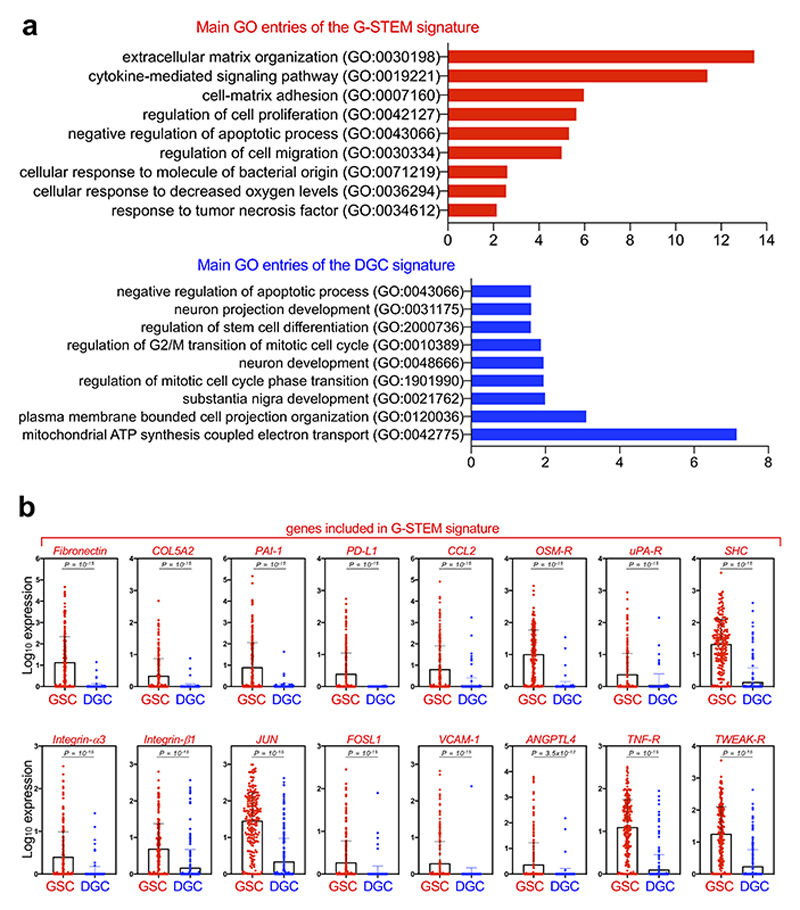
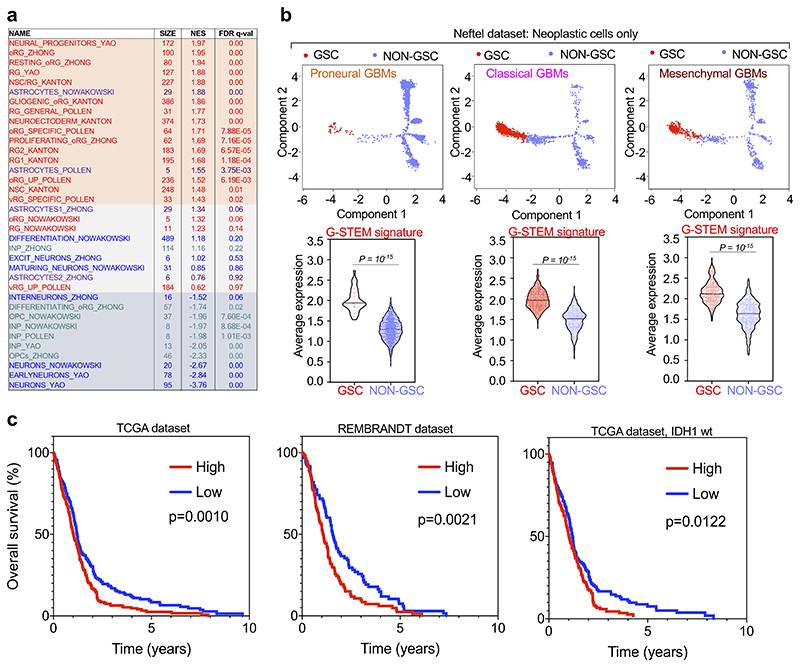
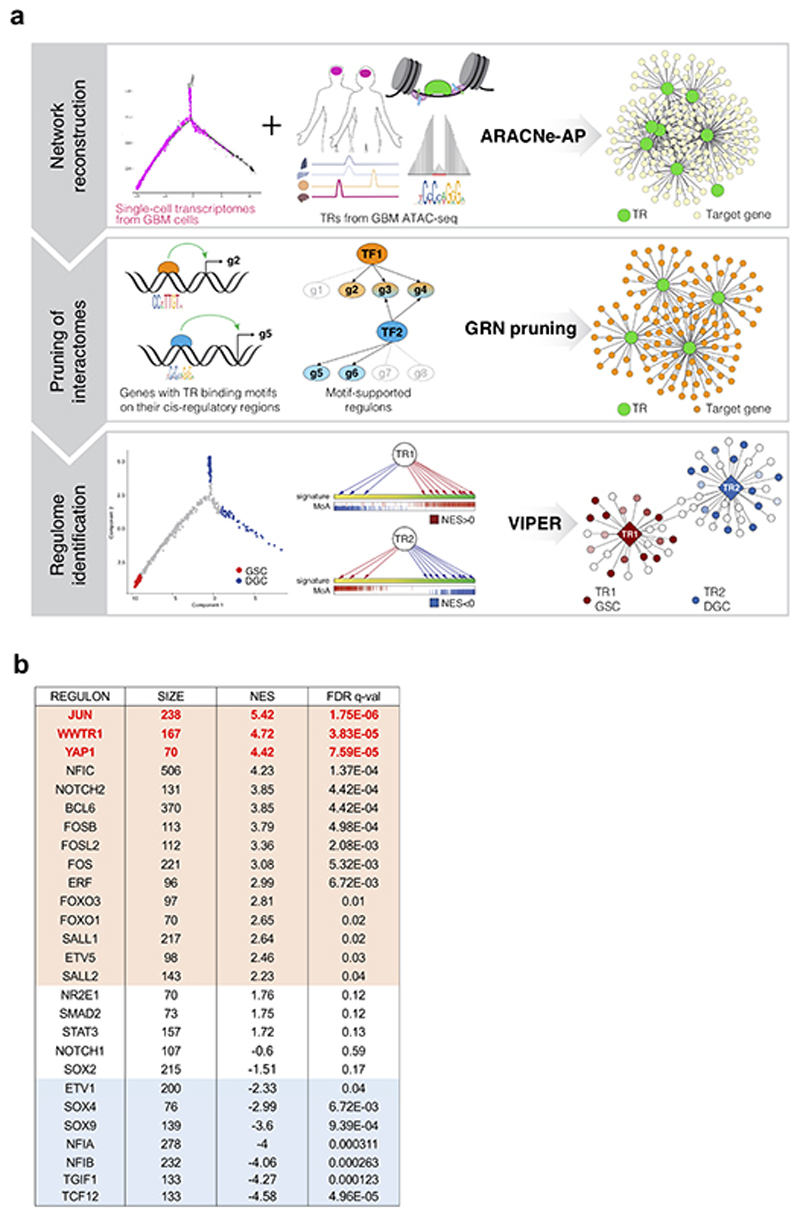
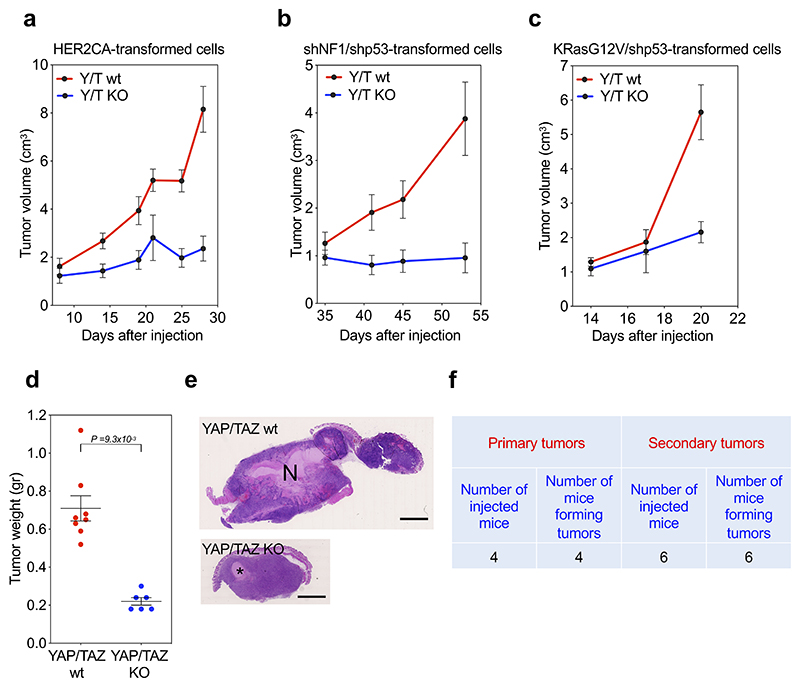
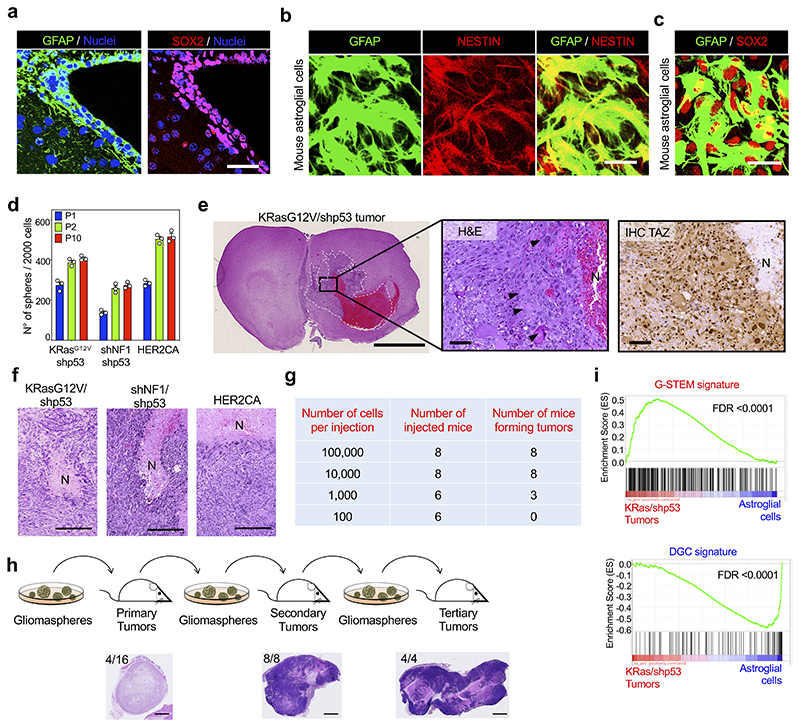
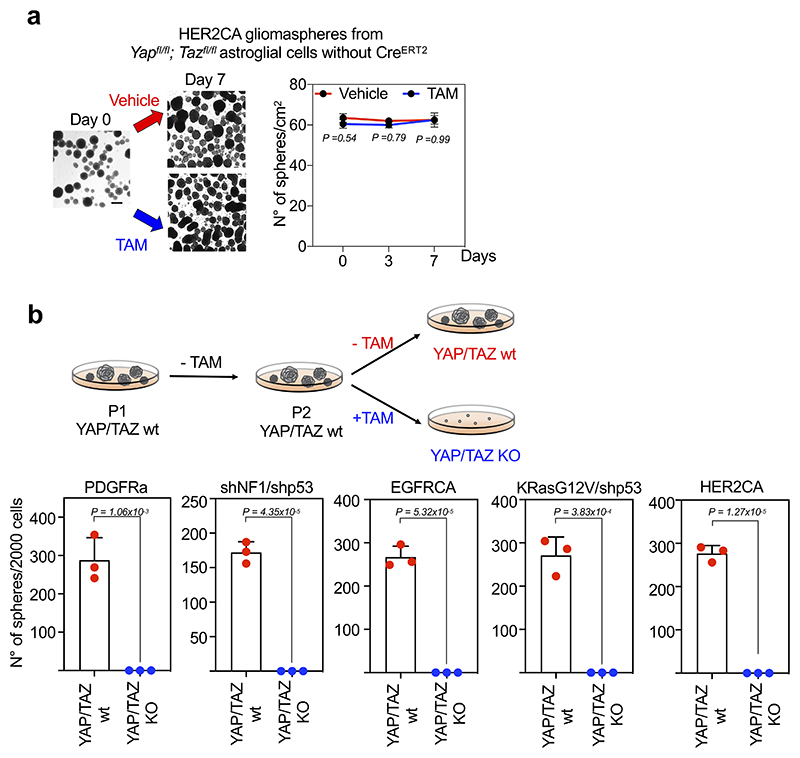
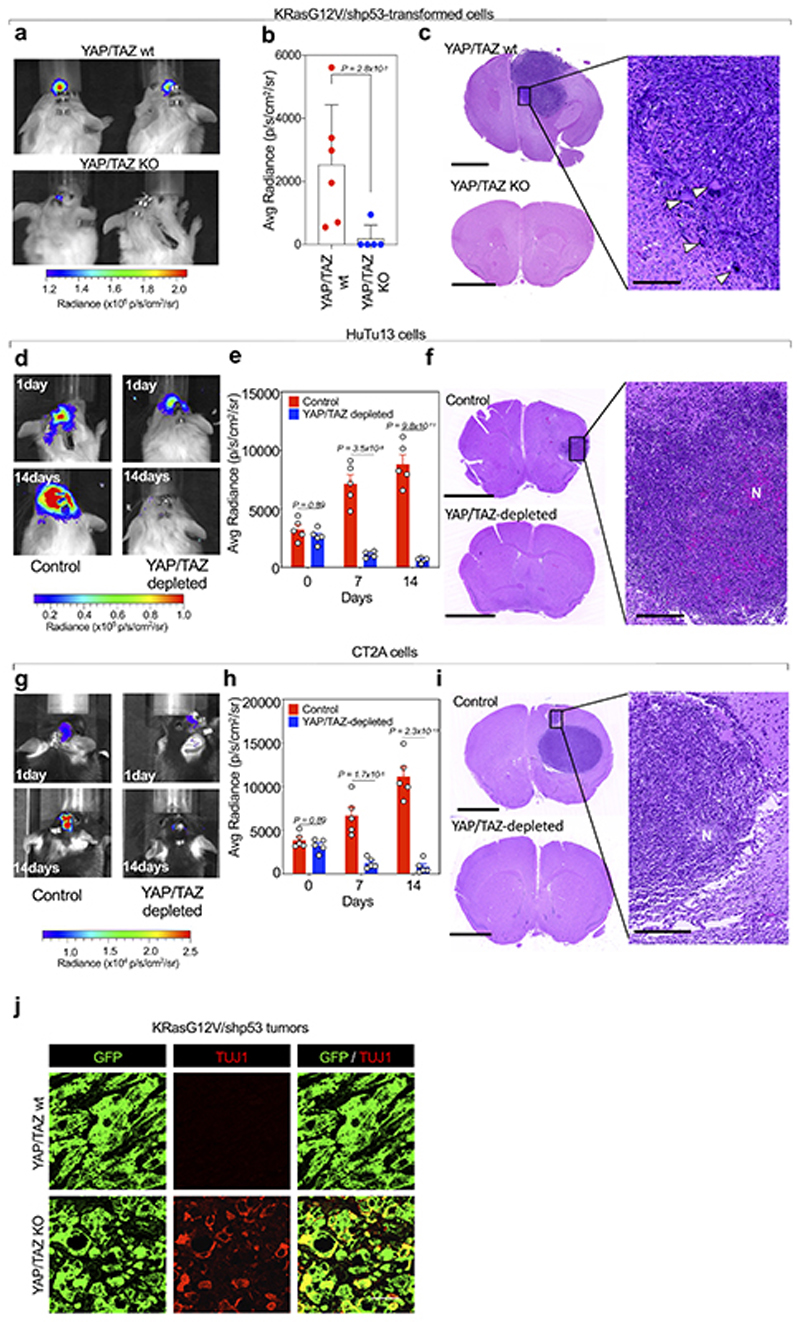
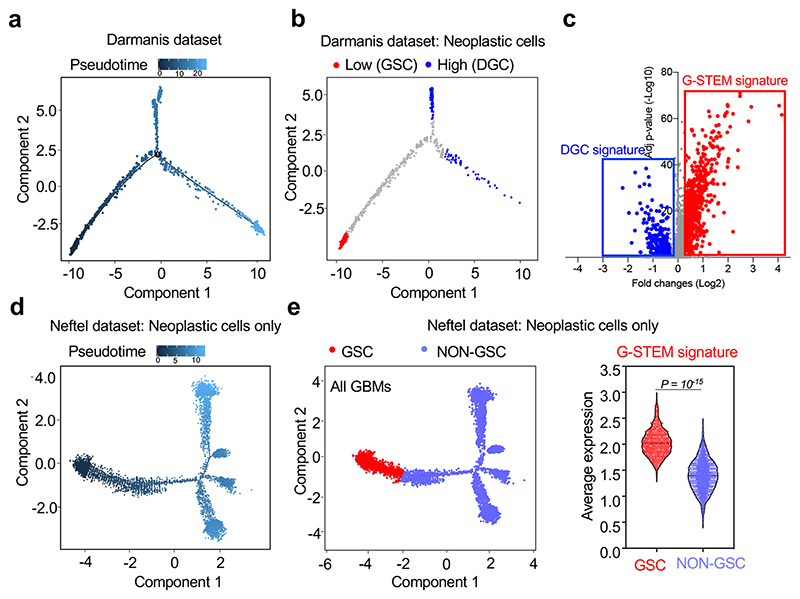
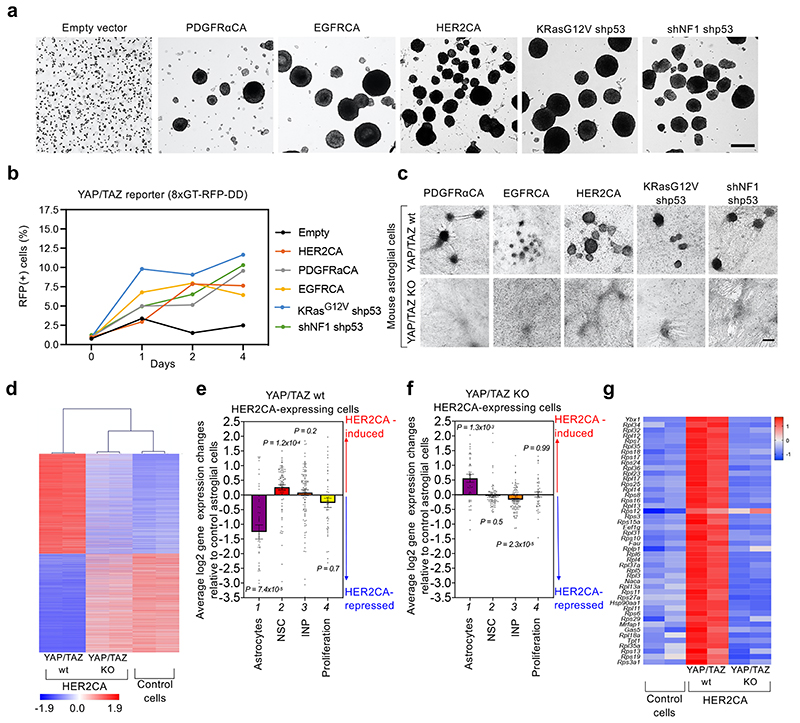
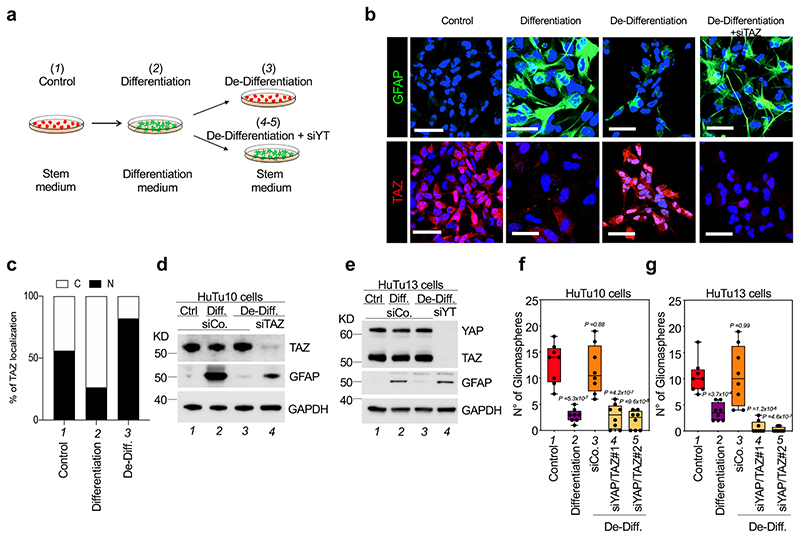
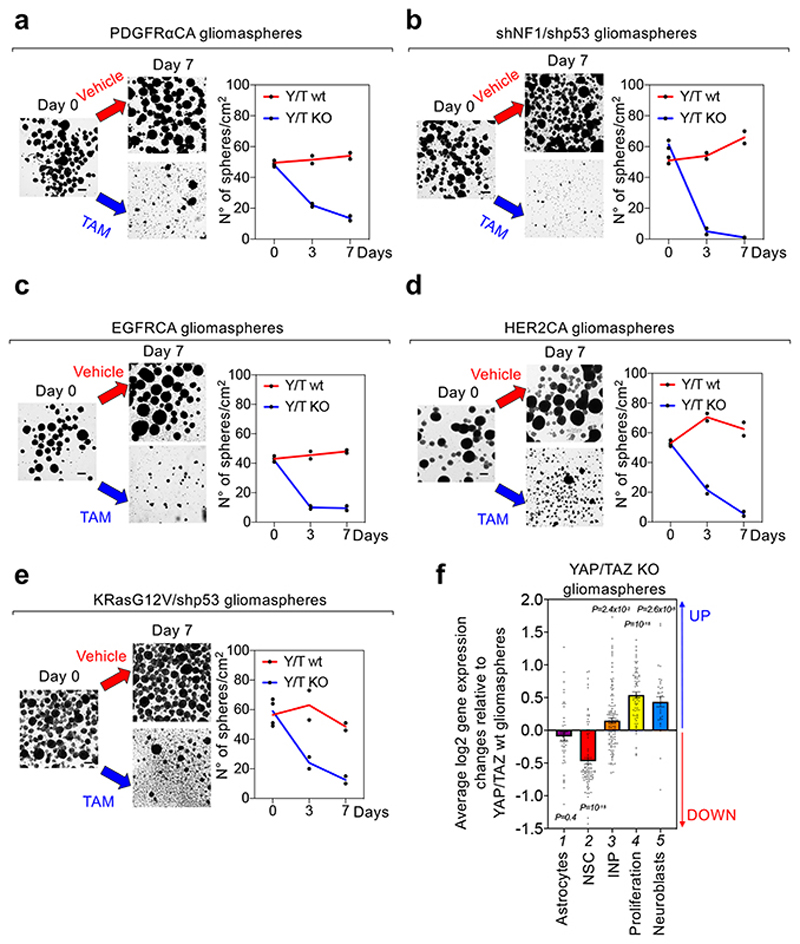
Glioblastoma (GBM) is a devastating human malignancy. GBM stem-like cells (GSCs) drive tumor initiation and progression. Yet, the molecular determinants defining GSCs in their native state in patients remain poorly understood. Here we used single cell datasets and identified GSCs at the apex of the differentiation hierarchy of GBM. By reconstructing the GSCs' regulatory network, we identified the YAP/TAZ coactivators as master regulators of this cell state, irrespectively of GBM subtypes. YAP/TAZ are required to install GSC properties in primary cells downstream of multiple oncogenic lesions, and required for tumor initiation and maintenance in vivo in different mouse and human GBM models. YAP/TAZ act as main roadblock of GSC differentiation and their inhibition irreversibly lock differentiated GBM cells into a non-tumorigenic state, preventing plasticity and regeneration of GSC-like cells. Thus, GSC identity is linked to a key molecular hub integrating genetics and microenvironmental inputs within the multifaceted biology of GBM.


Conflict of interest statement

Competing interests The authors declare no competing interests.

Figures

Extended Data Fig. 1
Extended Data Fig. 1. Identification of the gene expression program of GSCs.
(a) Single-cell differentiation trajectory of GBM cells reconstructed by Monocle2 using single-cell RNA-seq data of the indicated cell populations from primary GBM samples of the Darmanis dataset. (b) Gene set enrichment analysis (GSEA) for association between the cell populations at the start and at the end of the pseudotime trajectory of the neoplastic cells of the Darmanis datasets (as depicted in Fig. 1c), and gene sets denoting the identity of specific cell types. Gene lists denoting early neural progenitor cells (RG: Radial Glia; oRG: outer Radial Glia; vRG: ventricular Radial Glia) or neural stem cells (NSC) are indicated in red; those identifying neurons, astrocytes or committed neuronal progenitors (OPC: Oligodendrocyte Progenitor Cells; INP: Intermediate Neuronal Progenitors) are, respectively, in blue, purple and blue-green colors; gene lists enriched in the putative GSC and DGC populations are highlighted in orange and in light blue, respectively. Signatures are available in Supplementary Table 1. GSEA calculated FDR adjusting for multiple comparisons; details of p-value and FDR calculation are described in the GSEA website (http://software.broadinstitute.org/gsea/index.jsp). Related to Fig. 1c. (c) Log2 expression levels of the indicated oRG (top graphs), NSC and GSC (middle graphs) and INP markers (bottom graphs) in the subpopulations of neoplastic cells of the Darmanis dataset that are at the start (GSC, n=221 cells) and at the end (DGC, n=221 cells) of the pseudotime trajectory depicted in Fig. 1c. Data are presented as mean + s.d. p-values were determined by unpaired two-tailed t test. (d) RNA velocities (arrows) of neoplastic cells of the Darmanis dataset projected in the space of the first two principal components. Red and blue dots are the cells that are at the start (GSC) and at the end (DGC) of the pseudotime trajectory depicted in Fig. 1c.
Extended Data Fig. 2
Extended Data Fig. 2. Validation of the G-STEM signature.
(a-b) Violin plots showing the expression of the G-STEM signature (right panels in (b)) on the cells at the start (Low; red dots in the left panels in (b)) of the pseudotime trajectories (a) of patient-specific cohorts of the Darmanis dataset, vs. the neoplastic cells that are on the opposite ends of the same trajectories (High; blue dots in the left panels in (b)). The p-values were determined by two-tailed Mann-Whitney test. (c) Violin plots showing the expression of the G-STEM signature (right panel) on the cells at the start (Low; red dots in the middle panel) of the pseudotime trajectory (left panel) of the sole neoplastic cells of the Darmanis dataset, vs. the cells that are on the opposite ends of the same trajectory (High; blue dots in the middle panel). The p-values were determined by two-tailed Mann-Whitney test.
Extended Data Fig. 3
Extended Data Fig. 3. Characterization of the G-STEM signature.
(a) Graphs depicting the most significant GO terms emerging from the Gene Ontology analyses of the genes composing the G-STEM and the DGC signatures. The full lists of significant GO terms of both signatures are in Supplementary Table 3. (b) Log2 expression levels of the indicated components of the G-STEM signature in in the subpopulations of neoplastic cells of the Darmanis dataset that are at the start (GSC, n=221 cells) and at the end (DGC, n=221 cells) of the pseudotime trajectory depicted in Fig. 1c. Data are presented as mean + s.d. p-values were determined by unpaired two-tailed t test.
Extended Data Fig. 4
Extended Data Fig. 4. Validation of the G-STEM signature in large datasets of GBM patients.
(a) Gene set enrichment analysis (GSEA) for association between the cell population at the start of the pseudotime trajectory of the neoplastic cells of the Neftel datasets (as depicted in Fig. 1e) vs. all the other neoplastic cells and gene sets denoting the identity of specific cell types. Abbreviations and color codes are as in Extended Data Fig. 1b. Signatures are available in Supplementary Table 1. GSEA calculated FDR adjusting for multiple comparisons; details of p-value and FDR calculation are described in the GSEA website (http://software.broadinstitute.org/gsea/index.jsp). Related to Fig. 1e. (b) Violin plots showing the expression of the G-STEM signature (bottom panels) on the cells at the start of the pseudotime trajectory (GSC; red dots in the top panels) of small tumor cohorts of the Neftel dataset, pre-sorted according to the Proneural, Classical or Mesenchymal classification of GBMs, vs. all the other neoplastic cells of the same cohorts (NON GSC; light blue dots in the top panels) of the same dataset. The p-values were determined by two-tailed Mann-Whitney test. (c) Kaplan–Meier analysis representing the probability of survival in n=541 GBM patients from the TCGA dataset (left panel), n=210 GBM patients from the REMBRANDT dataset (middle panel), and n=390 GBM patients carrying wild-type IDH1 from the TCGA dataset (right panel), stratified according to high or low GSC-signature. The p-value of the Log-rank (Mantel-Cox) test reflects the significance of the association between GSC-signature “low” and longer survival. G-STEM expression is prognostic for the vast majority of GBM, that is IDH1-wild type tumors (93%, of those annotated in the TGCA dataset; n=390 out of 419 IDH1-annotated samples).
Extended Data Fig. 5
Extended Data Fig. 5. A computational procedure to identify candidate TRs controlling the gene expression program of GSCs.
(a) Overview of the experimental flow for inference of the master Transcriptional Regulators (TRs) of the GSC state using the Rhabdomant pipeline on the Darmanis sc-RNA-seq dataset of primary GBM samples. See Methods for details. (b) List of candidate master Transcriptional Regulators (TRs) emerging from the analysis of the Darmanis dataset of scRNA-seq dataset with the Rhabdomant pipeline, ordered on the base of their normalized enrichment signal (NES). The Rhabdomant pipeline calculated FDR adjusting for multiple comparisons; see Methods for details about p-value and FDR calculation. The lists of candidate master TRs of the GSC and of the DGC state are highlighted in orange and in light blue, respectively. The most significant candidate master TRs of the GSC state are indicated in red.
Extended Data Fig. 6
Extended Data Fig. 6. YAP/TAZ are required for GSC maintenance in vivo.
(a-c) Effects of YAP/TAZ knockout on the growth of established subcuteaneous GBM-like lesions. Transformed cells were obtained by dissociation of gliomaspheres obtained from HER2CA- (a), shNF1/shp53- (b) or KRasG12V/shp53- (c) transformed R26CAGCreERT2; Yapfl/fl; Tazfl/fl newborn mouse astroglial cells (as in Fig. 3), and then injected in NOD-SCID mice. When subcutaneous tumors reached approximately 0.5 cm of diameter, mice were either fed with Tamoxifen food to induce YAP/TAZ knockout (YAP/TAZ KO), or maintained under normal diet (YAP/TAZ wt). Graphs are growth curves of YAP/TAZ wt (KRasG12V/shp53-, n=4 mice; HER2CA, n=6 mice; shNF1/shp53, n=5 mice) and YAP/TAZ KO (KRasG12V/shp53-, n=4 mice; HER2CA, n=4; shNF1/shp53, n=8 mice) tumors (average volume ± s.e.m.). (d, e) Effects of YAP/TAZ knockout in tumors derived from KRasG12V/shp53 gliomaspheres, following the experimental setup described in a-c. (d) Dot plot for tumor weight at sacrifice (YAP/TAZ wt, n=8; YAP/TAZ KO, n=6). Mean ± s.e.m. of the distribution are also shown. p-value was calculated by unpaired two-tail t-test. (e) Representative H&E stainings. Scale bar, 2.5 mm. N, necrotic area; *, Matrigel residue. (f) Tabular results showing the number of NOD/SCID mice displaying subcutaneous tumor formation after injection of cells dissociated either from gliomaspheres derived from HER2CA-transformed primary newborn astroglial cells (Primary tumors), or from HER2CA-gliomaspheres derived from one of the Primary tumors (Secondary tumors).
Extended Data Fig. 7
Extended Data Fig. 7. Ex-vivo reprogramming of normal neural cells into GSC-like cells.
(a) GFAP and SOX2 stainings (scale bars, 50 μm) of the mouse SVZ, representative of n=3 mice. Nuclei were counterstained with DAPI. (b, c) GFAP, NESTIN and SOX2 stainings (scale bars, 50 μm) in mouse newborn astroglial cells, representative of two independent experiments. (d) Gliomaspheres emerging from newborn astroglial cell cultures transformed by the indicated oncogenes (P0 spheres) were dissociated to single cells and replated at clonal density for gliomasphere formation (P1 to P10 spheres). Results are representative of three experiments with n=3 replicates each. Data are presented as scatter dot plots and bar graphs showing mean with s.d. (e) Left panel: H&E staining of a lesion obtained after intracranial transplantation of shNf1/shp53-transformed astroglial cells. N, necrotic area. Scale bar, 2.5 mm. Middle panel: High magnification of the same tumor, showing large polynucleated cells (arrowheads). Right panel: TAZ IHC on the same tumor. Scale bars, 100 μm. Experiments were independently repeated on n=10 mice, with similar results. (f) H E staining of subcutaneous tumors obtained by injecting cells dissociated from gliomaspheres carrying the indicated oncogenic lesions, representative of: KRasG12V/shp53, n=4 tumors; HER2CA, n=6 tumors; shNf1/shp53, n=5 tumors. N, necrotic areas. Scale bars, 250 μm. (g) Number of mice displaying tumor formation after injection of cells dissociated from KRasG12V/shp53-gliomaspheres at the indicated cell dilutions. (h) Top, Schematic representation of the serial transplantation assay performed with HER2CA-transformed cells (see Methods for details). Bottom, H&E staining (scale bars, 2.5 mm) of tumors obtained after each round of transplantation, representative of n=4 primary tumors, n=8 secondary tumors and n=4 tertiary tumors, respectively. Numbers of mice developing tumors per numbers of transplanted mice are indicated in each picture. (i) GSEA curves of the G-STEM and the DGC signatures in KRasG12V/shp53-tumors compared to the astroglial cells from which they derive. Signatures are available in Supplementary Table 7.
Extended Data Fig. 8
Extended Data Fig. 8. Oncogenic insults activate YAP/TAZ in transformed primary astroglial cells.
(a) Bright-field and fluorescent pictures (representative of n=5 independent samples each) of newborn astroglial cells transduced with lentiviral vectors encoding for the YAP/TAZ reporter 8xGTIIC-RFP-DD, and with lentiviral vectors encoding for the indicated oncogenes or, as negative control, with empty vector, as in Fig. 3b. Images were taken 4 days after inducing oncogenic reprogramming by incubating cells in NSC medium. Scale bars, 50 μm. (b) Compendium of Fig. 3c. Efficiency of Yap and Taz downregulation in R26CAG-CreERT2; Yapfl/fl; Tazfl/fl mouse newborn astroglial cells treated with either vehicle (Control) or 4OH-TAM (YAP/TAZ KO), as measured by qRT-PCR (mean + s.d. of all independent samples of three experiments). p-values are calculated by two-way ANOVA with Sidak’s multiple comparisons.
Extended Data Fig. 9
Extended Data Fig. 9. YAP/TAZ are required for GSC maintenance in vitro.
(a) Control experiment of Fig. 5a-e. Gliomaspheres derived from HER2CA-transformed Yapfl/fl; Tazfl/fl newborn astroglial cells, not expressing CREERT2, were treated with either ethanol (Vehicle) or 4OH-TAM (TAM). Panels are representative images (left; scale bar, 100 μm) and quantifications (right; mean ± s.d. of two independent experiments, each performed with two replicates) of the number of gliomaspheres/cm in vehicle versus 4OH-TAM-treated samples. p-values were determined by two-way ANOVA with Sidak’s multiple comparisons test. In the absence of CREERT2 expression 4OH-TAM tamoxifen is inconsequential for gliomasphere formation, indicating that gliomasphere disaggregation shown in Fig. 4a-e is specifically caused by YAP/TAZ deletion. (b) P2 gliomaspheres derived from R26CAG-CreERT2; Yapfl/fl; Tazfl/fl newborn astroglial cells transformed with the indicated oncogenes were dissociated to single cells and replated at clonal density for P3 gliomasphere formation in presence of ethanol (YAP/TAZ wt), or of 4OH-TAM to induce YAP/TAZ knockout (YAP/TAZ KO). Data are presented as scatter dot plots (n=3 replicates each) and bar graphs showing mean with s.d. The p-values were calculated by unpaired two-tailed t-test.
Extended Data Fig. 10
Extended Data Fig. 10. YAP/TAZ are required for GBM initiation in vivo.
(a-c) Immunocompromised mice were injected intracranially with KRasG12V/shp53-transformed Yapfl/fl;Tazfl/fl cells, also transduced with dual luciferase-GFP expression vectors. Control animals (n=6) were injected with cells transduced with Ad-GFP, whereas YAP/TAZ KO animals (n=5) were injected with cells transduced with Ad-Cre. (a) Representative images of brain bioluminescence. (b) Bioluminescence quantification shown as scatter dot plots and bar graphs showing mean with s.d; p-value was calculated by unpaired two-tailed t-test. (c) Representative H&E stainings. Scale bars, 2.5 mm in left panels and 250 μm in the magnification shown on the right. Arrowheads highlight the presence of large, polynucleated cells. (d-f) Immunocompromised mice were injected intracranially with HuTu13 cells transduced with dual luciferase-GFP expression vectors, and transfected with siCo (Control; n=5) or siYAP/TAZ (YAP/TAZ depleted; n=5). (d) Representative images of brain bioluminescence. (e) Bioluminescence quantification shown as scatter dot plots and bar graphs showing mean with s.d.; unpaired two-tailed t-test p-values are shown. (f) Representative H&E stainings. Scale bars, 2.5 mm in left panels and 250 μm in the magnification shown on the right. ‘N’ indicates necrosis. (g-i) CT2A cells were transduced with dual luciferase-GFP expression vectors and injected intracranially in syngeneic mice. Control animals (n=5) were injected with cells expressing anti-GFP shRNA, whereas YAP/TAZ-depleted animals (n=5) were injected with cells expressing doxycycline-inducible YAP and TAZ shRNAs. (g) Representative brain bioluminescences at one day and 14 days after injection. (h) Bioluminescence quantification at three different time points shown as scatter dot plots and bar graphs showing mean with s.d.; unpaired two-tailed t-test p-values are shown. (i) Representative H&E stainings. Scale bars, 2.5 mm in left panels and 250 μm in the magnification shown on the right. N, necrotic areas. (j) GFP and TUJ1 stainings in sections from YAP/TAZ-wt and YAP/TAZ-KO subcutaneous shNF1/shp53-induced tumors (representative of n=3 independent samples each). Scale bars, 50 μm.
Fig. 1
Fig. 1. A gene expression program identifying native GSCs.
(a) Single-cell differentiation trajectory of GBM cells reconstructed by Monocle2 using single-cell RNA-seq data from primary GBM samples of the Darmanis dataset, using the cell populations indicated in Extended Data Fig. 1a. (b) Single-cell differentiation trajectory of the GBM cells of the Darmanis dataset hilighting the putative GSC and DGC cell populations, identified as neoplastic cell populations displaying Low (< first quartile) or High (> third quartile) pseudotime values, respectively. (c) Volcano plot of the gene expression changes between the GSC and DGC populations of the Darmanis dataset, with indicated the genes composing the G-STEM and the DGC signatures. (d) Single-cell trajectory of GBM cells reconstructed by Monocle2 using single-cell RNA-seq data from the sole neoplastic cells of primary GBM samples of the Neftel dataset. (e) Violin plots showing the expression of the G-STEM signature (right panel) on the cells at the start of the pseudotime trajectory of the Neftel dataset (GSC; red dots in the left panel) vs. all the other neoplastic cells (NON GSC; light blue dots in the left panel). The p-value was determined by two-tailed Mann-Whitney test.
Fig. 2
Fig. 2. YAP/TAZ are master Transcriptional Regulators of the GSC state.
(a) Depiction of the part of the GRN of GBM controlled by YAP1, TAZ (WWTR1) and their downstream TRs. TRs are represented as diamonds; genes composing the G-STEM signature are represented as yellow dots with red borders; all the other genes composing the regulons of YAP/TAZ and of downstream TRs are depicted as small grey dots. Black edges identify the regulatory interactions between YAP/TAZ and their downstream TRs. (b, c) Gene Set Enrichment Analysis (GSEA) enrichment score curves of the G-STEM signature (b) and the list of TRs found downstream to YAP/TAZ in the GRN of GBM (FOXO1, SALL1, FOS, FOXO3, BCL6 and ERF) (c) in YAP/TAZ knockout vs. YAP/TAZ wild-type subcutaneous KRASG12V/shp53 GBM-like tumors obtained as described in Extended Data Fig. 6. Signatures are available in Supplementary Table 7. (d) Right panel: Heatmap showing the percentage of cells showing nuclear TAZ as deduced by immunohistochemistry (IHC) of samples from different tumor areas of 67 GBMs. Left panels: pictures of TAZ IHC in GBM samples from three different tumor areas (representative of n=25 peripheral samples, top; n=38 tumor bulk samples, middle; n=28 perinecrotic samples, bottom). ‘N’ indicates necrotic areas. Scale bars, 100 μm. (e) Right panel: Heatmap showing standardized gene expression of the G-STEM and the DGC signatures in different histologically-defined tumor domains (the pseudopalisading cells located around necrotic areas, the “cellular tumor”, representing the bulk of tumor cells, the “infiltrating tumors” areas, where tumor cells insinuate themselves into the normal tissue, and the tumor cell-free margin, called the“leading edge”) of six different GBMs from the Ivy Atlas. Left panel: Schematics of the histologically-defined tumor domains of GBM.
Fig. 3
Fig. 3. YAP/TAZ are required for oncogene-dependent transformation of primary normal neural cells.
(a) Mouse newborn astroglial cells were transduced either with empty vector or with lentiviral vectors encoding for the indicated oncogenes. Bright field images of gliomaspheres (representative of n=3 experiments each) are shown. As negative control, newborn astroglial cells transduced with empty vector were not able to form any gliomasphere in suspension. Scale bar, 100 μm. (b) Mesurement of YAP/TAZ activity in mouse newborn astroglial cells during the first days of oncogenic reprogramming. Cells were transduced with with lentiviral vectors encoding for the YAP/TAZ reporter 8xGTIIC-RFP-DD, and with lentiviral vectors encoding for the indicated oncogenes or, as negative control, with empty vector. The graph represents the percentage of RFP-positive cells detected in newborn astroglial cell cultures at the indicated time points after the start of oncogenic reprogramming in NSC medium. The number of cells counted for each sample is reported in the corresponding Source Data file. (c) YAP/TAZ are required for oncogene-induced transformation of mouse newborn astroglial cells. Cells from R26CAG-CreERT2; Yapfl/fl; Tazfl/fl animals were transduced with lentiviral vectors encoding for the indicated oncogenes and then cultured in NSC medium to form gliomaspheres. When 4OH-Tamoxifen (4OH-TAM) was added to the NSC medium to induce YAP/TAZ depletion, no gliomaspheres arising from the cell monolayer were observed. Images are representative of n=3 experiments each. Scale bar, 100 μm. See also Extended Data Fig. 8b for efficiency of Yap/Taz depletion. (d) Hierarchical clustering of gene expression profiles from RNA-seq data of control (right), or HER2CA-expressing mouse newborn astroglial cells, either in the presence of endogenous YAP/TAZ (YAP/TAZ wt, left) or in YAP/TAZ-knockout setting (YAP/TAZ KO, middle). The heatmap shows standardized expression of genes significantly upregulated or downregulated in YAP/TAZ wt astroglial cells expressing HER2CA, compared to control cells. Genes are ordered according to decreasing average expression in HER2CA-transduced YAP/TAZ wt astroglial cells. (e, f) Average log2 gene-expression changes of signatures for the indicated cell types (Astrocytes n=45 genes; NSC n=89 genes; INP n=106 genes) or for proliferating neural progenitors (Proliferation n=45 genes) in HER2CA-expressing YAP/TAZ wt newborn astroglial cells (e) or HER2CA-expressing YAP/TAZ KO newborn astroglial cells (f), compared to control newborn astroglial cells. NSC: Neural Stem Cells; INP: Intermediate Neuronal Progenitors. Signatures are derived from Ref and listed in Supplementary Table 6. Data are shown as mean and standard error of the mean (s.e.m.). Positive and negative values indicate, respectively, upregulation and downregulation of the indicated signatures by expression of HER2CA in newborn astroglial cells. p-values were determined by Brown-Forsythe and Welch one-way ANOVA test with Dunnett’s T3 multiple comparisons of the distribution of log2 gene-expression changes of each signature with the distribution of log2 gene-expression changes for all expressed genes (n=11,946). (g) Heatmap showing standardized gene expression of NSCs marker genes upregulated by HER2CA in YAP/TAZ wt newborn astroglial cells (middle) compared to control cells (Co.; left) and HER2CA-expressing YAP/TAZ-KO cells (right). Genes are ordered according to the decreasing average scores in HER2CA-expressing YAP/TAZ wt newborn astroglial cells. The only gene that is upregulated by HER2CA expression irrespectively of YAP/TAZ knockout is Rps12.
Fig. 4
Fig. 4. YAP/TAZ control GBM cell plasticity.
(a) Schematic representation of the experimental setup used to promote differentiation of HuTu cells, and then revert them back to a dedifferentiated state. (b-e) Effects of TAZ depletion on the plasticity of HuTu10 and HuTu13 cells subjected to the differentiation/de-differentiation protocol depicted in (a). (b) Representative GFAP and TAZ stainings (scale bars, 100 μm). (c) Quantifications of the percentage of cells showing predominantly nuclear ‘N’ or predominantly cytoplasmic ‘C’ TAZ localization. Data are representative of at least 200 cells for each condition. (d, e) Western blot analysis for GFAP and YAP/TAZ; GAPDH serves as loading control. Uncropped images are in Source Data. Experiments were independently repeated three (d) and two (e) times, with similar results. (f, g) HuTu10 (f) and HuTu13 (g) cells were subjected to the differentiation/de-differentiation protocol depicted in (a) and plated for sphere-forming assays. Panels are quantifications of gliomaspheres (n=8), presented as box and whisker plots: the box extends from the 25th to the 75th percentile, the line within the box represents the median, whiskers extend to show the highest and lowest values. For each condition, experiments were repeated four times with two independent replicas. All data are plotted. p-values were determined by one-way ANOVA with Dunnett’s T3 multiple comparisons.
Fig. 5
Fig. 5. YAP/TAZ are required to prevent GSC differentiation.
(a-e) Gliomaspheres derived from PDGFRαCA (a)-, shNF1/shp53 (b)-, EGFRCA- (c), HER2CA- (d), or KRasG12V/shp53- (e) transformed R26CAG-CreERT2; Yapfl/fl; Tazfl/fl newborn astroglial cells were treated with either ethanol (YAP/TAZ wt) or 4OH-Tamoxifen (YAP/TAZ KO). Shown are representative images (left; scale bar, 100 μm) and quantifications (right; mean and individual data points of two independent experiments, each performed with two replicas) of the number of gliomaspheres/cm in vehicle versus TAM-treated samples. See also Extended Data Fig. 9a for a specificity control, showing that, in absence of CREER-expression, 4OH-Tamoxifen does not induce gliomasphere disaggregation. (f) Analysis of RNA-seq data from gliomaspheres derived from KRasG12V/shp53-transformed R26CAG-CreERT2; Yapfl/fl; Tazfl/fl newborn astroglial cells and treated either with vehicle or with 4OH-TAM as described above. The graph shows average log2 gene-expression changes of signatures for the indicated cell types (Astrocytes n=44 genes; NSC n=89 genes; INP n=119 genes; Neuroblasts n=37 genes) or for proliferating neural progenitors (Proliferation n=66 genes) in 4OH-TAM-treated (YAP/TAZ KO) KRasG12V/shp53 gliomaspheres, compared to vehicle-treated (YAP/TAZ wt) KRasG12V/shp53 gliomaspheres. Abbreviations are as in Fig. 3e, f. Data are shown as mean and standard error of the mean (s.e.m.). Positive and negative values indicate, respectively, upregulation and downregulation of the indicated signatures after YAP/TAZ knockout. p-values were determined by Brown-Forsythe and Welch one-way ANOVA test with Dunnett’s T3 multiple comparisons of the distribution of log2 gene-expression changes of each signature with the distribution of log2 gene-expression changes for all expressed genes (n=12,211).
Fig. 6
Fig. 6. YAP/TAZ are required for GBM initiation by preventing GSC differentiation.
(a-d) Immunocompromised mice were injected intracranially with shNF1/shp53-transformed cells derived from Yapfl/fl; Tazfl/fl newborn astroglial cells, also transduced with dual luciferase-GFP expression vectors. Control (YAP/TAZ wt) animals (n=5) were injected with cells transduced with Ad-GFP, whereas YAP/TAZ KO refers to animals (n=5) injected with cells transduced with Ad-Cre. (a) Representative images of brain bioluminescence. (b) Bioluminescence quantification shown as scatter dot plots and bar graphs showing mean with s.d.; p-value was calculated by unpaired two-tailed t-test. (c) Representative H&E staining; scale bar, 1 mm. (d) Magnification of the tumor generated by YAP/TAZ wt cells; scale bar, 250 μm. Arrowheads point to polynucleated giant cells, a characteristic trait of giant cells Glioblastoma. (e-g) GL261 cells, an established mouse model of GBM, were injected intracranially in syngeneic (C57BL/6) mice. Control animals (n=5) were injected with cells transduced with lentiviral vectors coding for control shRNA, whereas YAP/TAZ-depleted refers to animals (n=5) injected with cells transduced with lentiviral vectors coding for doxycycline-inducible YAP and TAZ shRNAs and exposed to doxycycline prior to injection to induce YAP/TAZ depletion. Cells were also transduced with dual luciferase-GFP expression vectors. To sustain YAP/TAZ depletion after injection, doxycycline was added to the drinking water of all mice. (e) Representative images of brain bioluminescence at one day and 14 days after injection. (f) Bioluminescence quantification at three different time points shown as scatter dot plots and bar graphs showing mean with s.d.; unpaired two-tailed t-test p-values are shown. (g) Representative H&E stainings of brain sections from mice injected with control (upper panel and corresponding magnification) or with YAP/TAZ-depleted GL261 cells (middle and lower panels), the latters displaying either no remaining tumor cells (middle panel, representative of n=3 mice), or a residual amount of injected cells converging toward the right ventricle (lower panel and corresponding magnification, representative of n=2 mice). Scale bars, 2.5 mm in left panels and 250 μm in the magnifications shown on the right. ‘N’ indicates necrotic areas. (h) Representative GFP and TUJ1 stainings (scale bars, 50 μm) in sections from the same mouse brains injected with control (upper panel) or YAP/TAZ depleted GL261 cells (lower panel) shown in the upper and lower panels of (g), respectively. The arrowhead point to a single TUJ1-positive cell in the control tumor. (i) Gene Set Enrichment Analysis (GSEA) enrichment score curve of known markers of neuronal differentiation of NSC in YAP/TAZ KO vs. YAP/TAZ wt subcutaneous tumors from KRasG12V/shp53-transformed cells, following the experimental setup indicated in Extended Data Fig. 6. Signatures are available in Supplementary Table 7. (j) GFP and TUJ1 stainings (scale bars, 50 μm) in sections from YAP/TAZ wt and YAP/TAZ KO tumors (representative of n=3 independent tumor samples each) derived from shNF1/shp53-transformed cells, following the experimental setup indicated in Extended Data Fig. 6.

Comment in

  • Seeing the GBM diversity spectrum.
    Hubert CG, Lathia JD. Hubert CG, et al. Nat Cancer. 2021 Feb;2(2):135-137. doi: 10.1038/s43018-021-00176-x. Nat Cancer. 2021. PMID: 35122081 No abstract available.

References

    1. Chen J, McKay RM, Parada LF. Malignant glioma: lessons from genomics, mouse models, and stem cells. Cell. 2012;149:36–47. - PMC - PubMed
    1. Singh SK, et al. Identification of human brain tumour initiating cells. Nature. 2004;432:396–401. - PubMed
    1. Galli R, et al. Isolation and characterization of tumorigenic, stem-like neural precursors from human glioblastoma. Cancer research. 2004;64:7011–7021. - PubMed
    1. Bao S, et al. Glioma stem cells promote radioresistance by preferential activation of the DNA damage response. Nature. 2006;444:756–760. - PubMed
    1. Gimple RC, Bhargava S, Dixit D, Rich JN. Glioblastoma stem cells: lessons from the tumor hierarchy in a lethal cancer. Genes & development. 2019;33:591–609. - PMC - PubMed

Publication types