

High-sensitive clinical diagnostic method for PTPRZ1-MET and the characteristic protein structure contributing to ligand-independent MET activation
- PMID: 33645009
- PMCID: PMC8025647
- DOI: 10.1111/cns.13627
High-sensitive clinical diagnostic method for PTPRZ1-MET and the characteristic protein structure contributing to ligand-independent MET activation
Abstract
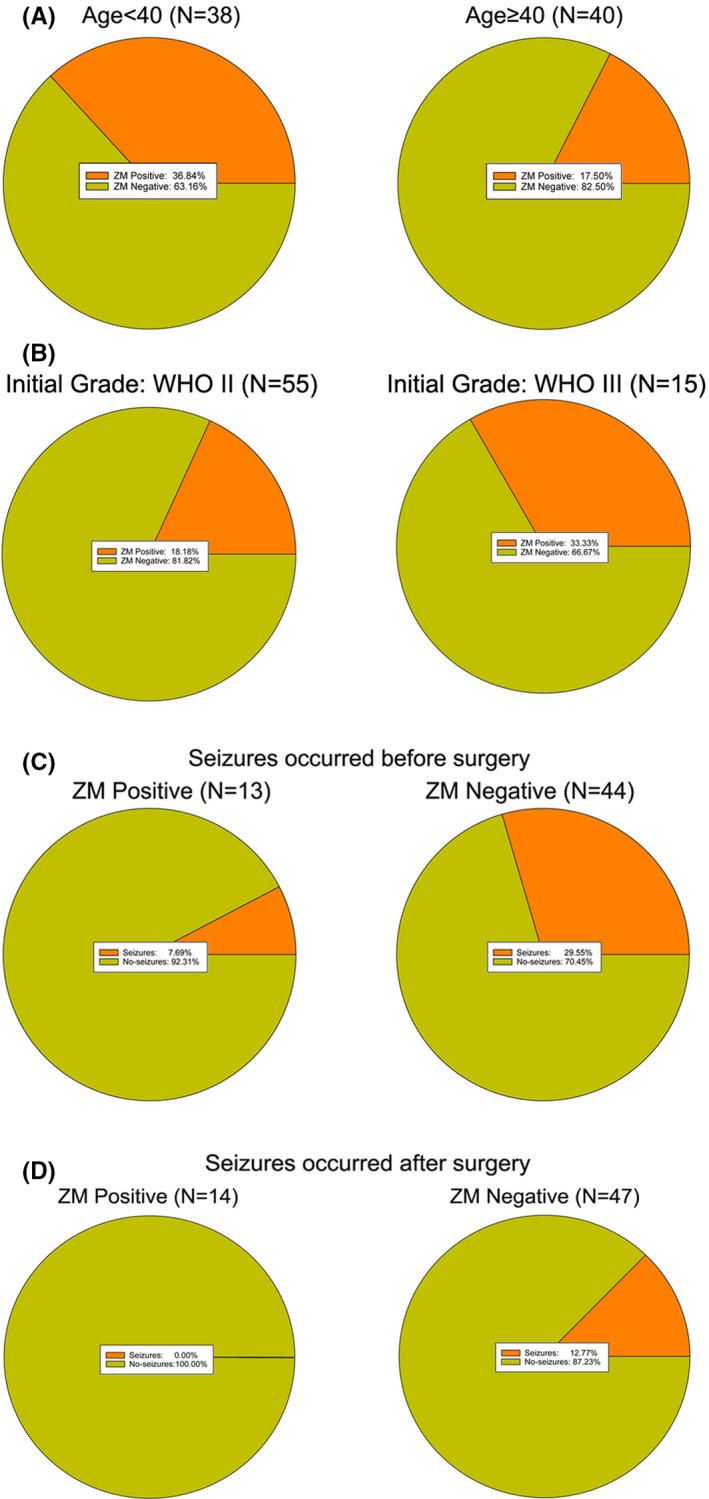
Background: PTPRZ1-MET (ZM) is a critical genetic alteration driving the progression of lower-grade glioma. Glioma patients harboring ZM could benefit from MET inhibitors. According to the remarkable role of ZM as a driver of glioma progression and indicator of MET inhibitor sensitivity, it is necessary to detect this alteration even when it presents in glioma with relatively fewer copies.
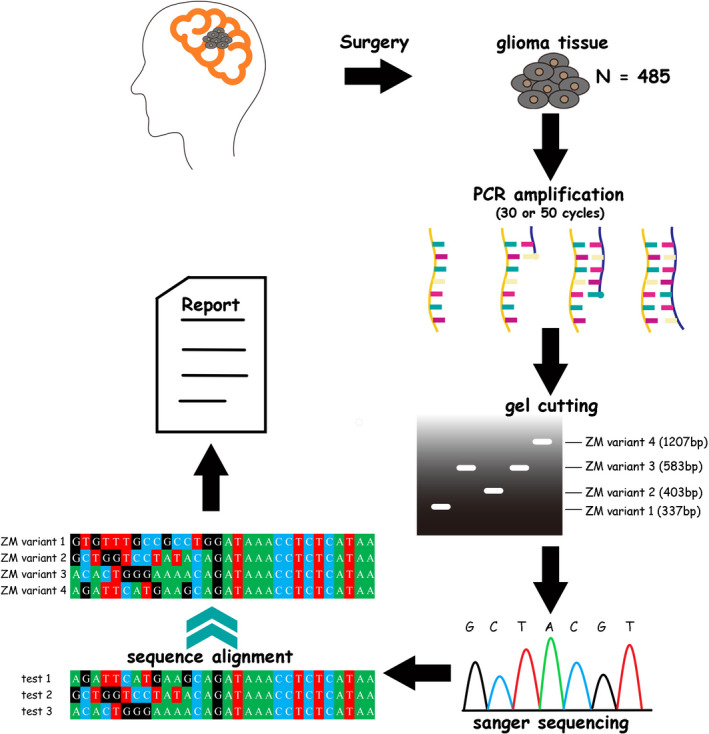
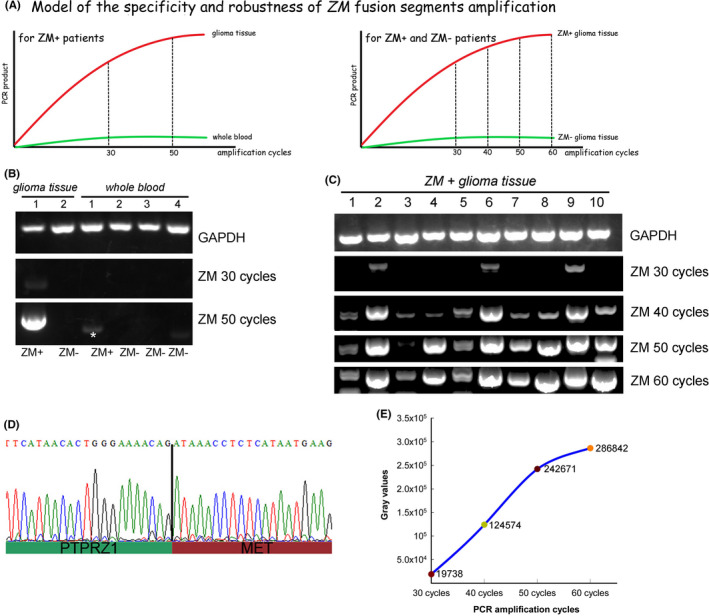
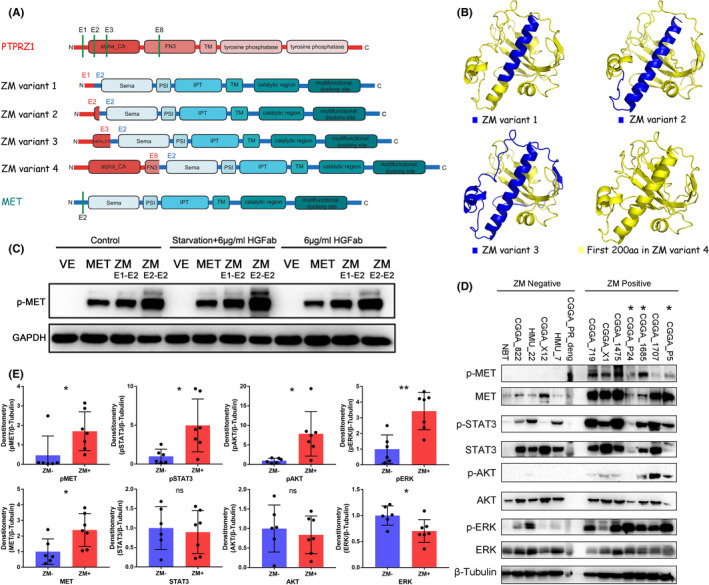
Methods: Herein, we proposed that ZM could be detected with a high-sensitive method of reverse transcriptase PCR with 50 amplification cycles. Via this newly proposed detection method, we depicted the incidence preference of ZM fusion in a cohort of 485 glioma patients. To further explore the oncogenic nature of ZM, we predicated the protein structure alteration of MET kinase brought by its fusion partner.
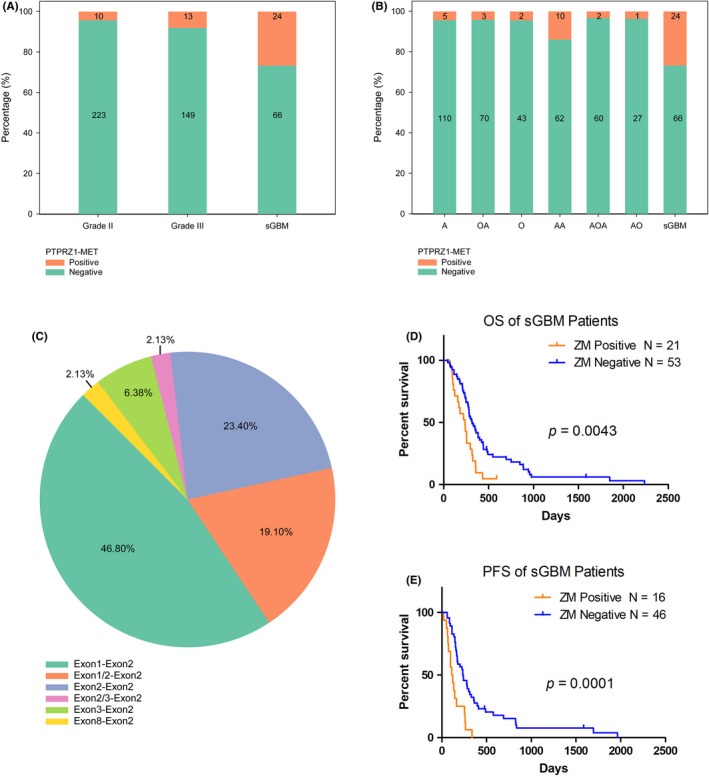
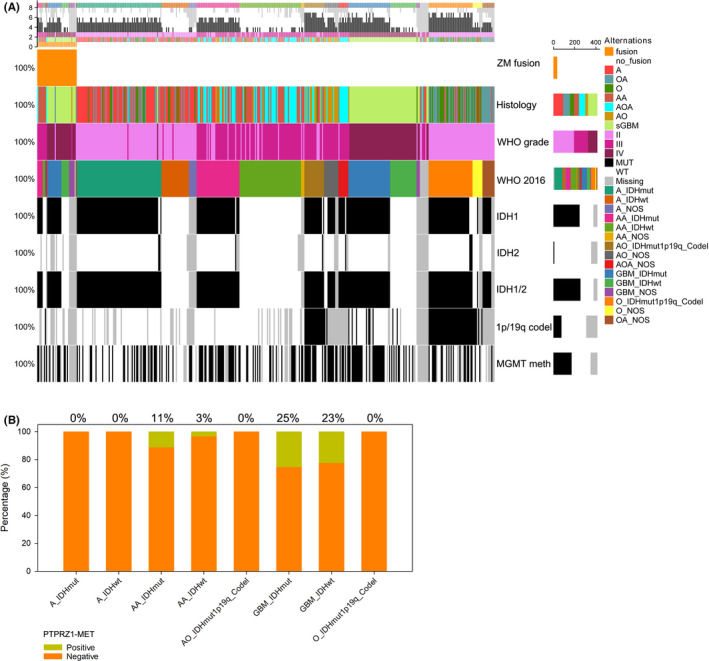
Results: The incidence of ZM fusions was much higher than previous report. ZM fusions exhibited a striking preference in lower-grade glioma and secondary glioblastoma. By contrast, none of patients with primary glioblastoma was detected harboring ZM fusion. In each of the four variants of ZM, the fusion partner segment of MET contained a remarkable coiled-coil motif. In glioma cells expressing ZM, MET kinase could be activated in a ligand-independent manner, which might be contributed by the special coiled-coil structure brought by the fusion partner. Corresponding to the 3D structural analysis and cell line experiment, the ZM positive clinical specimens showed hyperactivations of MET signaling.
Conclusions: ZM fusions are critical drivers of glioma progression and effective target of MET inhibitor. Early detection could be performed with a high-sensitive method of reverse transcriptase PCR. The hyperactivations of MET signaling driving glioma progression might be contributed by a ligand-independent activation enabled by the protein structure modification of extracellular domain of MET in ZM fusions.
Keywords: MET inhibitor; coiled-coil structure; glioma progression; receptor tyrosine kinase.
© 2021 The Authors. CNS Neuroscience & Therapeutics Published by John Wiley & Sons Ltd.
Conflict of interest statement
The authors declare that they have no conflict of interests.
Figures
Similar articles
-
RNA-seq of 272 gliomas revealed a novel, recurrent PTPRZ1-MET fusion transcript in secondary glioblastomas.Genome Res. 2014 Nov;24(11):1765-73. doi: 10.1101/gr.165126.113. Epub 2014 Aug 18. Genome Res. 2014. PMID: 25135958 Free PMC article.
-
The PTPRZ1-MET/STAT3/ISG20 axis in glioma stem-like cells modulates tumor-associated macrophage polarization.Cell Signal. 2024 Aug;120:111191. doi: 10.1016/j.cellsig.2024.111191. Epub 2024 Apr 27. Cell Signal. 2024. PMID: 38685521
-
Enhanced expression and phosphorylation of the MET oncoprotein by glioma-specific PTPRZ1-MET fusions.FEBS Lett. 2015 Jun 4;589(13):1437-43. doi: 10.1016/j.febslet.2015.04.032. Epub 2015 Apr 29. FEBS Lett. 2015. PMID: 25935522
-
Targeting gene fusions in glioma.Curr Opin Neurol. 2021 Dec 1;34(6):840-847. doi: 10.1097/WCO.0000000000000991. Curr Opin Neurol. 2021. PMID: 34766555 Review.
-
Identification of a novel KLC1-ROS1 fusion in a case of pediatric low-grade localized glioma.Brain Tumor Pathol. 2019 Jan;36(1):14-19. doi: 10.1007/s10014-018-0330-3. Epub 2018 Oct 22. Brain Tumor Pathol. 2019. PMID: 30350109 Review.
Cited by
-
Multiomics integration reveals the effect of Orexin A on glioblastoma.Front Pharmacol. 2023 Jan 20;14:1096159. doi: 10.3389/fphar.2023.1096159. eCollection 2023. Front Pharmacol. 2023. PMID: 36744263 Free PMC article.
-
Pan-Cancer Analysis of Oncogenic MET Fusions Reveals Distinct Pathogenomic Subsets with Differential Sensitivity to MET-Targeted Therapy.Cancer Discov. 2025 Jun 3;15(6):1141-1158. doi: 10.1158/2159-8290.CD-24-0417. Cancer Discov. 2025. PMID: 39965191
-
Aberrant MET Receptor Tyrosine Kinase Signaling in Glioblastoma: Targeted Therapy and Future Directions.Cells. 2024 Jan 25;13(3):218. doi: 10.3390/cells13030218. Cells. 2024. PMID: 38334610 Free PMC article. Review.
-
Prolonged complete response to adjuvant tepotinib in a patient with newly diagnosed disseminated glioblastoma harboring mesenchymal-epithelial transition fusion.Oncologist. 2025 Jan 17;30(1):oyae100. doi: 10.1093/oncolo/oyae100. Oncologist. 2025. PMID: 38815166 Free PMC article.
-
An Observatory for the MET Oncogene: A Guide for Targeted Therapies.Cancers (Basel). 2023 Sep 21;15(18):4672. doi: 10.3390/cancers15184672. Cancers (Basel). 2023. PMID: 37760640 Free PMC article. Review.
References
Publication types
MeSH terms
Substances
LinkOut - more resources
Full Text Sources
Other Literature Sources
Molecular Biology Databases
Miscellaneous
