. 2021 Mar 1;131(5):e141694.
doi: 10.1172/JCI141694.

Blood-brain barrier resealing in neuromyelitis optica occurs independently of astrocyte regeneration

Affiliations

Blood-brain barrier resealing in neuromyelitis optica occurs independently of astrocyte regeneration

Anne Winkler et al. J Clin Invest. .

Abstract

Approximately 80% of neuromyelitis optica spectrum disorder (NMOSD) patients harbor serum anti-aquaporin-4 autoantibodies targeting astrocytes in the CNS. Crucial for NMOSD lesion initiation is disruption of the blood-brain barrier (BBB), which allows the entrance of Abs and serum complement into the CNS and which is a target for new NMOSD therapies. Astrocytes have important functions in BBB maintenance; however, the influence of their loss and the role of immune cell infiltration on BBB permeability in NMOSD have not yet been investigated. Using an experimental model of targeted NMOSD lesions in rats, we demonstrate that astrocyte destruction coincides with a transient disruption of the BBB and a selective loss of occludin from tight junctions. It is noteworthy that BBB integrity is reestablished before astrocytes repopulate. Rather than persistent astrocyte loss, polymorphonuclear leukocytes (PMNs) are the main mediators of BBB disruption, and their depletion preserves BBB integrity and prevents astrocyte loss. Inhibition of PMN chemoattraction, activation, and proteolytic function reduces lesion size. In summary, our data support a crucial role for PMNs in BBB disruption and NMOSD lesion development, rendering their recruitment and activation promising therapeutic targets.

Keywords: Demyelinating disorders; Neuroscience; Neutrophils; Tight junctions.


Conflict of interest statement

Conflict of interest: The authors have declared that no conflict of interest exists.

Figures

Figure 1
Figure 1. Early loss of astrocytes coincides with BBB breakdown in experimental NMOSD lesions.
To assess the time course of astrocyte lesion development, AQP4 Abs and human complement were injected intracortically and animals were perfused after 3 hours, 6 hours, 24 hours, 3 days, and 7 days. Controls were injected with an irrelevant Ab in the presence of human complement. Three hours after Ab and complement injection, GFAP-positive astrocytes were still observed at the injection site (A). Monastral blue marks the injection site. However, dying GFAP-positive cells with retracting processes were also found (A, insert). Twenty-four hours after injection, large, well-demarcated areas with loss of GFAP (B) and AQP4 immunoreactivity (C; serial sections of the same lesion, astrocyte loss marked by dotted line) were detected. Quantification of GFAP immunoreactivity revealed initial loss 6 hours after lesion induction, peaking between 24 hours and 3 days, with a subsequent repopulation of GFAP-positive cells. No astrocyte loss is observed after injection of control Ab (ctrl-Ab) together with human complement. Number of lesions: 3 hours, n = 3; 6 hours and 24 hours, n = 10; 3 days, AQP4/2B4, n = 6/4; 7 days, n = 5 (D). Simultaneously, with the loss of astrocytes, a prominent extravasation of the injected tracers FITC-albumin (60 kDa) (E) and Texas Red cadaverine (0,69 kDa) (F) into the brain parenchyma was observed 6 hours after focal injection. No vascular leakage of either molecule was detected 24 hours after stereotactic injection (G, FITC-albumin; H, Texas Red cadaverine), which is confirmed by quantification (I). Number of lesions: FITC-albumin: 3 hours, n = 3; 6 hours, n = 8; 24 hours, n = 9; 3 days, n = 4. (J) Texas Red cadaverine, n = 3. (D, I, and J) Kruskal-Wallis test followed by Dunn’s multiple comparison test. *P < 0.05; **P < 0.01; ***P < 0.001. Graphs are shown as mean ± SEM. Scale bars: 100 μm (AC); 500 μm (EH).
Figure 2
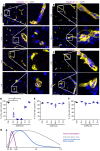
Figure 2. Breakdown of the BBB is accompanied by loss of occludin from blood vessels in experimental NMOSD lesions.
Immunolabeling for occludin, claudin-3, and claudin-5 (magenta) was performed to assess the localization of these tight junction proteins in brain vessels (visualized with the basal lamina LAMγ1 marker, yellow) in focal NMOSD-like lesions. Immunoreactivity for occludin (A), claudin-3 (B), and claudin-5 (C) was localized at the tight junctions between adjacent endothelial cells and formed sharply defined, continuous strands in uninjected, naive controls. Loss of occludin immunoreactivity was observed 10 hours and 24 hours after lesion induction in astrocyte-depleted areas. Vascular occludin localization recovered to 68.5% ± 4.6% within 3 days after focal injection of AQP4 Ab and human complement (A). Quantification of occludin-positive vessels confirms the transient loss of occludin immunoreactivity from blood vessels in areas of GFAP loss (41–307 vessels/animal evaluated depending on astrocyte lesion size; n = 3 animals per time point, except 6 hours n = 4; D). In contrast, no loss of claudin-3 and claudin-5 immunoreactivity was detected after lesion induction, and sharply defined immunopositive strands were observed at the tight junctions of LAMγ1-positive vessels at 10 hours (B and C, respectively). Quantification of claudin-3–positive vessels (45–218 vessels/animal evaluated; ctrl n = 3, 6h: n = 4, 10h: n = 2, 24h: n = 3, 3d: n = 2, 6d: n = 3; E) and claudin-5–positive vessels (28–209 vessels/animal, n = 3 animals per time point, except 6h n = 4; F) confirms this observation. Temporal evolution of experimental NMOSD lesions (G). The y axis represents the extent of the investigated factors in arbitrary units. (DF) Kruskal-Wallis test followed by Dunn’s multiple comparison test. *P < 0.05. Data are shown as mean ± SEM. bv, blood vessels. Scale bars: 50 μm (AC).
Figure 3
Figure 3. Infiltration of PMNs correlates with extravasation of FITC-albumin 6 hours after lesion induction.
Representative photographs depicting the infiltration of PMNs (CAE, pink), macrophages/activated microglia (ED1, brown) and T cells (CD3, brown, arrowhead) 6 hours, 24 hours, 3 days, and 7 days after lesion induction (marked by Monastral blue) (A). Quantification of the infiltration shows the absence of immune cells in the brain parenchyma 3 hours after lesion induction. Six hours after lesion induction, infiltration of PMNs was observed; it reached a maximal density at between 12 and 24 hours and then subsequently decreased. ED1-positive macrophages/activated microglia begin to infiltrate the parenchyma at low numbers 6 hours after lesion induction and reached their highest density at 24 hours. Only a few CD3-positive T cells were found during the time course. Number of lesions analyzed: n = 4, 3 hours, 12 hours; n = 7, 6 hours, 24 hours; n = 6, 3 days, 7 days (B). PMNs had the highest density of all infiltrated immune cell subsets 6 hours after lesion induction (C). The number of infiltrated PMNs at 6 hours correlates with the area of FITC-albumin extravasation into the brain parenchyma. Pearson’s correlation for normally distributed samples. Pearson’s correlation for normally distributed samples, P = 0,0291; Pearson’s r = 0.6271, n = 12 (D). (C) Kruskal-Wallis test followed by Dunn’s multiple comparison test. *P < 0.05; ***P < 0.001. Data are shown as mean ± SEM. Scale bar: 50 μm.
Figure 4
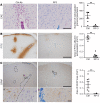
Figure 4. Depletion of PMNs prevents BBB disruption and astrocyte lesion formation 6 hours after lesion induction.
The mAb RP-3 was injected i.p. 18 hours prior to and at the time of lesion induction, and animals were perfused 6 hours later. Treatment of rats with RP-3 specifically decreased blood PMN numbers to 10% compared with control Ab–injected animals, which is reflected by a significant reduction in PMN numbers in the brain parenchyma 6 hours after lesion induction (A). PMNs are shown as pink using CAE stain; number of lesions: n = 6. Depletion of PMNs resulted in a significant reduction in FITC-albumin extravasation (B). Number of lesions: control, n = 4; RP-3, n = 6. Astrocyte lesion formation (C, dotted lines indicate area of GFAP loss, higher magnification of insets shown in a and b; number of lesions n = 6). Mann-Whitney U test. **P < 0.01. Data are shown as mean ± SEM. Scale bars: 100 μm (A); 500 μm (B and C); 20 μm (a and b).
Figure 5
Figure 5. Inhibition of MMP-9 and elastase results in a significant reduction of astrocyte lesion size and PMN infiltration 6 hours after lesion induction.
Six hours after lesion induction, numerous vascular and extravasating PMNs display granular intracellular staining for MMP-9 (arrowheads) (A). In contrast, rare MMP-9–positive PMNs are detected 24 hours after lesion induction (B). Quantification of MMP-9–positive PMNs in experimental NMOSD lesions shows a gradual decrease in MMP-9 expression over time, leading to a complete loss of MMP-9 immunoreactivity 3 days after lesion induction (number of lesions: n = 4, except 3 days, n = 3) (C). To study the function of MMP-9 in NMOSD lesion formation, animals were treated with the selective small molecule MMP-9 inhibitor ND-336, resulting in a significant reduction in astrocyte loss (GFAP) (D) and a trend toward reduced PMN numbers (E) (P = 0.0595) and FITC-albumin extravasation (F) (P = 0.0652). Treatment of animals with 50 mg/kg of the elastase inhibitor sivelestat resulted in a significant reduction in astrocyte loss (GFAP) (G) and PMN infiltration (H). Compared with vehicle-treated animals, there is no alteration in BBB permeability as measured by FITC-albumin extravasation (I). Unpaired t test with Welch’s correction. *P < 0.05. (DF) Number of lesions: vehicle, n = 10; ND-336, n = 8. (G and H) n = 8; (I) n = 6, pooled data of 2 independent experiments. Data are shown as mean ± SEM. Scale bar: 20 μm.
Figure 6
Figure 6. Resealing of the BBB to fibrinogen and tight junctions in human NMOSD lesions.
In lesion areas of ongoing and recent astrocyte destruction, perivascular fibrinogen leakage is observed (biopsy, patient 3) (A). No fibrinogen leakage from blood vessels is observed in later-stage human NMOSD lesions with established astrocyte loss (biopsy, patient 1) (B). A resealed BBB was also observed in autopsies with later stage NMOSD lesions (C). Here, claudin-5 expression was present in blood vessels visualized using the basal lamina marker collagen IV (D) (serial section of lesion displayed in C, patient 9). Quantification of the percentage of claudin-5–positive blood vessels is shown (E). Additionally, endothelial cells expressed occludin and claudin-3 at their tight junctions in healthy brain tissue as well as in NMOSD lesions (F). Blood vessels are visualized using the basal lamina marker LAMγ1 (patient 7). TJ form electron-dense structures at the intercellular cleft (endothelium, blue; monocyte, red; patient 7). (G). (AC) Dotted lines delineate lesion border. Asterisks mark bleeding from surgery. Arrowheads indicates big blood vessel. (E) Number of patients: controls, n = 5; NMOSD, n = 4. At least 117 blood vessels were evaluated per case. Kruskal-Wallis test followed by Dunn’s multiple comparison test revealed no significant differences in the percentage of claudin-5–positive blood vessels between groups. Data are shown as mean ± SEM. Scale bars: 500 μm (A, B, and C); 20 μm (D); 50 μm (F); 5 μm (G); 500 nm (G, a and b).

Similar articles

Cited by

References

    1. Flanagan EP, et al. Epidemiology of aquaporin-4 autoimmunity and neuromyelitis optica spectrum. Ann Neurol. 2016;79(5):775–783. doi: 10.1002/ana.24617. - DOI - PMC - PubMed
    1. Wrzos C, et al. Early loss of oligodendrocytes in human and experimental neuromyelitis optica lesions. Acta Neuropathol. 2014;127(4):523–538. doi: 10.1007/s00401-013-1220-8. - DOI - PMC - PubMed
    1. Papadopoulos M, Verkman A. Aquaporin 4 and neuromyelitis optica. Lancet Neurol. 2012;11(6):535–544. doi: 10.1016/S1474-4422(12)70133-3. - DOI - PMC - PubMed
    1. Bennett J, et al. Intrathecal pathogenic anti-aquaporin-4 antibodies in early neuromyelitis optica. Ann Neurol. 2009;66(5):617–629. doi: 10.1002/ana.21802. - DOI - PMC - PubMed
    1. Bradl M, et al. Neuromyelitis optica: pathogenicity of patient immunoglobulin in vivo. Ann Neurol. 2009;66(5):630–643. doi: 10.1002/ana.21837. - DOI - PubMed

Publication types