. 2021 Feb 13:(168):10.3791/61970.
doi: 10.3791/61970.

Transpupillary Two-photon In vivo Imaging of the Mouse Retina

Affiliations

Transpupillary Two-photon In vivo Imaging of the Mouse Retina

Zelun Wang et al. J Vis Exp. .

Abstract

The retina transforms light signals from the environment into electrical signals that are propagated to the brain. Diseases of the retina are prevalent and cause visual impairment and blindness. Understanding how such diseases progress is critical to formulating new treatments. In vivo microscopy in animal models of disease is a powerful tool for understanding neurodegeneration and has led to important progress towards treatments of conditions ranging from Alzheimer's disease to stroke. Given that the retina is the only central nervous system structure inherently accessible by optical approaches, it naturally lends itself towards in vivo imaging. However, the native optics of the lens and cornea present some challenges for effective imaging access. This protocol outlines methods for in vivo two-photon imaging of cellular cohorts and structures in the mouse retina at cellular resolution, applicable for both acute- and chronic-duration imaging experiments. It presents examples of retinal ganglion cell (RGC), amacrine cell, microglial, and vascular imaging using a suite of labeling techniques including adeno-associated virus (AAV) vectors, transgenic mice, and inorganic dyes. Importantly, these techniques extend to all cell types of the retina, and suggested methods for accessing other cellular populations of interest are described. Also detailed are example strategies for manual image postprocessing for display and quantification. These techniques are directly applicable to studies of retinal function in health and disease.


Figures

Figure 1.
Figure 1.. Light path schematic.
The basic components of the 2-photon microscope used in this protocol consist of a Pockels Cell to modulate laser power, a lens pair to reduce the laser beam diameter to match the back aperture of the microscope objective, and a pair of galvo scan mirrors for beam steering. A pair of steering mirrors is present before each major optical component. The focus is controlled by a motor that drives the objective mount. The emission light path can be customized for different fluorophores by changing out dichroic and barrier filters. A general setup for cyan/yellow/red imaging is displayed in which a short pass dichroic mirror directs red light to the first PMT, and a long pass dichroic mirror paired with appropriate band pass filters is used to separate cyan and yellow emissions.
Figure 2.
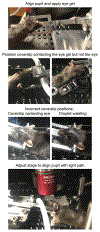
Figure 2.. Positioning mice for in vivo imaging.
To position mice with the pupil on axis with the light path, anesthetized mice are first restrained in a head holder, the head is rotated and angled, a large drop of lubricant eye gel is placed on the eye, and the mouse is placed on the stage. A coverslip is mounted in the coverslip holder perpendicular to the light path and lowered down towards the eye. The coverslip should not contact the cornea or mouse head (left), which will be evident if the coverslip is deflected. However, the coverslip should also be close enough to avoid waisting of the droplet (right), because this will have a demagnifying effect on the sample. After applying the gel immersion and securing the coverslip, the stage should be moved in place directly under the microscope objective.
Figure 3.
Figure 3.. Imaging retinal ganglion cells.
For image display, maximum intensity projections with the z-planes containing cells of interest are created, and resultant images are median filtered to remove PMT shot noise. Two examples of retinal ganglion cells labelled by injecting AAV-EF1α-FLEX-Twitch2b into VGlut2-Cre transgenic mice are shown, specifically the cyan fluorescent protein (CFP) signal. Images were acquired at sessions four days apart, and vascular landmarks were used to return to the same region near the optic nerve head. The optic nerve head is oriented towards the bottom of the image. Although both samples show some variance in orientation (regions with decreased intensity are indicated with arrows), most cells are present at both time points. Scale bar = approximately 50 μm.
Figure 4.
Figure 4.. Imaging amacrine cells.
Amacrine cells were labeled by injecting AAV-EF1α-FLEX-Twitch2b into VGat-Cre transgenic mice. The CFP signal of Twitch 2b is specifically shown. Small maximum intensity projections focused on the depths of the inner nuclear layer (INL) indicate amacrine cell somas, while focusing on the inner plexiform layer (IPL) resolves amacrine cell neurites (arrow). The optic nerve head is oriented towards the right of the image. Scale bar = approximately 50 μm.
Figure 5.
Figure 5.. Imaging microglia.
The transgenic mouse line Cx3cr1-GFP was used to label microglia. A maximum intensity projection of the full scan volume shows many microglia, some with fine process detail that can be resolved. Note that cells towards the lower left of the field have less distortion in the maximum projection than those towards the upper right due to parallax in this region. Maximum intensity projections containing only the cell of interest significantly reduces this parallax (center, boxed in corresponding colors). Furthermore, this imaging strategy can document dynamics of fine microglia process remodeling (lower panels). Comparatively, many microglia can be seen with short processes or amoeboid morphology one day after an excitotoxic lesion by intravitreal injection of 50 mM NMDA (right). Scale bar = approximately 50 μm.
Figure 6.
Figure 6.. Labelling vascular landmarks.
Mice were injected with 200 μL of 20 mg/mL Evans blue intraperitoneally 30-60 minutes prior to the first imaging session. Full thickness maximum intensity projections demonstrate lasting fluorescence in the retinal vasculature that persisted for at least seven days. Scale bar = approximately 50 μm.
Figure 7.
Figure 7.. Image dimensions.
Retinal ganglion cells labelled by injecting AAV-EF1α-FLEX-Twitch2b into VGlut2-Cre transgenic mice were imaged in vivo and the same region was then imaged by confocal laser scanning microscopy after fixation and wholemount preparation of the retina. Yellow fluorescent protein channel is shown for both. Colored arrow pairs indicate the same cell in both preparations (upper panels). Single plane image of 2 μm diameter fluorescent microspheres injected intravitreally and imaged in vivo (lower left panel). Microspheres did not settle and thus were in constant motion making measurement of axial resolution impossible. Pixel sizes calculated from full-width half-maximum measurements of in vivo fluorescent microspheres or correlative confocal measurements taken from 2-4 retinas per group (lower right). Scale bar = 50 μm.
Figure 8.
Figure 8.. Calcium activity induced by 2-photon scanning.
Retinal ganglion cells labelled by injecting AAV-EF1α-FLEX-Twitch2b into VGlut2-Cre transgenic mice, YFP is pseudocolored magenta and CFP green, imaged in a single plane as a time series at 4.22 Hz. All RGCs had a similar starting YFP/CFP ratio. Most responded with an increase in FRET ratio (excluding the orange cell), and one maintained a high YFP/CFP ratio throughout the time series (yellow cell). YFP/CFP ratios were normalized to the first frame average, and colored circles match with colored traces. Scale bar = 20 μm.

References

    1. Smith CA & Chauhan BC In vivo imaging of adeno-associated viral vector labelled retinal ganglion cells. Sci Rep. 8 (1), 1490, doi:10.1038/s41598-018-19969-9, (2018). - DOI - PMC - PubMed
    1. Liu H & Ding C Establishment of an experimental glaucoma animal model: A comparison of microbead injection with or without hydroxypropyl methylcellulose. Exp Ther Med. 14 (3), 1953–1960, doi:10.3892/etm.2017.4728, (2017). - DOI - PMC - PubMed
    1. Chauhan BC et al. Longitudinal in vivo imaging of retinal ganglion cells and retinal thickness changes following optic nerve injury in mice. PLoS One. 7 (6), e40352, doi:10.1371/journal.pone.0040352, (2012). - DOI - PMC - PubMed
    1. Leung CK et al. Longitudinal profile of retinal ganglion cell damage after optic nerve crush with blue-light confocal scanning laser ophthalmoscopy. Invest Ophthalmol Vis Sci. 49 (11), 4898–4902, doi:10.1167/iovs.07-1447, (2008). - DOI - PMC - PubMed
    1. Murata H et al. Imaging mouse retinal ganglion cells and their loss in vivo by a fundus camera in the normal and ischemia-reperfusion model. Invest Ophthalmol Vis Sci. 49 (12), 5546–5552, doi:10.1167/iovs.07-1211, (2008). - DOI - PubMed

Publication types

LinkOut - more resources