

Imperfect spoiling in variable flip angle T1 mapping at 7T: Quantifying and minimizing impact
- PMID: 33645814
- PMCID: PMC8436769
- DOI: 10.1002/mrm.28720
Imperfect spoiling in variable flip angle T1 mapping at 7T: Quantifying and minimizing impact
Abstract
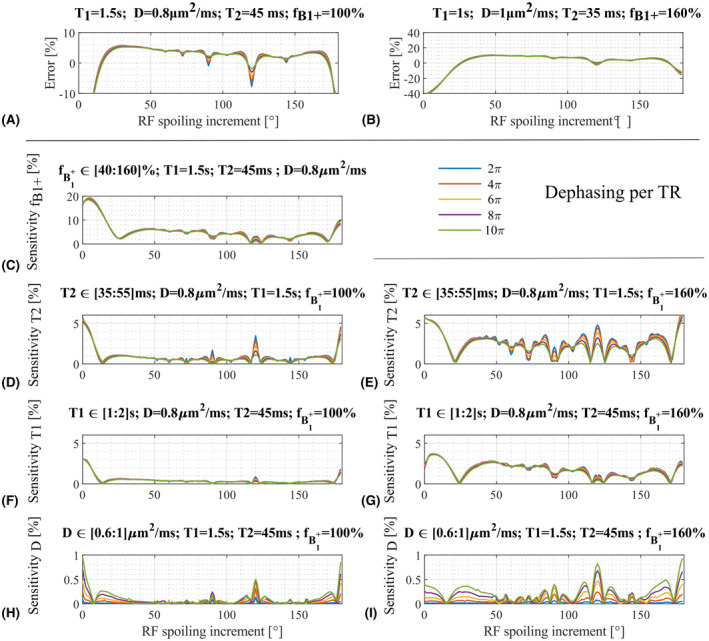
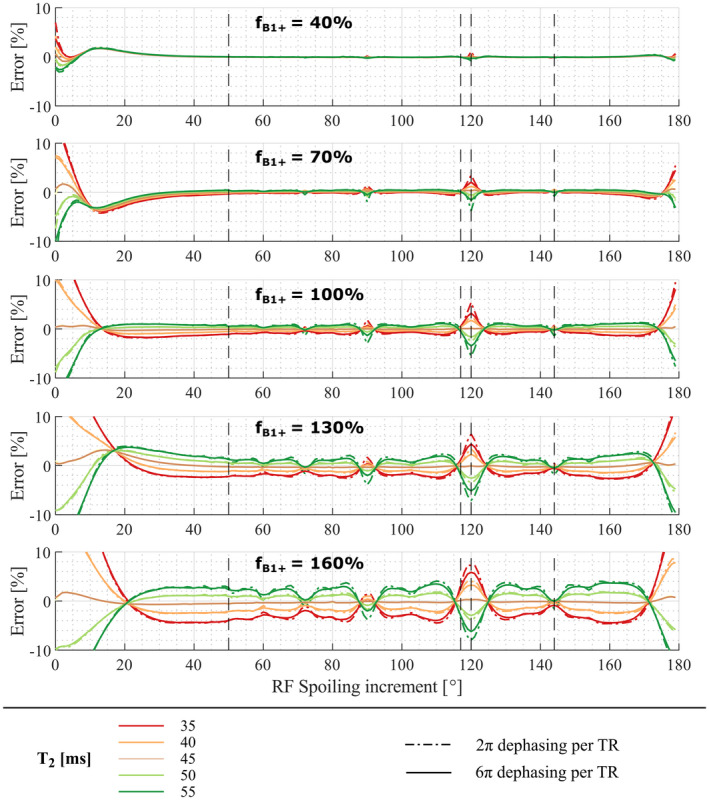
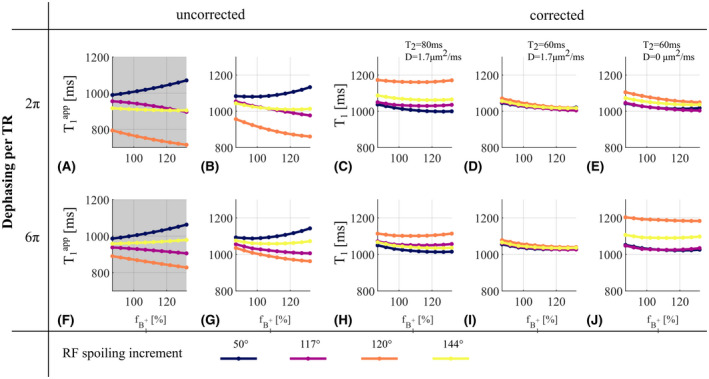
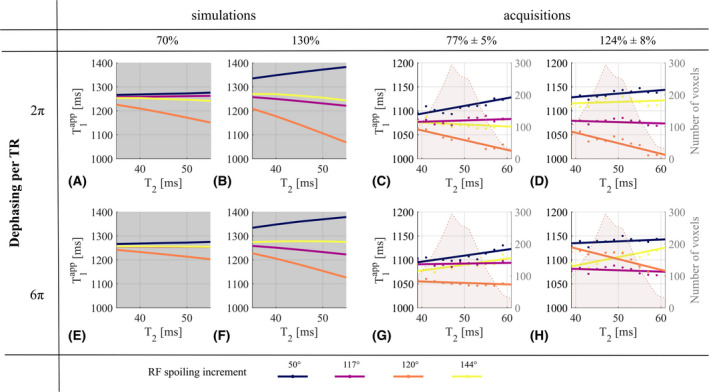
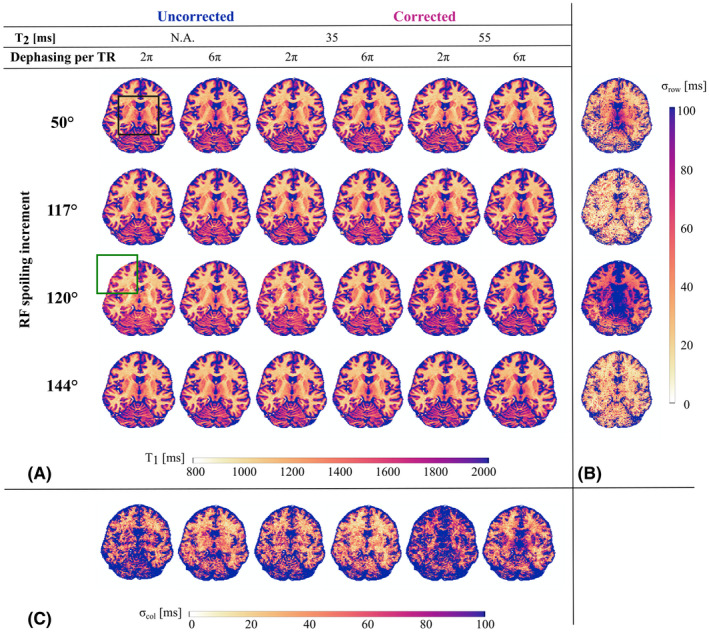
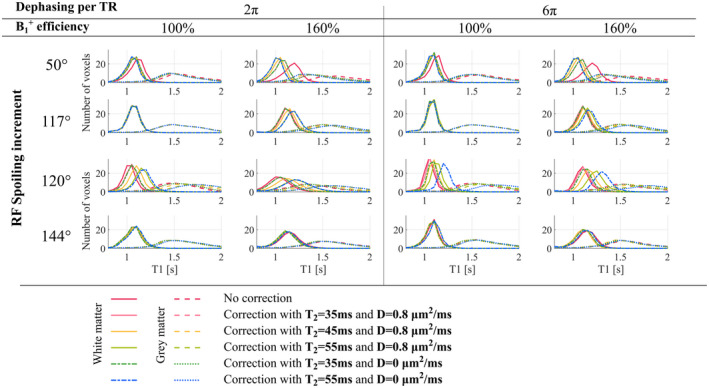
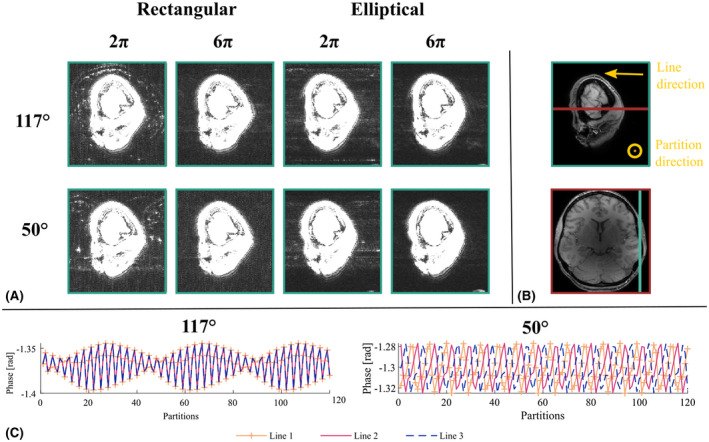
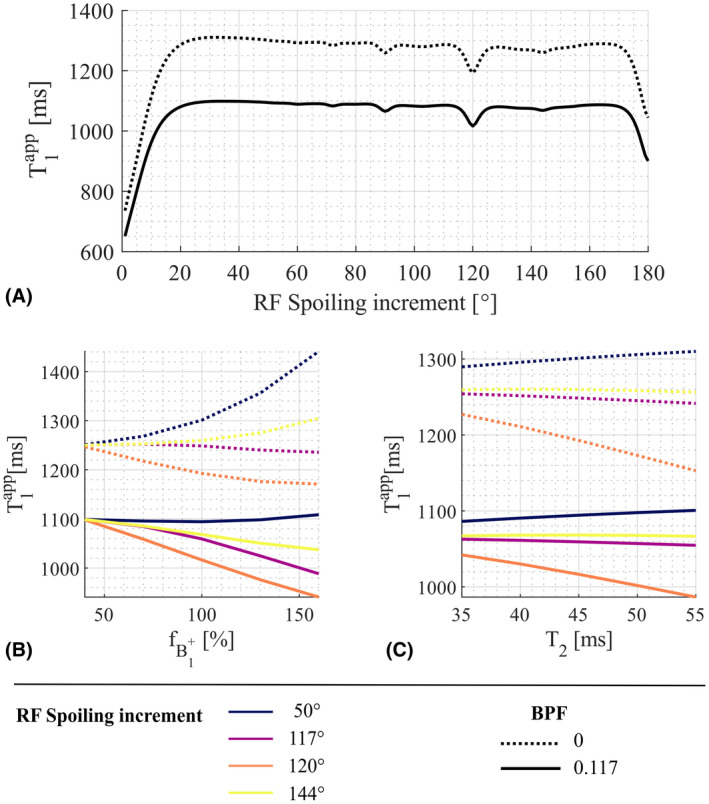
Purpose: The variable flip angle (VFA) approach to T1 mapping assumes perfectly spoiled transverse magnetisation at the end of each repetition time (TR). Despite radiofrequency (RF) and gradient spoiling, this condition is rarely met, leading to erroneous T1 estimates ( ). Theoretical corrections can be applied but make assumptions about tissue properties, for example, a global T2 time. Here, we investigate the effect of imperfect spoiling at 7T and the interaction between the RF and gradient spoiling conditions, additionally accounting for diffusion. We provide guidance on the optimal approach to maximise the accuracy of the T1 estimate in the context of 3D multi-echo acquisitions.
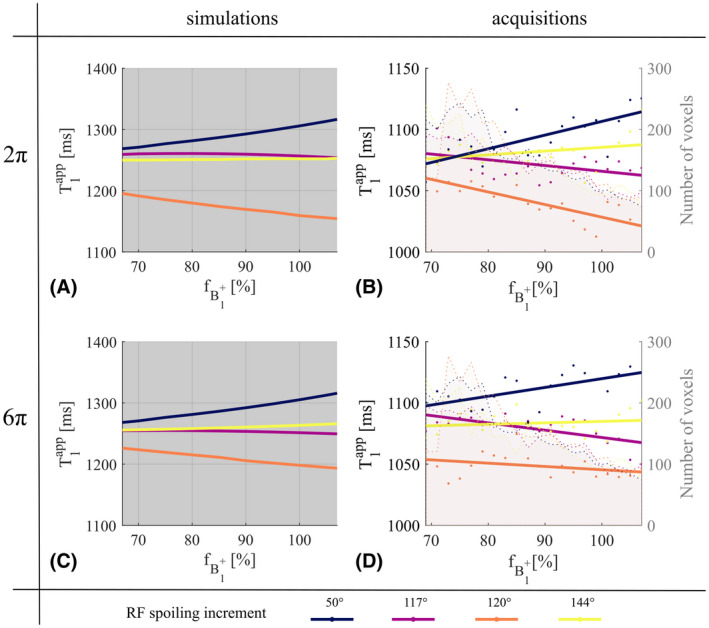
Methods: The impact of the spoiling regime was investigated through numerical simulations, phantom and invivo experiments.
Results: The predicted dependence of on tissue properties, system settings, and spoiling conditions was observed in both phantom and in vivo experiments. Diffusion effects modulated the dependence of on both efficiency and T2 times.
Conclusion: Error in can be minimized by using an RF spoiling increment and gradient spoiler moment combination that minimizes T2 -dependence and safeguards image quality. Although the diffusion effect was comparatively small at 7T, correction factors accounting for this effect are recommended.
Keywords: 7T; EPG; MPM; T1 mapping; VFA; imperfect spoiling.
© 2021 The Authors. Magnetic Resonance in Medicine published by Wiley Periodicals LLC on behalf of International Society for Magnetic Resonance in Medicine.
Figures
Similar articles
-
T1 mapping with the variable flip angle technique: A simple correction for insufficient spoiling of transverse magnetization.Magn Reson Med. 2018 Jun;79(6):3082-3092. doi: 10.1002/mrm.26979. Epub 2017 Oct 20. Magn Reson Med. 2018. PMID: 29052267
-
Optimal radiofrequency and gradient spoiling for improved accuracy of T1 and B1 measurements using fast steady-state techniques.Magn Reson Med. 2010 Jun;63(6):1610-26. doi: 10.1002/mrm.22394. Magn Reson Med. 2010. PMID: 20512865
-
Phase-sensitive B1 mapping: Effects of relaxation and RF spoiling.Magn Reson Med. 2018 Jul;80(1):101-111. doi: 10.1002/mrm.27009. Epub 2017 Nov 20. Magn Reson Med. 2018. PMID: 29159883 Free PMC article.
-
Reducing bias in dual flip angle T1 -mapping in human brain at 7T.Magn Reson Med. 2020 Sep;84(3):1347-1358. doi: 10.1002/mrm.28206. Epub 2020 Feb 14. Magn Reson Med. 2020. PMID: 32060952
-
Rapid gradient-echo imaging.J Magn Reson Imaging. 2012 Dec;36(6):1300-13. doi: 10.1002/jmri.23742. Epub 2012 Oct 23. J Magn Reson Imaging. 2012. PMID: 23097185 Free PMC article. Review.
Cited by
-
Exploring the Potential of Machine Learning Algorithms to Improve Diffusion Nuclear Magnetic Resonance Imaging Models Analysis.J Med Phys. 2024 Apr-Jun;49(2):189-202. doi: 10.4103/jmp.jmp_10_24. Epub 2024 Jun 25. J Med Phys. 2024. PMID: 39131437 Free PMC article.
-
Reducing Susceptibility Distortion Related Image Blurring in Diffusion MRI EPI Data.Front Neurosci. 2021 Aug 5;15:706473. doi: 10.3389/fnins.2021.706473. eCollection 2021. Front Neurosci. 2021. PMID: 34421526 Free PMC article.
-
On the choice of the phase difference increment in radiofrequency-spoiled gradient-echo magnetic resonance imaging of liquids with consideration of diffusion.PLoS One. 2025 May 30;20(5):e0324455. doi: 10.1371/journal.pone.0324455. eCollection 2025. PLoS One. 2025. PMID: 40446188 Free PMC article.
-
Reliability of quantitative multiparameter maps is high for magnetization transfer and proton density but attenuated for R1 and R2 * in healthy young adults.Hum Brain Mapp. 2022 Aug 1;43(11):3585-3603. doi: 10.1002/hbm.25870. Epub 2022 Apr 9. Hum Brain Mapp. 2022. PMID: 35397153 Free PMC article.
-
Mitigating the impact of flip angle and orientation dependence in single compartment R2* estimates via 2-pool modeling.Magn Reson Med. 2023 Jan;89(1):128-143. doi: 10.1002/mrm.29428. Epub 2022 Sep 26. Magn Reson Med. 2023. PMID: 36161672 Free PMC article.
References
-
- Weiskopf N, Mohammadi S, Lutti A, Callaghan M. Advances in MRI‐based computational neuroanatomy: from morphometry to in‐vivo histology. Curr Opin Neurol. 2015;28:313‐322. - PubMed
-
- Edwards LJ, Kirilina E, Mohammadi S, Weiskopf N. Microstructural imaging of human neocortex in vivo. Neuroimage. 2018;182:184‐206. - PubMed
-
- Lutti A, Dick F, Sereno MI, Weiskopf N. Using high‐resolution quantitative mapping of R1 as an index of cortical myelination. Neuroimage. 2014;93:176‐188. - PubMed
Publication types
MeSH terms
Grants and funding
LinkOut - more resources
Full Text Sources
Other Literature Sources
Medical
Miscellaneous
