

Escherichia coli EC93 deploys two plasmid-encoded class I contact-dependent growth inhibition systems for antagonistic bacterial interactions
- PMID: 33646095
- PMCID: PMC8190604
- DOI: 10.1099/mgen.0.000534
Escherichia coli EC93 deploys two plasmid-encoded class I contact-dependent growth inhibition systems for antagonistic bacterial interactions
Abstract
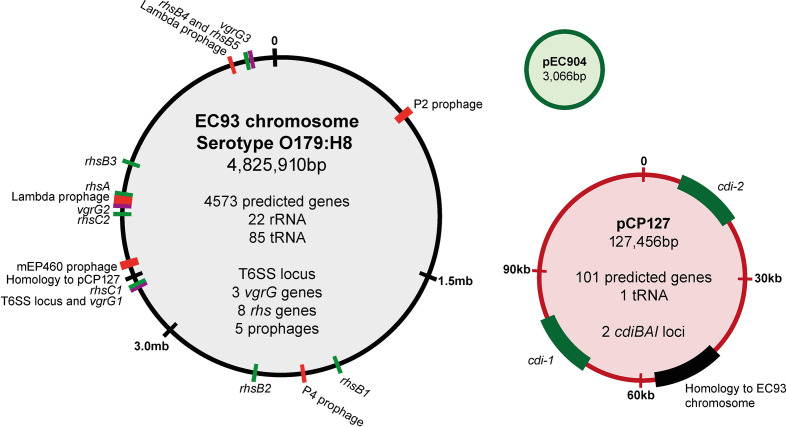
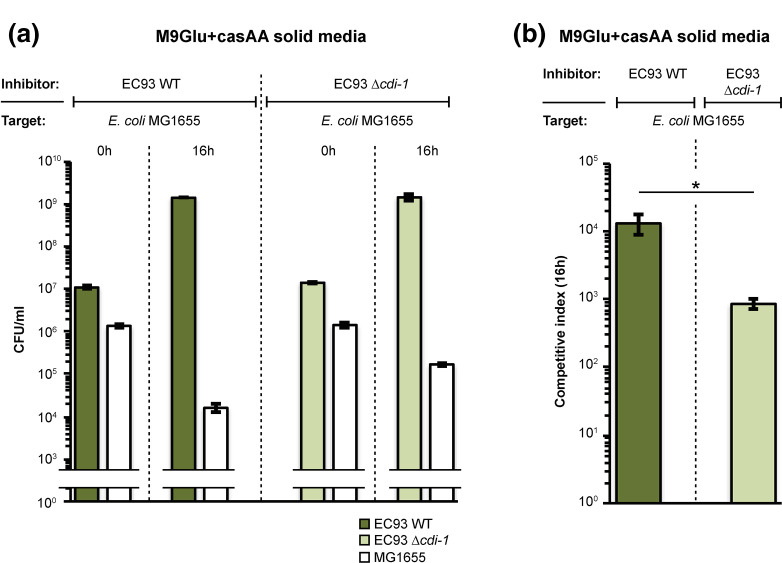
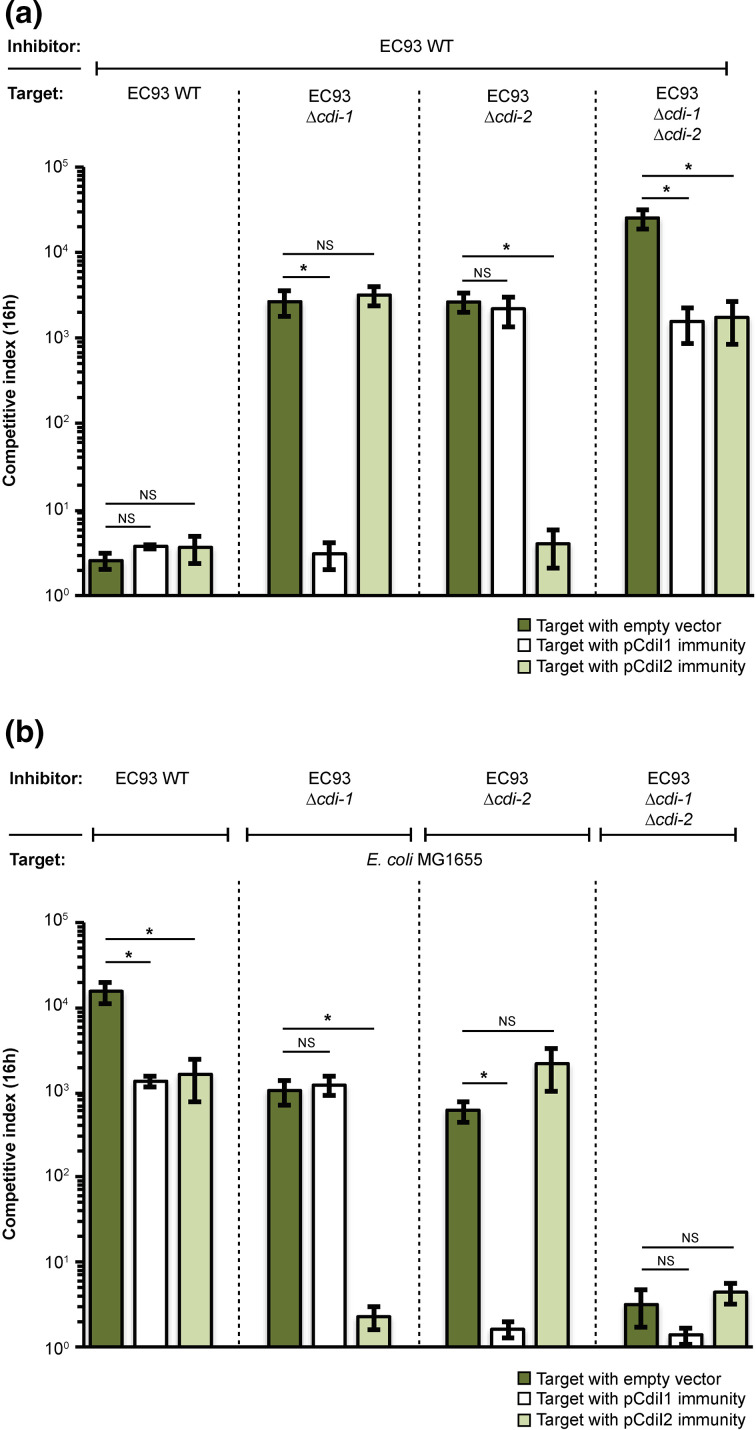
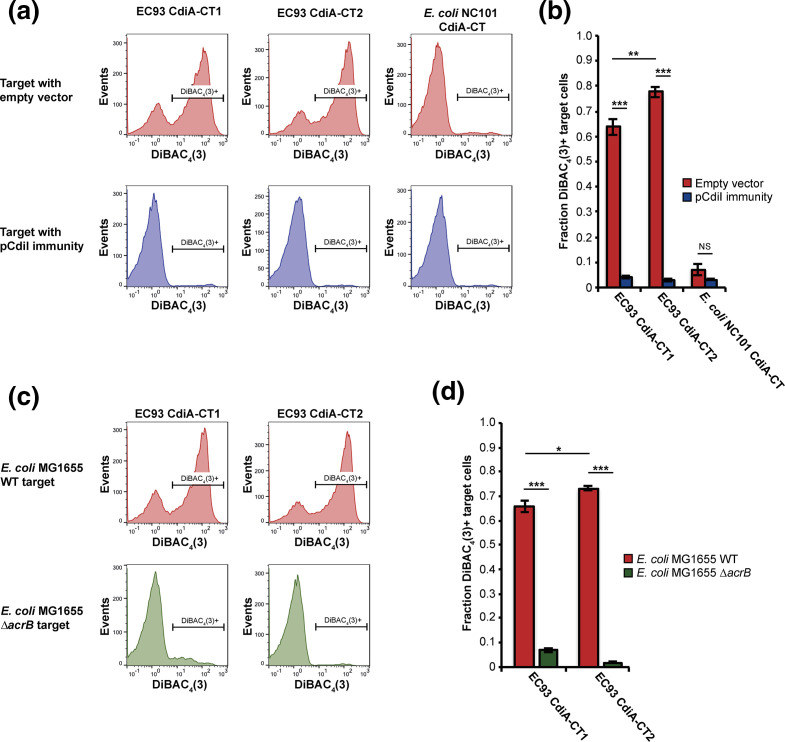
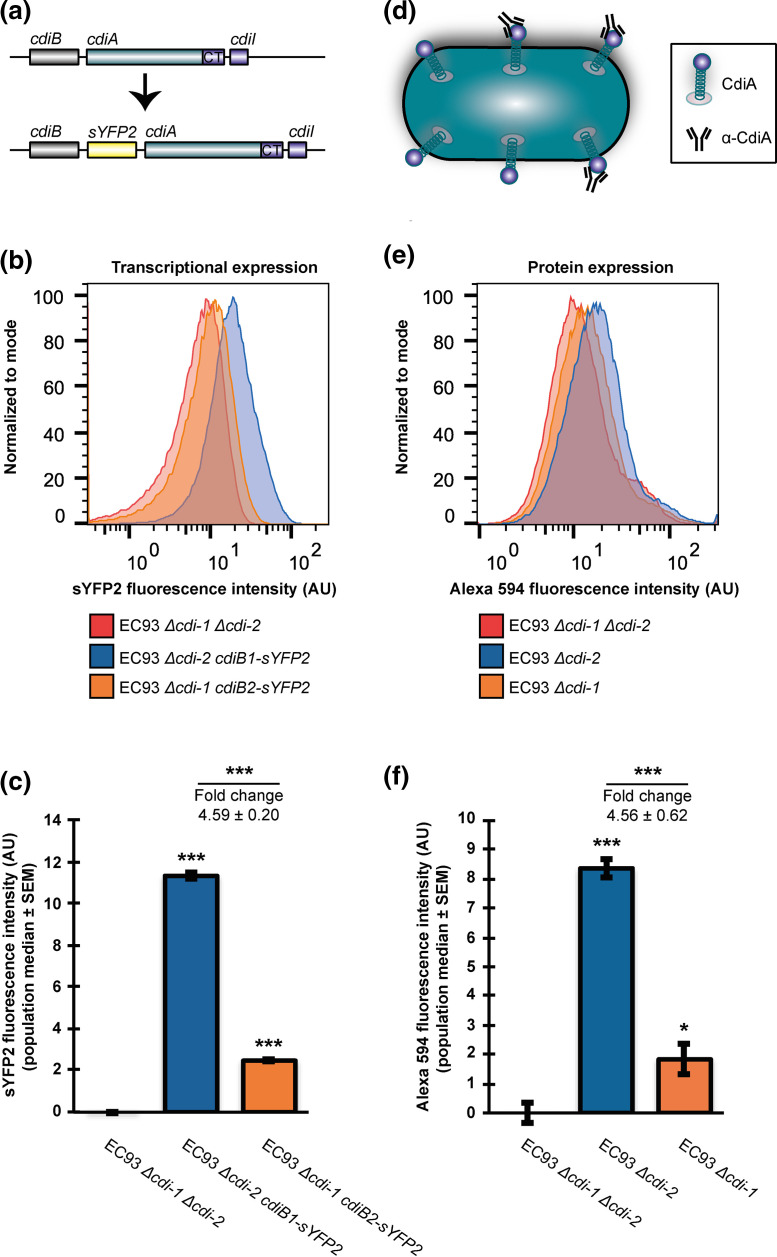
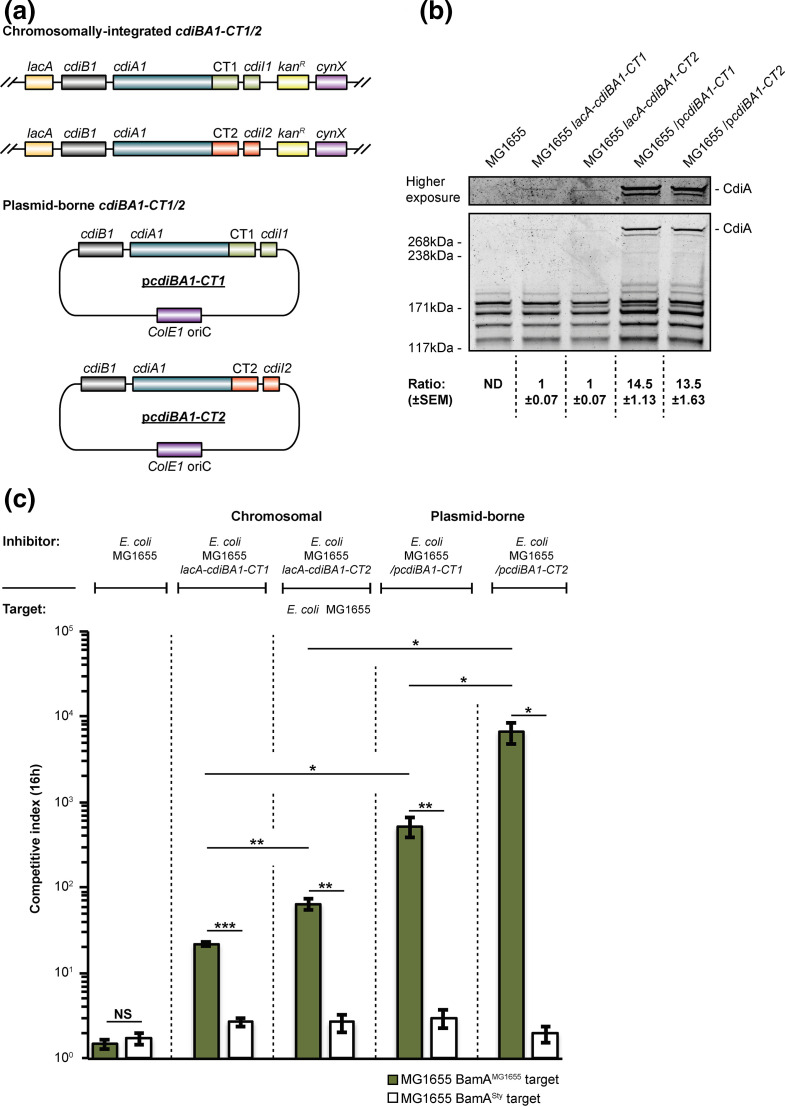
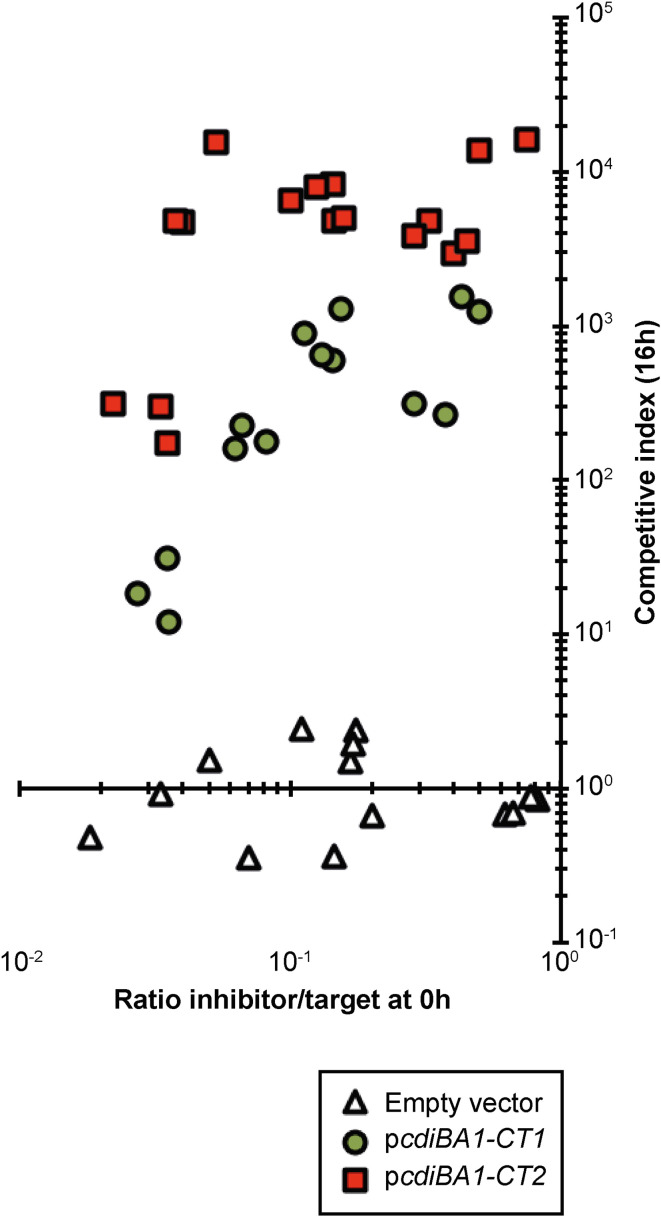
The phenomenon of contact-dependent growth inhibition (CDI) and the genes required for CDI (cdiBAI) were identified and isolated in 2005 from an Escherichia coli isolate (EC93) from rats. Although the cdiBAIEC93 locus has been the focus of extensive research during the past 15 years, little is known about the EC93 isolate from which it originates. Here we sequenced the EC93 genome and find two complete and functional cdiBAI loci (including the previously identified cdi locus), both carried on a large 127 kb plasmid. These cdiBAI systems are differentially expressed in laboratory media, enabling EC93 to outcompete E. coli cells lacking cognate cdiI immunity genes. The two CDI systems deliver distinct effector peptides that each dissipate the membrane potential of target cells, although the two toxins display different toxic potencies. Despite the differential expression and toxic potencies of these CDI systems, both yielded similar competitive advantages against E. coli cells lacking immunity. This can be explained by the fact that the less expressed cdiBAI system (cdiBAIEC93-2) delivers a more potent toxin than the highly expressed cdiBAIEC93-1 system. Moreover, our results indicate that unlike most sequenced CDI+ bacterial isolates, the two cdi loci of E. coli EC93 are located on a plasmid and are expressed in laboratory media.
Keywords: Escherichia coli; competition; contact-dependent growth inhibition; genome; regulation; toxic potency; toxin.
Conflict of interest statement
The authors declare that there are no conflicts of interest.
Figures
Similar articles
-
Identification of functional toxin/immunity genes linked to contact-dependent growth inhibition (CDI) and rearrangement hotspot (Rhs) systems.PLoS Genet. 2011 Aug;7(8):e1002217. doi: 10.1371/journal.pgen.1002217. Epub 2011 Aug 4. PLoS Genet. 2011. PMID: 21829394 Free PMC article.
-
Receptor polymorphism restricts contact-dependent growth inhibition to members of the same species.mBio. 2013 Jul 23;4(4):e00480-13. doi: 10.1128/mBio.00480-13. mBio. 2013. PMID: 23882017 Free PMC article.
-
CDI Systems Are Stably Maintained by a Cell-Contact Mediated Surveillance Mechanism.PLoS Genet. 2016 Jun 29;12(6):e1006145. doi: 10.1371/journal.pgen.1006145. eCollection 2016 Jun. PLoS Genet. 2016. PMID: 27355474 Free PMC article.
-
Mechanisms and biological roles of contact-dependent growth inhibition systems.Cold Spring Harb Perspect Med. 2014 Feb 1;4(2):a010025. doi: 10.1101/cshperspect.a010025. Cold Spring Harb Perspect Med. 2014. PMID: 24492845 Free PMC article. Review.
-
Are CDI Systems Multicolored, Facultative, Helping Greenbeards?Trends Microbiol. 2017 May;25(5):391-401. doi: 10.1016/j.tim.2017.02.008. Epub 2017 Mar 9. Trends Microbiol. 2017. PMID: 28285908 Free PMC article. Review.
Cited by
-
Paradoxical Activation of a Type VI Secretion System Phospholipase Effector by Its Cognate Immunity Protein.J Bacteriol. 2023 Jun 27;205(6):e0011323. doi: 10.1128/jb.00113-23. Epub 2023 May 22. J Bacteriol. 2023. PMID: 37212679 Free PMC article.
-
Hybrid de novo Genome Assembly of Erwinia sp. E602 and Bioinformatic Analysis Characterized a New Plasmid-Borne lac Operon Under Positive Selection.Front Microbiol. 2021 Nov 11;12:783195. doi: 10.3389/fmicb.2021.783195. eCollection 2021. Front Microbiol. 2021. PMID: 34858382 Free PMC article.
-
Colicins and T6SS-based competition systems enhance enterotoxigenic E. coli (ETEC) competitiveness.Gut Microbes. 2024 Jan-Dec;16(1):2295891. doi: 10.1080/19490976.2023.2295891. Epub 2023 Dec 27. Gut Microbes. 2024. PMID: 38149626 Free PMC article.
-
Contact-dependent growth inhibition (CDI) systems deploy a large family of polymorphic ionophoric toxins for inter-bacterial competition.PLoS Genet. 2024 Nov 26;20(11):e1011494. doi: 10.1371/journal.pgen.1011494. eCollection 2024 Nov. PLoS Genet. 2024. PMID: 39591464 Free PMC article.
-
Relaxed specificity of BcpB transporters mediates interactions between Burkholderia cepacia complex contact-dependent growth inhibition systems.mSphere. 2023 Aug 24;8(4):e0030323. doi: 10.1128/msphere.00303-23. Epub 2023 Jul 27. mSphere. 2023. PMID: 37498085 Free PMC article.
References
Publication types
MeSH terms
Substances
Grants and funding
LinkOut - more resources
Full Text Sources
Other Literature Sources
Molecular Biology Databases
Miscellaneous