Randomized Controlled Trial
. 2021 May 3;218(5):e20202617.
doi: 10.1084/jem.20202617.

Highly functional virus-specific cellular immune response in asymptomatic SARS-CoV-2 infection

Affiliations
Randomized Controlled Trial

Highly functional virus-specific cellular immune response in asymptomatic SARS-CoV-2 infection

Nina Le Bert et al. J Exp Med. .

Abstract

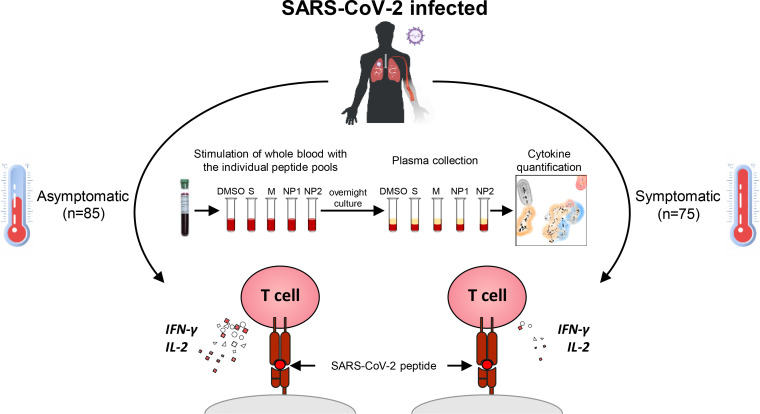
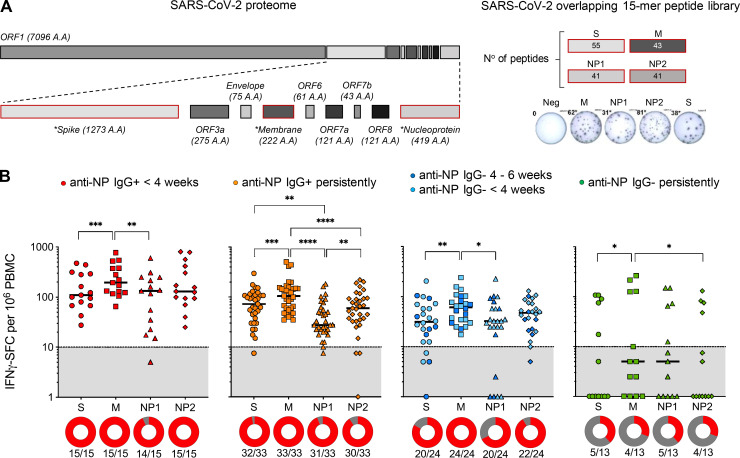
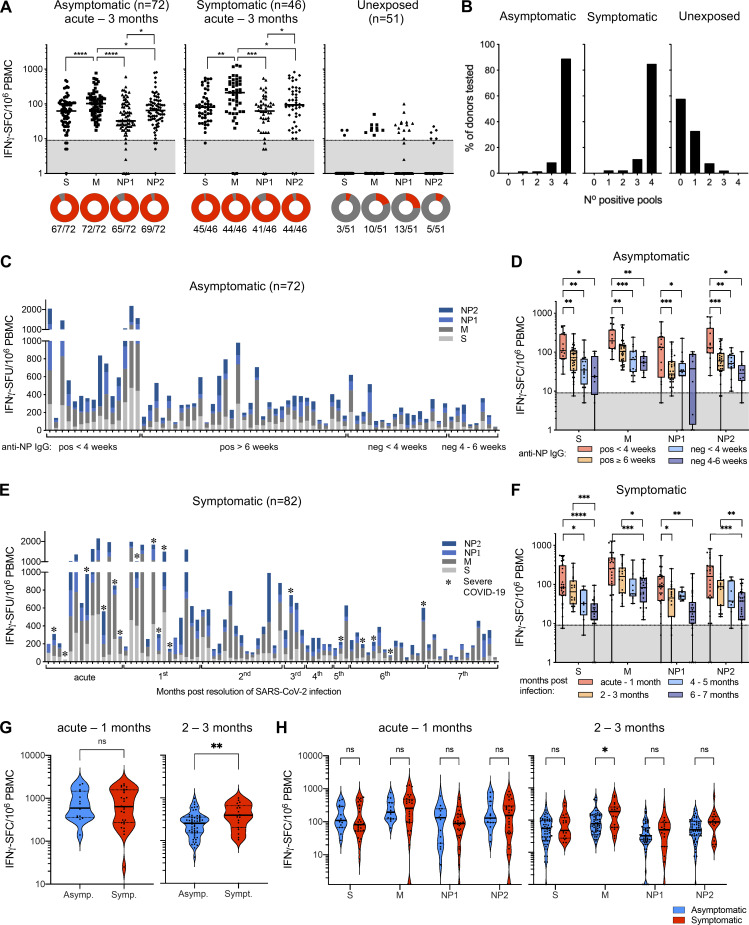
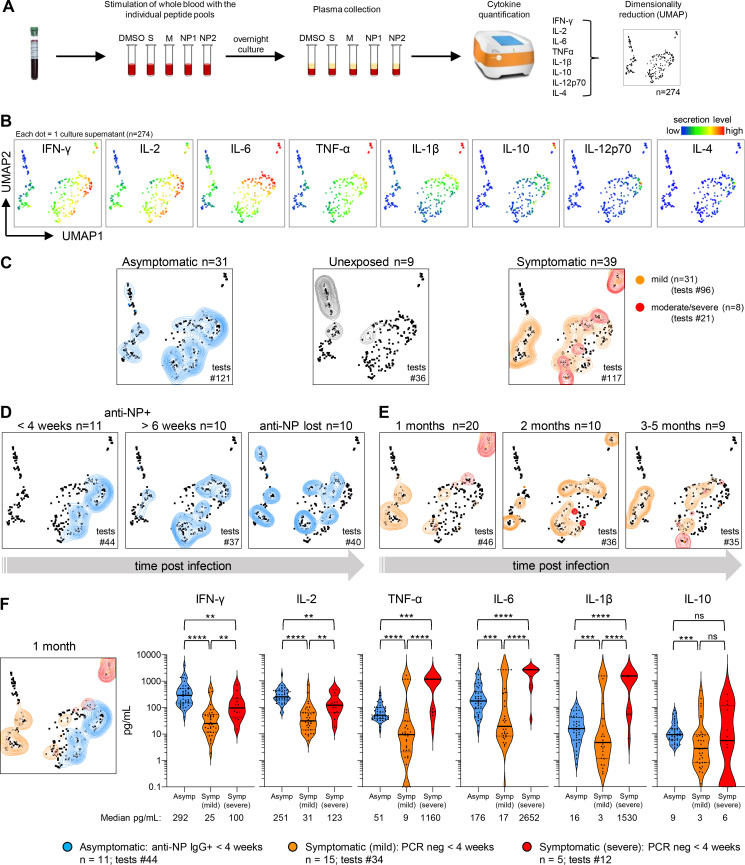
The efficacy of virus-specific T cells in clearing pathogens involves a fine balance between antiviral and inflammatory features. SARS-CoV-2-specific T cells in individuals who clear SARS-CoV-2 without symptoms could reveal nonpathological yet protective characteristics. We longitudinally studied SARS-CoV-2-specific T cells in a cohort of asymptomatic (n = 85) and symptomatic (n = 75) COVID-19 patients after seroconversion. We quantified T cells reactive to structural proteins (M, NP, and Spike) using ELISpot and cytokine secretion in whole blood. Frequencies of SARS-CoV-2-specific T cells were similar between asymptomatic and symptomatic individuals, but the former showed an increased IFN-γ and IL-2 production. This was associated with a proportional secretion of IL-10 and proinflammatory cytokines (IL-6, TNF-α, and IL-1β) only in asymptomatic infection, while a disproportionate secretion of inflammatory cytokines was triggered by SARS-CoV-2-specific T cell activation in symptomatic individuals. Thus, asymptomatic SARS-CoV-2-infected individuals are not characterized by weak antiviral immunity; on the contrary, they mount a highly functional virus-specific cellular immune response.


Conflict of interest statement

Disclosures: N. Le Bert and A.T. Tan reported a patent for a method to monitor SARS-CoV-2-specific T cells in biological samples pending. W.N. Chia reported a patent for a sublicense agreement with GenScript for the surrogate virus neutralization test pending (Duke-NUS). P. Tambyah reported grants from Arcturus, Roche, Shionogi, Sanofi-Pasteur, and Aj Biologics outside the submitted work. L. Wang reported a patent application on sVNT pending. A. Bertoletti reported personal fees from Oxford Immunotech and Qiagen outside the submitted work; in addition, A. Bertoletti had a patent for the use of peptide pools in whole blood for detection of SARS-CoV-2 T cells pending. C.C. Tam reported grants from Roche and personal fees from Verivax outside the submitted work. No other disclosures were reported.

Figures

None
Graphical abstract
Figure 1.
Figure 1.
Enrollment of SARS-CoV–exposed donors. (A) Confirmed cases of SARS-CoV-2 infection in Singapore, divided into imported cases (red), cases among dormitory residents (blue), and all other community cases (yellow). Black arrows indicate the dates when blood samples were taken for the study. (B) Diagram showing the number of participants that were invited and recruited into the study. Participants who completed blood donations at recruitment and at 2- and 6-wk follow-up were tested for serology of anti-NP IgG (Abbott) and sVNT-nAb (GenScript). An additional blood sample was taken at week 6 from 85 asymptomatic participants with distinct serological profiles for the analysis of SARS-CoV-2–specific T cell responses. *, Symptoms: any of fever, cough, runny nose, sore throat, shortness of breath, fatigue, muscle ache, diarrhea, or anosmia.
Figure 2.
Figure 2.
SARS-CoV-2–specific antibody profile shows increasing infection prevalence among dormitory residents during the study period. (A) Dormitory residents (n = 478) were tested longitudinally for serology. The percentage of donors positive for anti-NP IgG (black) and nAbs (gray) at recruitment and after 2 and 6 wk is shown; antibody-positive donors who experienced COVID-19 symptoms before (yellow) and during (red) the study are highlighted. (B) Dot plots show longitudinally the quantity of anti-NP IgG antibodies (y axis) and the percentage inhibition by virus neutralization antibodies (sVNT; x axis) in the serum of asymptomatic study participants (n = 434) at recruitment (left), after 2 wk (middle), and after 6 wk (right). The gray area marks the limit of assay detection. Spearman correlation. (C) Longitudinal anti-NP IgG levels of asymptomatic donors who were seropositive at recruitment (n = 106, left), who seroconverted at week 2 (n = 52, middle), and who seroconverted by week 6 (n = 77, right). (D) Anti-NP IgG serological profile of donors selected for SARS-CoV-2–specific T cell analysis at the 6-wk time point (n = 85). Donors with distinct antibody profiles are shown in different colors and are summarized in the table.
Figure S1.
Figure S1.
Kinetics of SARS-CoV-2 nAb profile in the asymptomatic study cohort. Longitudinal levels of nAbs measured as percentage inhibition by sVNT in asymptomatic donors who were seropositive at recruitment (n = 134, left), who seroconverted at week 2 (n = 81, middle), and who seroconverted by week 6 (n = 93, right). The gray area marks the limit of assay detection.
Figure 3.
Figure 3.
Frequency of T cells specific for different SARS-CoV-2 proteins in asymptomatic donors with distinct serological profiles. (A) SARS-CoV-2 proteome organization; analyzed proteins have a red outline and are marked by *. 15-mer peptides overlapping by 10 amino acids were split into pools covering NP1, NP2, and M and selected 15-mers covering the more T cell immunogenic regions of S. T cell reactivity was tested by ex vivo IFN-γ-ELISpot. (B) The frequency of IFN-γ SFCs reactive to the individual peptide pools is shown for the asymptomatic donors with distinct serological profiles (line = median). IFN-γ-SFC ≥10/106 PBMCs were considered positive (gray area is below limit of detection). Circles below represent the percentage of a positive response (red) to the individual peptide pools, and numbers of individuals tested are stated below the circles. Wilcoxon matched-pairs signed rank test. *, P < 0.05; **, P < 0.01; ***, P < 0.001; ****, P < 0.0001.
Figure S2.
Figure S2.
T cells reactive to different pools of S peptides in COVID-19 convalescents. Spike is a long protein with 1,276 amino acids; thus it requires 253 15-mer peptides overlapping by 10 amino acids to cover the whole protein, equaling 7 pools of ∼40 peptides. To reduce the number of peptide pools to test, we selected a single “S pool” comprising 55 peptides. For the selection, all sequences of published SARS-CoV-1 epitopes (http://www.iedb.org; positive assays only, T cells assays, host: human) were aligned with the library of S-SARS-CoV-2 15-mers. We selected the 15-mer peptides that cover the homologue sequence of the described SARS-CoV-1 epitope sequences. In addition, we added the 15-mer peptides that cover the predicted SARS-CoV-2 S epitopes published by Grifoni et al. (2020b). The 55 peptides cover 40.5% of the S protein. The frequency of reactive cells to the selected S pool (red) was compared with the seven pools of 15-mers overlapping by 10 amino acids covering together the entire S protein (S1–S7) in COVID-19 convalescents (n = 15).
Figure S3.
Figure S3.
CD4+ and CD8+ T cells are reactive to stimulation with SARS-CoV-2–specific peptides. For asymptomatic donors (n = 3; <4 wk anti-NP IgG+), short-term T cell lines were generated by PBMC stimulation with the different peptide pools and a 10-d expansion protocol (Le Bert et al., 2020). A peptide pool-matrix strategy was applied that identified single T cell epitopes. Subsequently, the short-term T cell lines were restimulated for 5 h with the identified single peptides and analyzed by intracellular cytokine staining for IFN-γ. (A) The gating strategy to identify CD4+ and CD8+ T cells is shown. FSC, forward scatter; SSC, side scatter. (B) Dot plots show examples of CD4+ and CD8+ T cells producing IFN-γ in response to stimulation with three different peptides (upper panels) and the corresponding unstimulated controls (lower panels).
Figure 4.
Figure 4.
Dynamics and hierarchy of SARS-CoV-2–specific T cells in asymptomatic and symptomatic infection. (A) The frequency of IFN-γ SFCs reactive to the individual peptide pools is shown for asymptomatic SARS-CoV-2–infected donors who were serologically positive for anti-NP IgG at at least one time point during the study period (n = 72; left), for COVID-19 patients from acute to 3 mo after infection (n = 45; middle), and archived unexposed controls (n = 51; right; line = median). Circles below represent the frequency of a positive (IFN-γ-SFC ≥10/106 PBMCs) response (red) to the individual peptide pools. Repeated-measures one-way ANOVA with Greenhouse–Geisser correction, followed by Holm–Sidak’s multiple comparisons test. (B) Bar graphs show the percentage of donors reacting to the number of peptide pools tested. (C) Frequency of IFN-γ SFCs reactive to the individual peptide pools is shown for each donor of the asymptomatic cohort (n = 72). Donors are organized according to their serological status of anti-NP IgG antibodies. (D) The frequency of IFN-γ SFCs reactive to the individual peptide pools is shown in asymptomatic donors grouped by anti-NP IgG status (anti-NP IgG positive <4 wk: n = 15; anti-NP IgG positive >6 wk: n = 33; anti-NP IgG negative <4 wk: n = 16; anti-NP IgG negative 4–6 wk: n = 8). Unpaired t test. (E) Frequency of IFN-γ SFCs reactive to the individual peptide pools is shown for symptomatic COVID-19 patients organized by months after clearance of SARS-CoV-2 infection (n = 82). (F) The frequency of IFN-γ SFCs reactive to the individual peptide pools is shown in COVID-19 patients grouped by months after infection (acute to 1 mo: n = 28; 2–3 mo: n = 18; 4–5 mo: n = 9; 6–7 mo: n = 27). Unpaired t test. (G and H) Frequency of SARS-CoV-2 peptide–reactive cells in individuals with asymptomatic (blue) and symptomatic (red) infection during the acute phase until 1 mo after recovery (left; asymptomatic: n = 15; symptomatic: n = 28) and in convalescents 2–3 mo after infection (right; asymptomatic: n = 57; symptomatic: n = 19; G) and deconvoluted to the individual peptide pools (H). Mann–Whitney tests. *, P < 0.05; **, P < 0.01; ***, P < 0.001; ****, P < 0.0001.
Figure 5.
Figure 5.
Cytokine secretion profile of whole-blood cultures from asymptomatic and symptomatic convalescents stimulated with SARS-CoV-2 peptide pools. (A) Schematic of whole-blood stimulation with SARS-CoV-2 peptide pools overnight and analysis of the cytokine secretion profile (after DMSO control subtraction) using unsupervised clustering algorithm UMAP. (B) UMAP plots generated with all analyzed blood culture supernatants (n = 274) with indicated cytokine secretion heatmaps. (C) Concatenated cytokine secretion profiles of peptide-pool stimulated whole blood from asymptomatic SARS-CoV-2–infected (left; blue), SARS-CoV-2–unexposed (middle; gray), and SARS-CoV-2 infected with mild (right; orange) and moderate to severe (right; red) symptoms overlaid on the global UMAP plot of all analyzed samples (black dots; each dot corresponds to one culture supernatant). Number of individuals tested are indicated above the quadrant (n); each individual was usually tested with four different peptide pools, and total tests performed are indicated within each quadrant (#). (D) The cytokine secretion profile of the samples from the asymptomatic cohort separated by donors who seroconverted to anti-NP IgG+ <4 wk before (left), who were persistently seropositive (middle), and those who lost anti-NP IgG during the 6-wk study period (right). (E) The cytokine secretion profile of the samples from the symptomatic cohort separated by donors who were in the first month (left), second month (middle), and third to fifth months (right) after SARS-CoV-2 infection. (F) The amount of indicated cytokines secreted upon whole blood stimulation with the peptide pools is compared between donors who had a recent (<4 wk ago) asymptomatic (blue; n = 11; tests # = 44) or mild (orange; n = 15; tests # = 34) or moderate to severe (red; n = 5; tests # = 12) symptomatic SARS-CoV-2 infection. Line = median concentration. Mann–Whitney tests. **, P < 0.01; ***, P < 0.001; ****, P < 0.0001.
Figure S4.
Figure S4.
Cytokines produced by immune cells following stimulation with SARS-CoV-2 peptide pools. PBMCs (n = 3) were stimulated for 5 h (or 7 h for IL-6) with SARS-CoV-2 peptide pools and analyzed by intracellular cytokine staining. (A) The gating strategy to identify the different immune cell subsets is shown. FSC, forward scatter; SSC, side scatter. (B) Dot plots show examples (n = 1) of T cells producing IFN-γ, TNF-α, and IL-2 and monocytes producing IL-6 in response to stimulation with the M peptide pool (red) overlaid with the corresponding unstimulated controls (black).
Figure S5.
Figure S5.
Cytokine secretion profile of whole blood from asymptomatic and symptomatic convalescents stimulated with SARS-CoV-2 peptide pools, separated by age and SARS-CoV-2 proteins. (A) UMAP plots comparing the cytokine secretion profiles of whole blood stimulated with SARS-CoV-2 peptide pools between asymptomatic (blue) and symptomatic (orange/red) SARS-CoV-2–infected individuals (all analyzed time points after infection). Donors of both groups were divided into different age groups (20–29 yr, top; 30–39 yr, middle; 40–49 yr, bottom). The violin plots show the quantity of IFN-γ and IL-2 detected in the culture supernatants. Number of individuals tested are indicated (n); each individual was usually tested with four different peptide pools, and total tests performed are indicated (#). (B) As in A, but only for the samples collected within 1 mo after infection. (C) UMAP plots comparing the cytokine secretion profiles of whole blood from asymptomatic (blue) and symptomatic (orange/red) SARS-CoV-2–infected individuals stimulated with the four different SARS-CoV-2 peptide pools shown individually. The violin plots show the quantity of IFN-γ (left) and IL-2 (right) detected in the different culture supernatants. Mann–Whitney tests. *, P < 0.05; **, P < 0.01; ***, P < 0.001; ****, P < 0.0001.
Figure 6.
Figure 6.
Frequency and function of SARS-CoV-2 peptide pool–reactive cells. (A) The frequency of IFN-γ SFCs reactive to the peptide pools analyzed by ELISpot assay (x axis) is plotted against the amount of the cytokines secreted following whole-blood stimulation with the identical peptide pools (y axis) of the asymptomatic cohort (n = 28; tests # = 109). Samples from donors with recent SARS-CoV-2 infection (<4 wk anti-NP IgG+) are highlighted in blue. Spearman correlation. (B) The frequency of IFN-γ–secreting cells (SFC) reactive to the peptide pools analyzed by ELISpot assay (x axis) is plotted against the amount of the cytokines secreted following whole-blood stimulation with the identical peptide pools (y axis) of the symptomatic cohort (n = 37; tests # = 109). Samples from donors with recent SARS-CoV-2 infection (<4 wk PCR neg) are highlighted in red. Spearman correlation.

References

    1. Atyeo, C., Fischinger S., Zohar T., Slein M.D., Burke J., Loos C., McCulloch D.J., Newman K.L., Wolf C., Yu J., et al. . 2020. Distinct Early Serological Signatures Track with SARS-CoV-2 Survival. Immunity. 53:524–532.e4. 10.1016/j.immuni.2020.07.020 - DOI - PMC - PubMed
    1. Becht, E., McInnes L., Healy J., Dutertre C.-A., Kwok I.W.H., Ng L.G., Ginhoux F., and Newell E.W.. 2018. Dimensionality reduction for visualizing single-cell data using UMAP. Nat. Biotechnol. 37:38–44. 10.1038/nbt.4314 - DOI - PubMed
    1. Cervia, C., Nilsson J., Zurbuchen Y., Valaperti A., Schreiner J., Wolfensberger A., Raeber M.E., Adamo S., Emmenegger M., Hasler S., et al. . 2020. Systemic and mucosal antibody secretion specific to SARS-CoV-2 during mild versus severe COVID-19. bioRxiv. 10.1101/2020.05.21.108308 (Preprint posted May 23, 2020) - DOI - PMC - PubMed
    1. Couper, K.N., Blount D.G., and Riley E.M.. 2008. IL-10: the master regulator of immunity to infection. J. Immunol. 180:5771–5777. 10.4049/jimmunol.180.9.5771 - DOI - PubMed
    1. De Biasi, S., Meschiari M., Gibellini L., Bellinazzi C., Borella R., Fidanza L., Gozzi L., Iannone A., Lo Tartaro D., Mattioli M., et al. . 2020. Marked T cell activation, senescence, exhaustion and skewing towards TH17 in patients with COVID-19 pneumonia. Nat. Commun. 11:3434. 10.1038/s41467-020-17292-4 - DOI - PMC - PubMed

Publication types