. 2021 Mar 9;5(5):1209-1223.
doi: 10.1182/bloodadvances.2020001844.

Genome-wide interference of ZNF423 with B-lineage transcriptional circuitries in acute lymphoblastic leukemia

Affiliations

Genome-wide interference of ZNF423 with B-lineage transcriptional circuitries in acute lymphoblastic leukemia

Pablo Iglesias et al. Blood Adv. .

Abstract

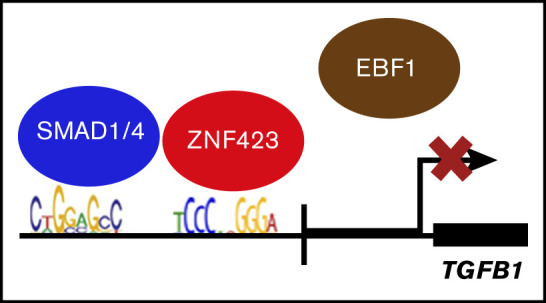
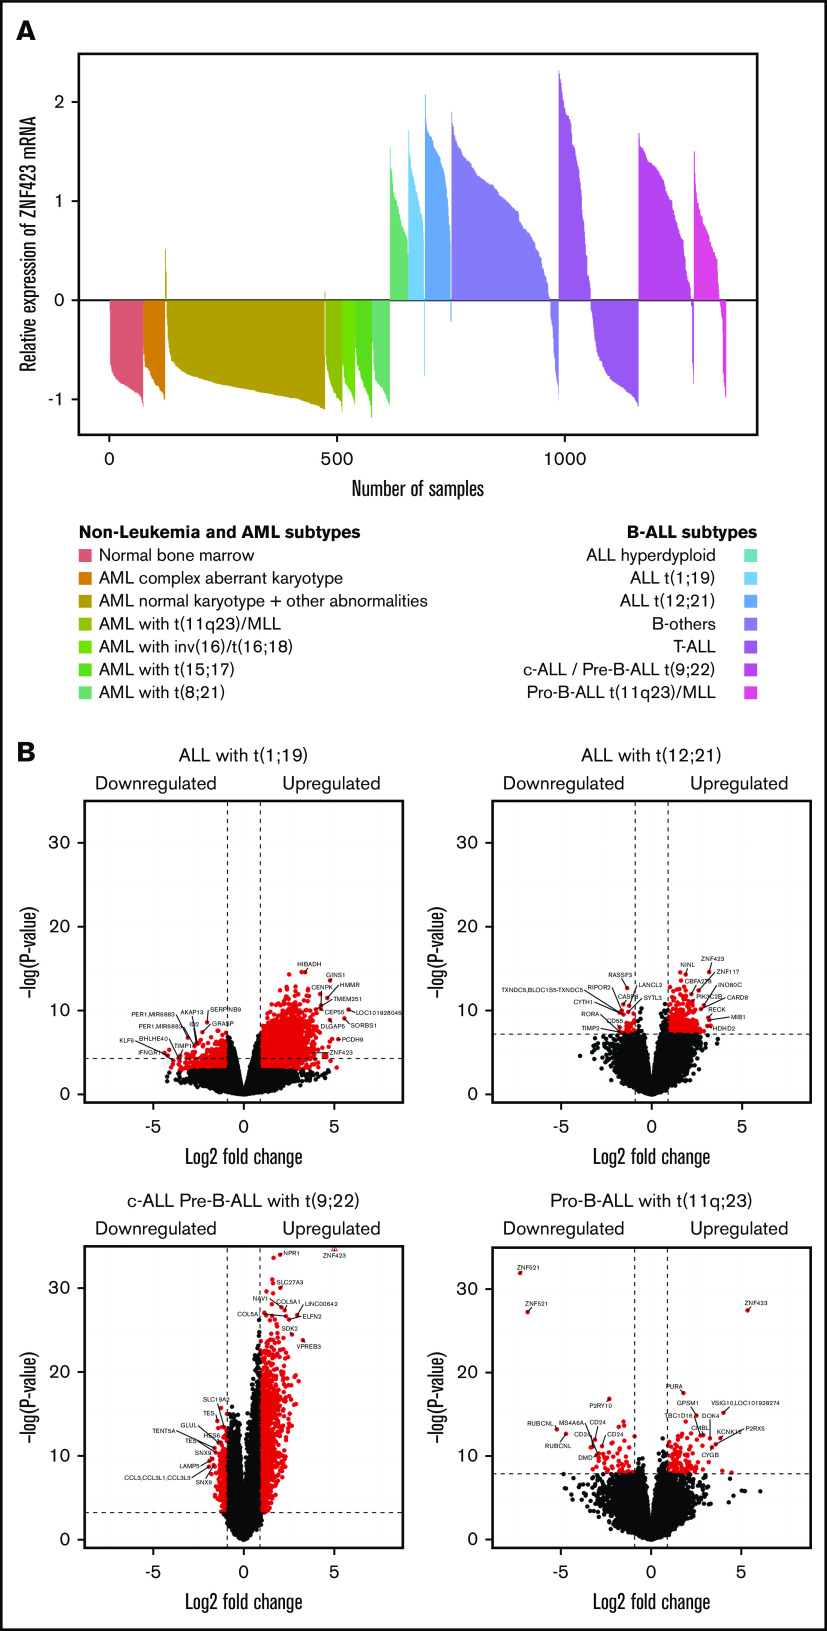
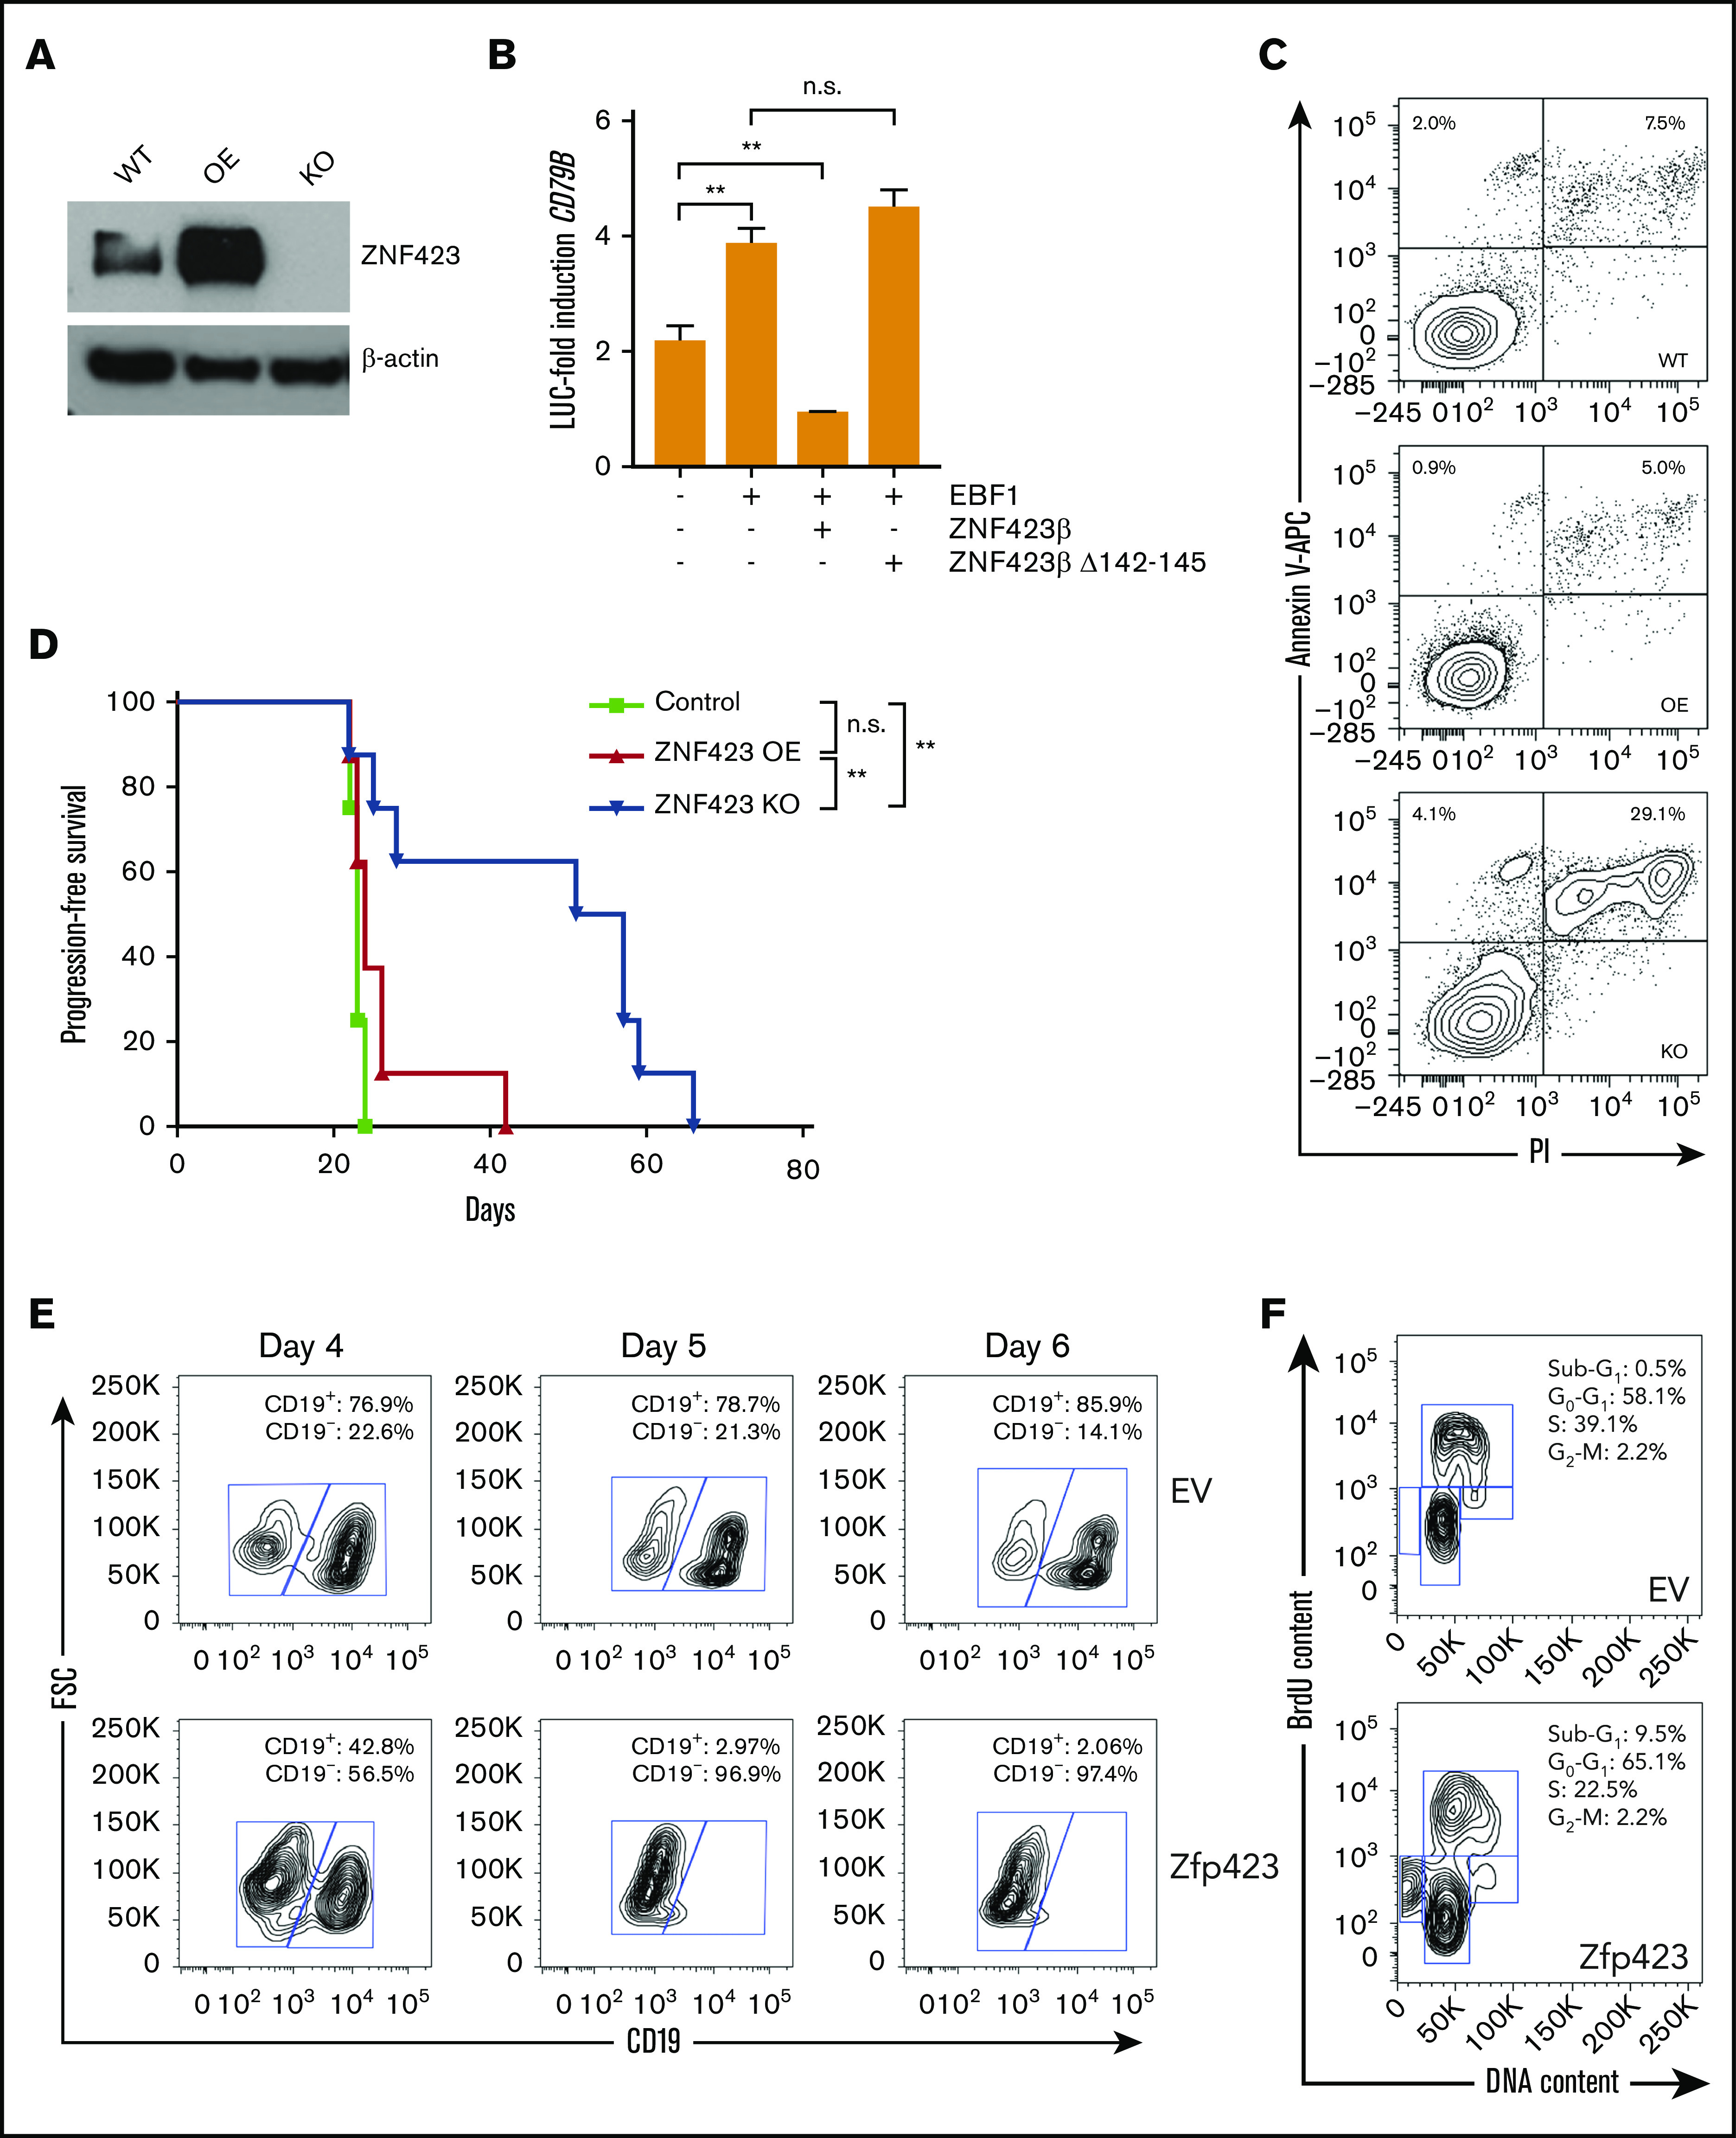
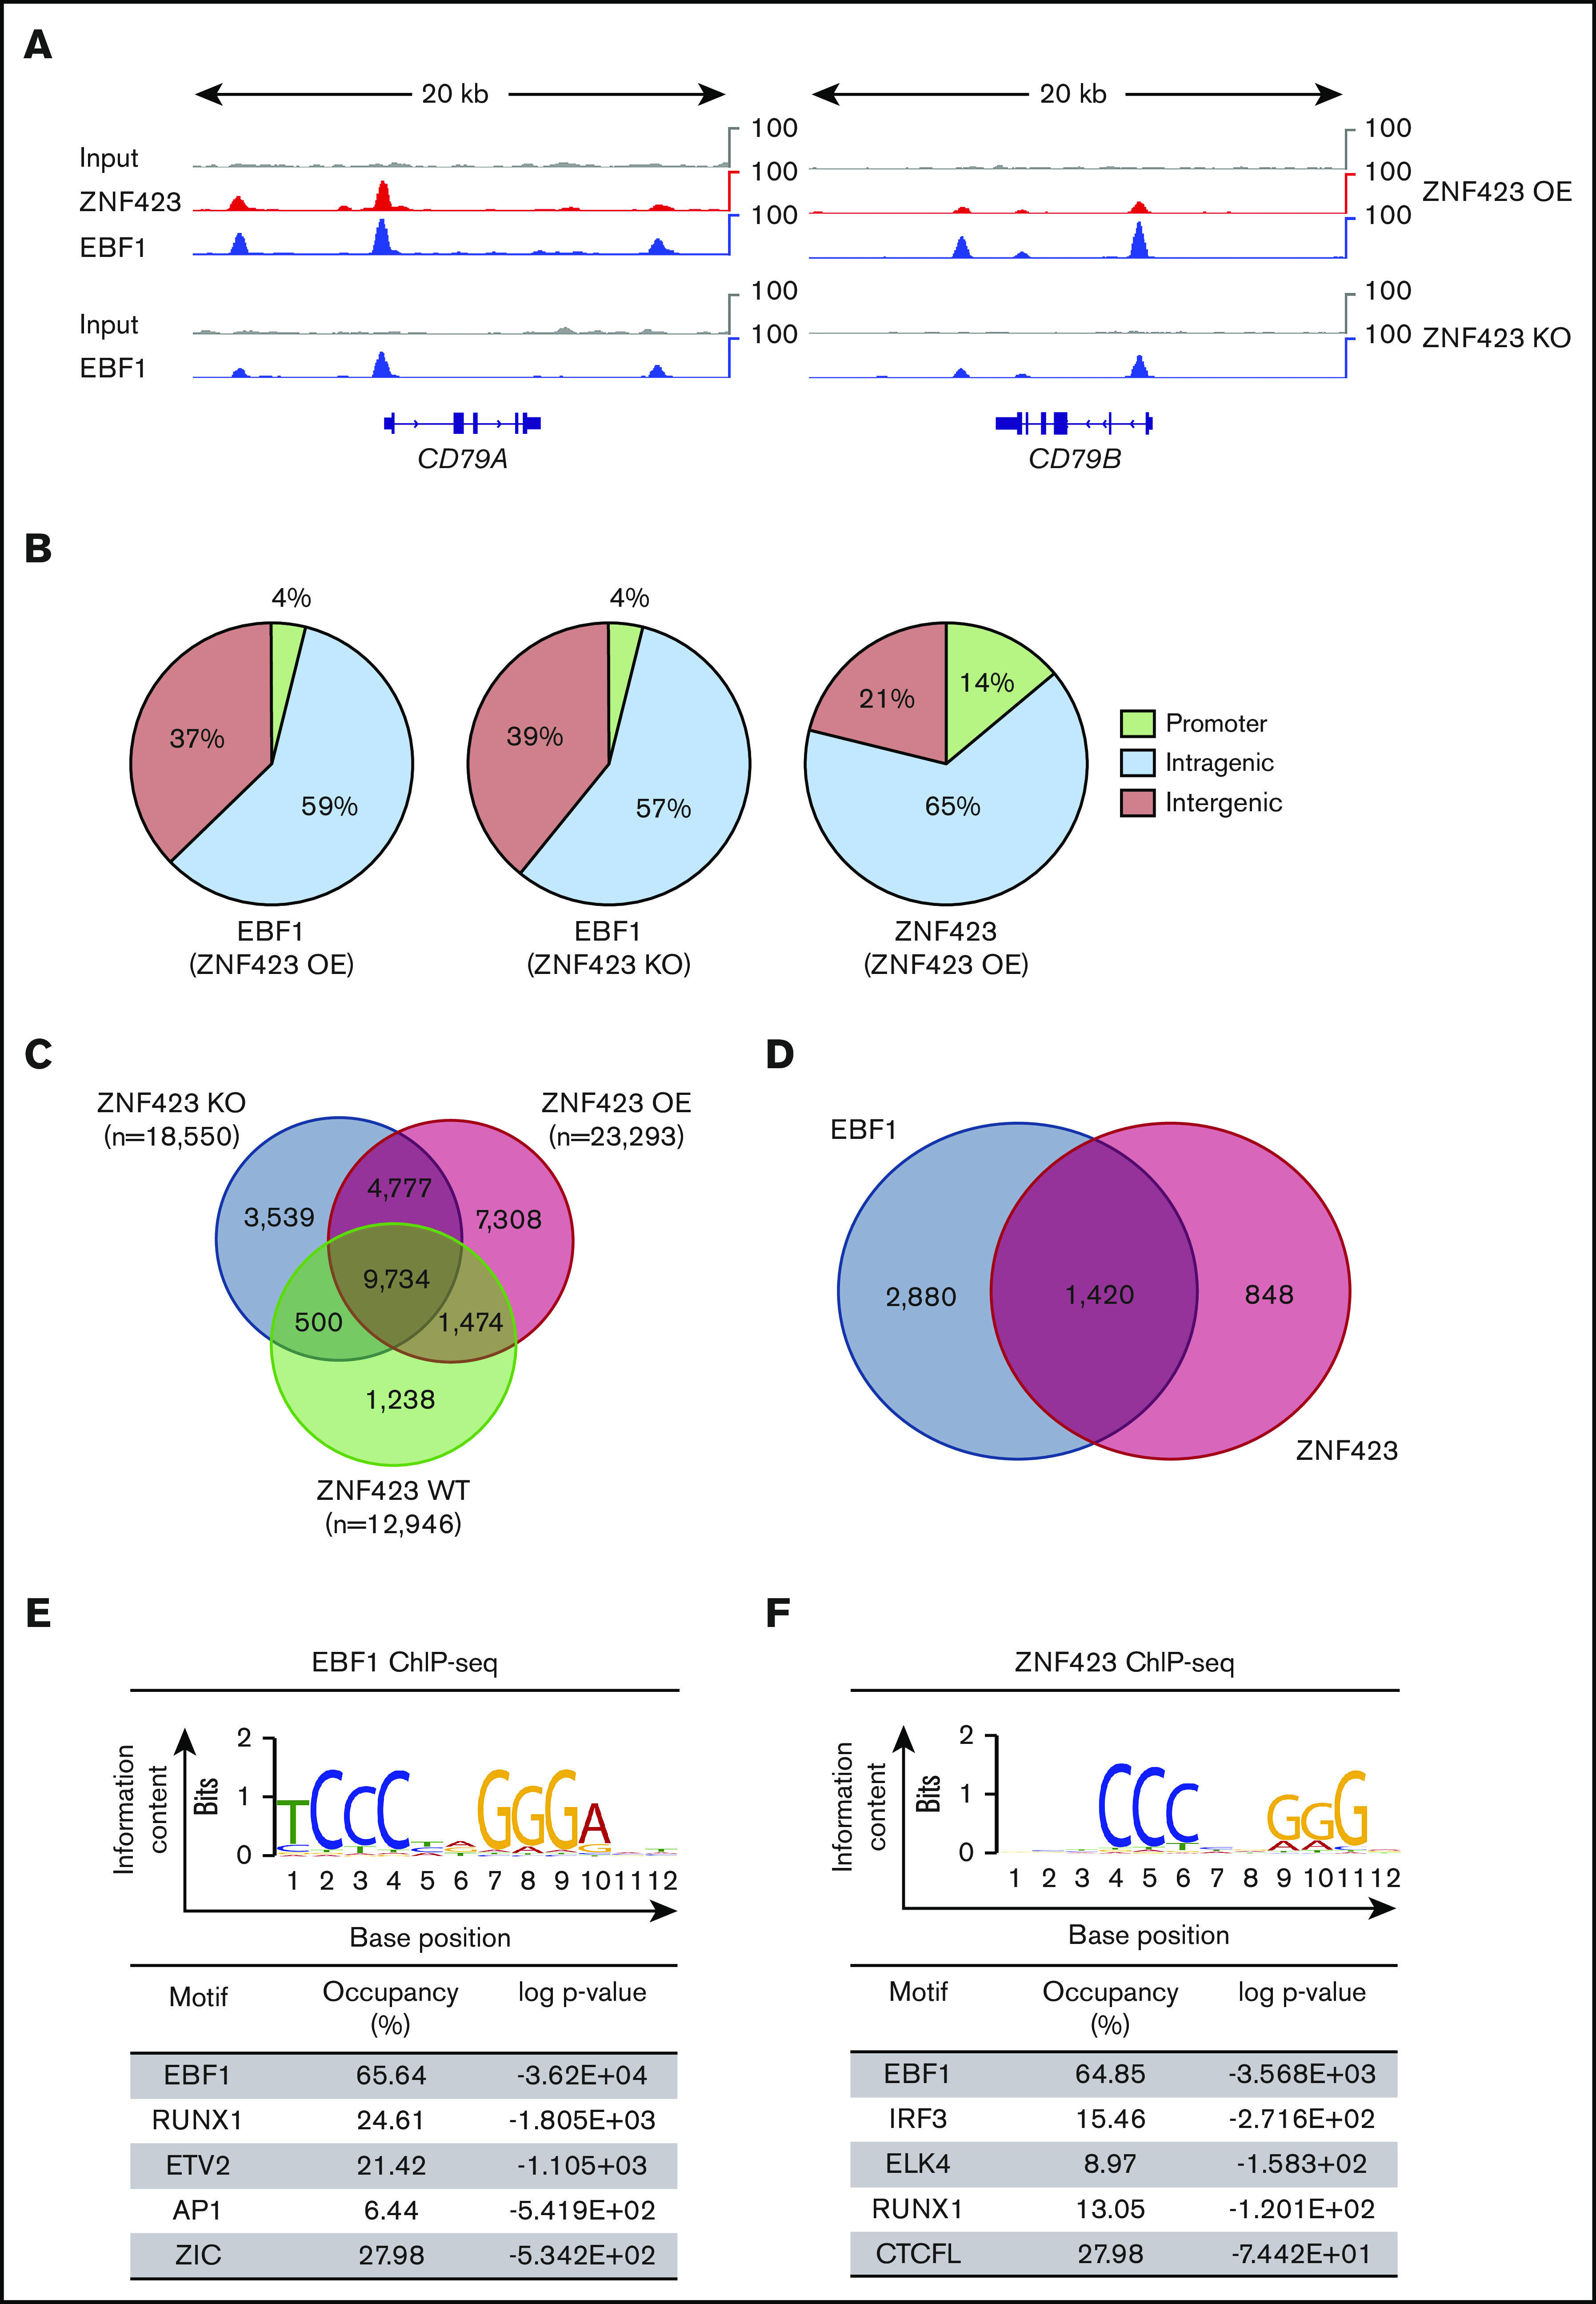
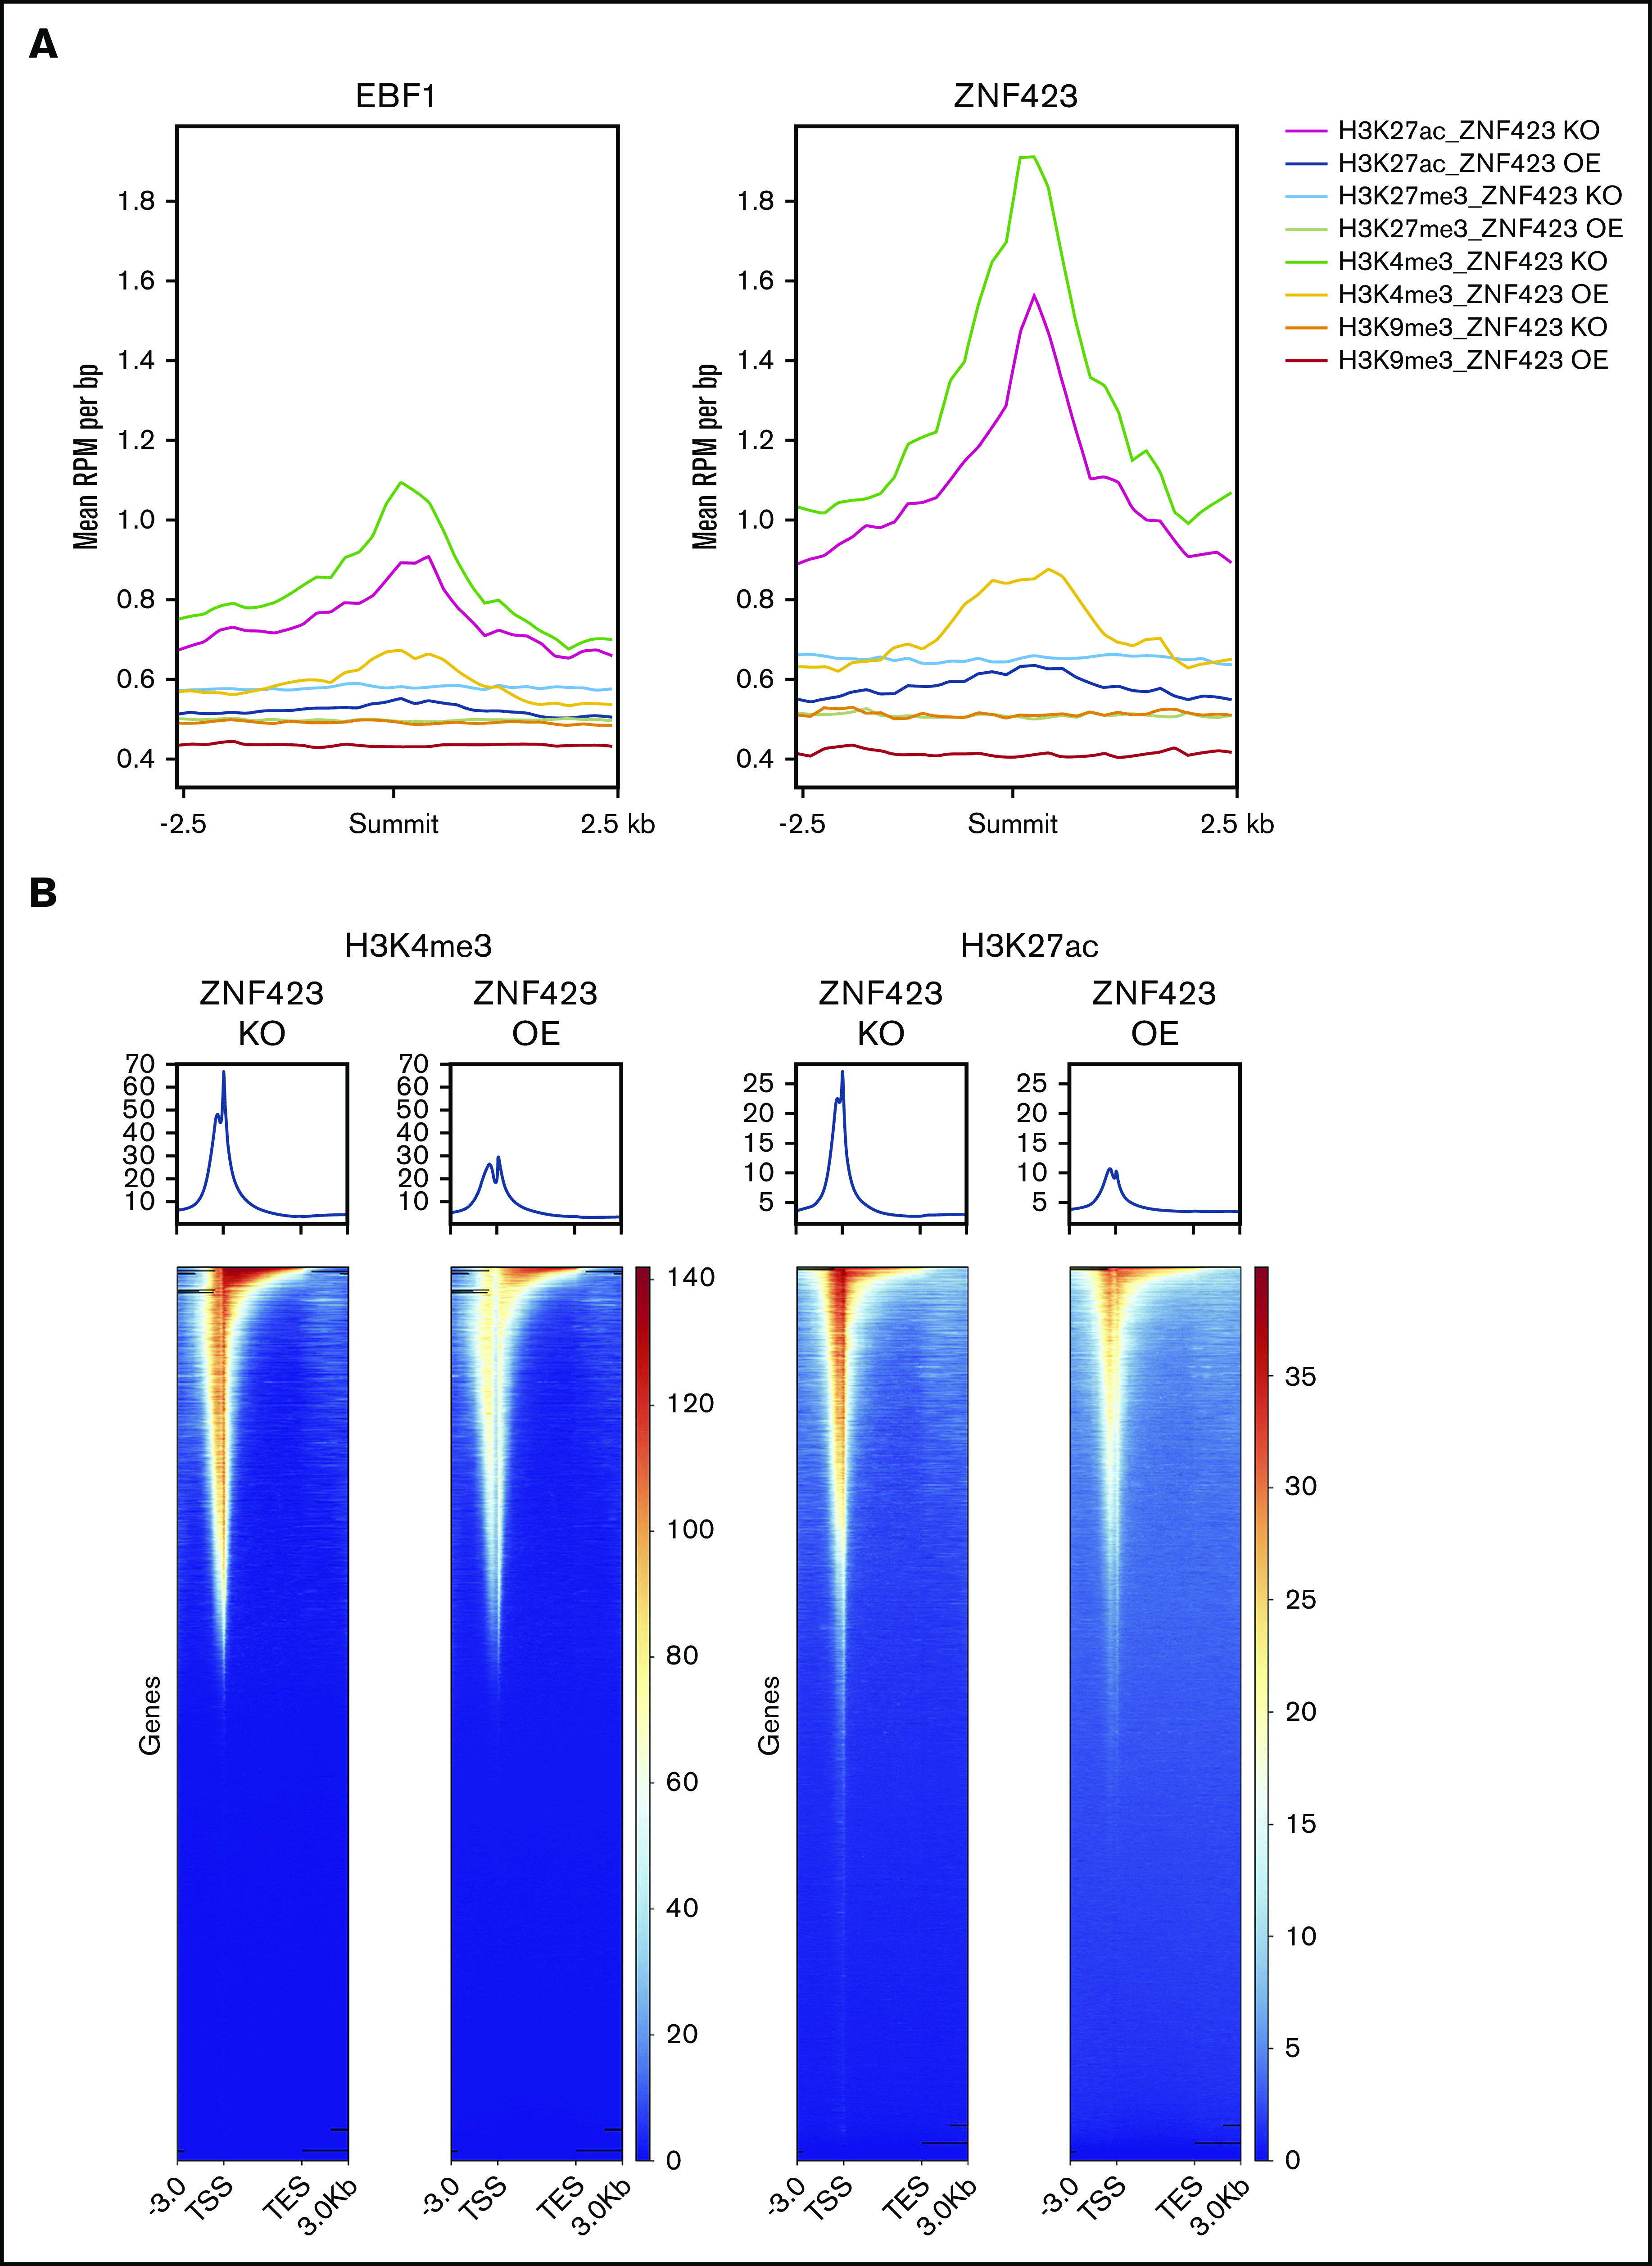
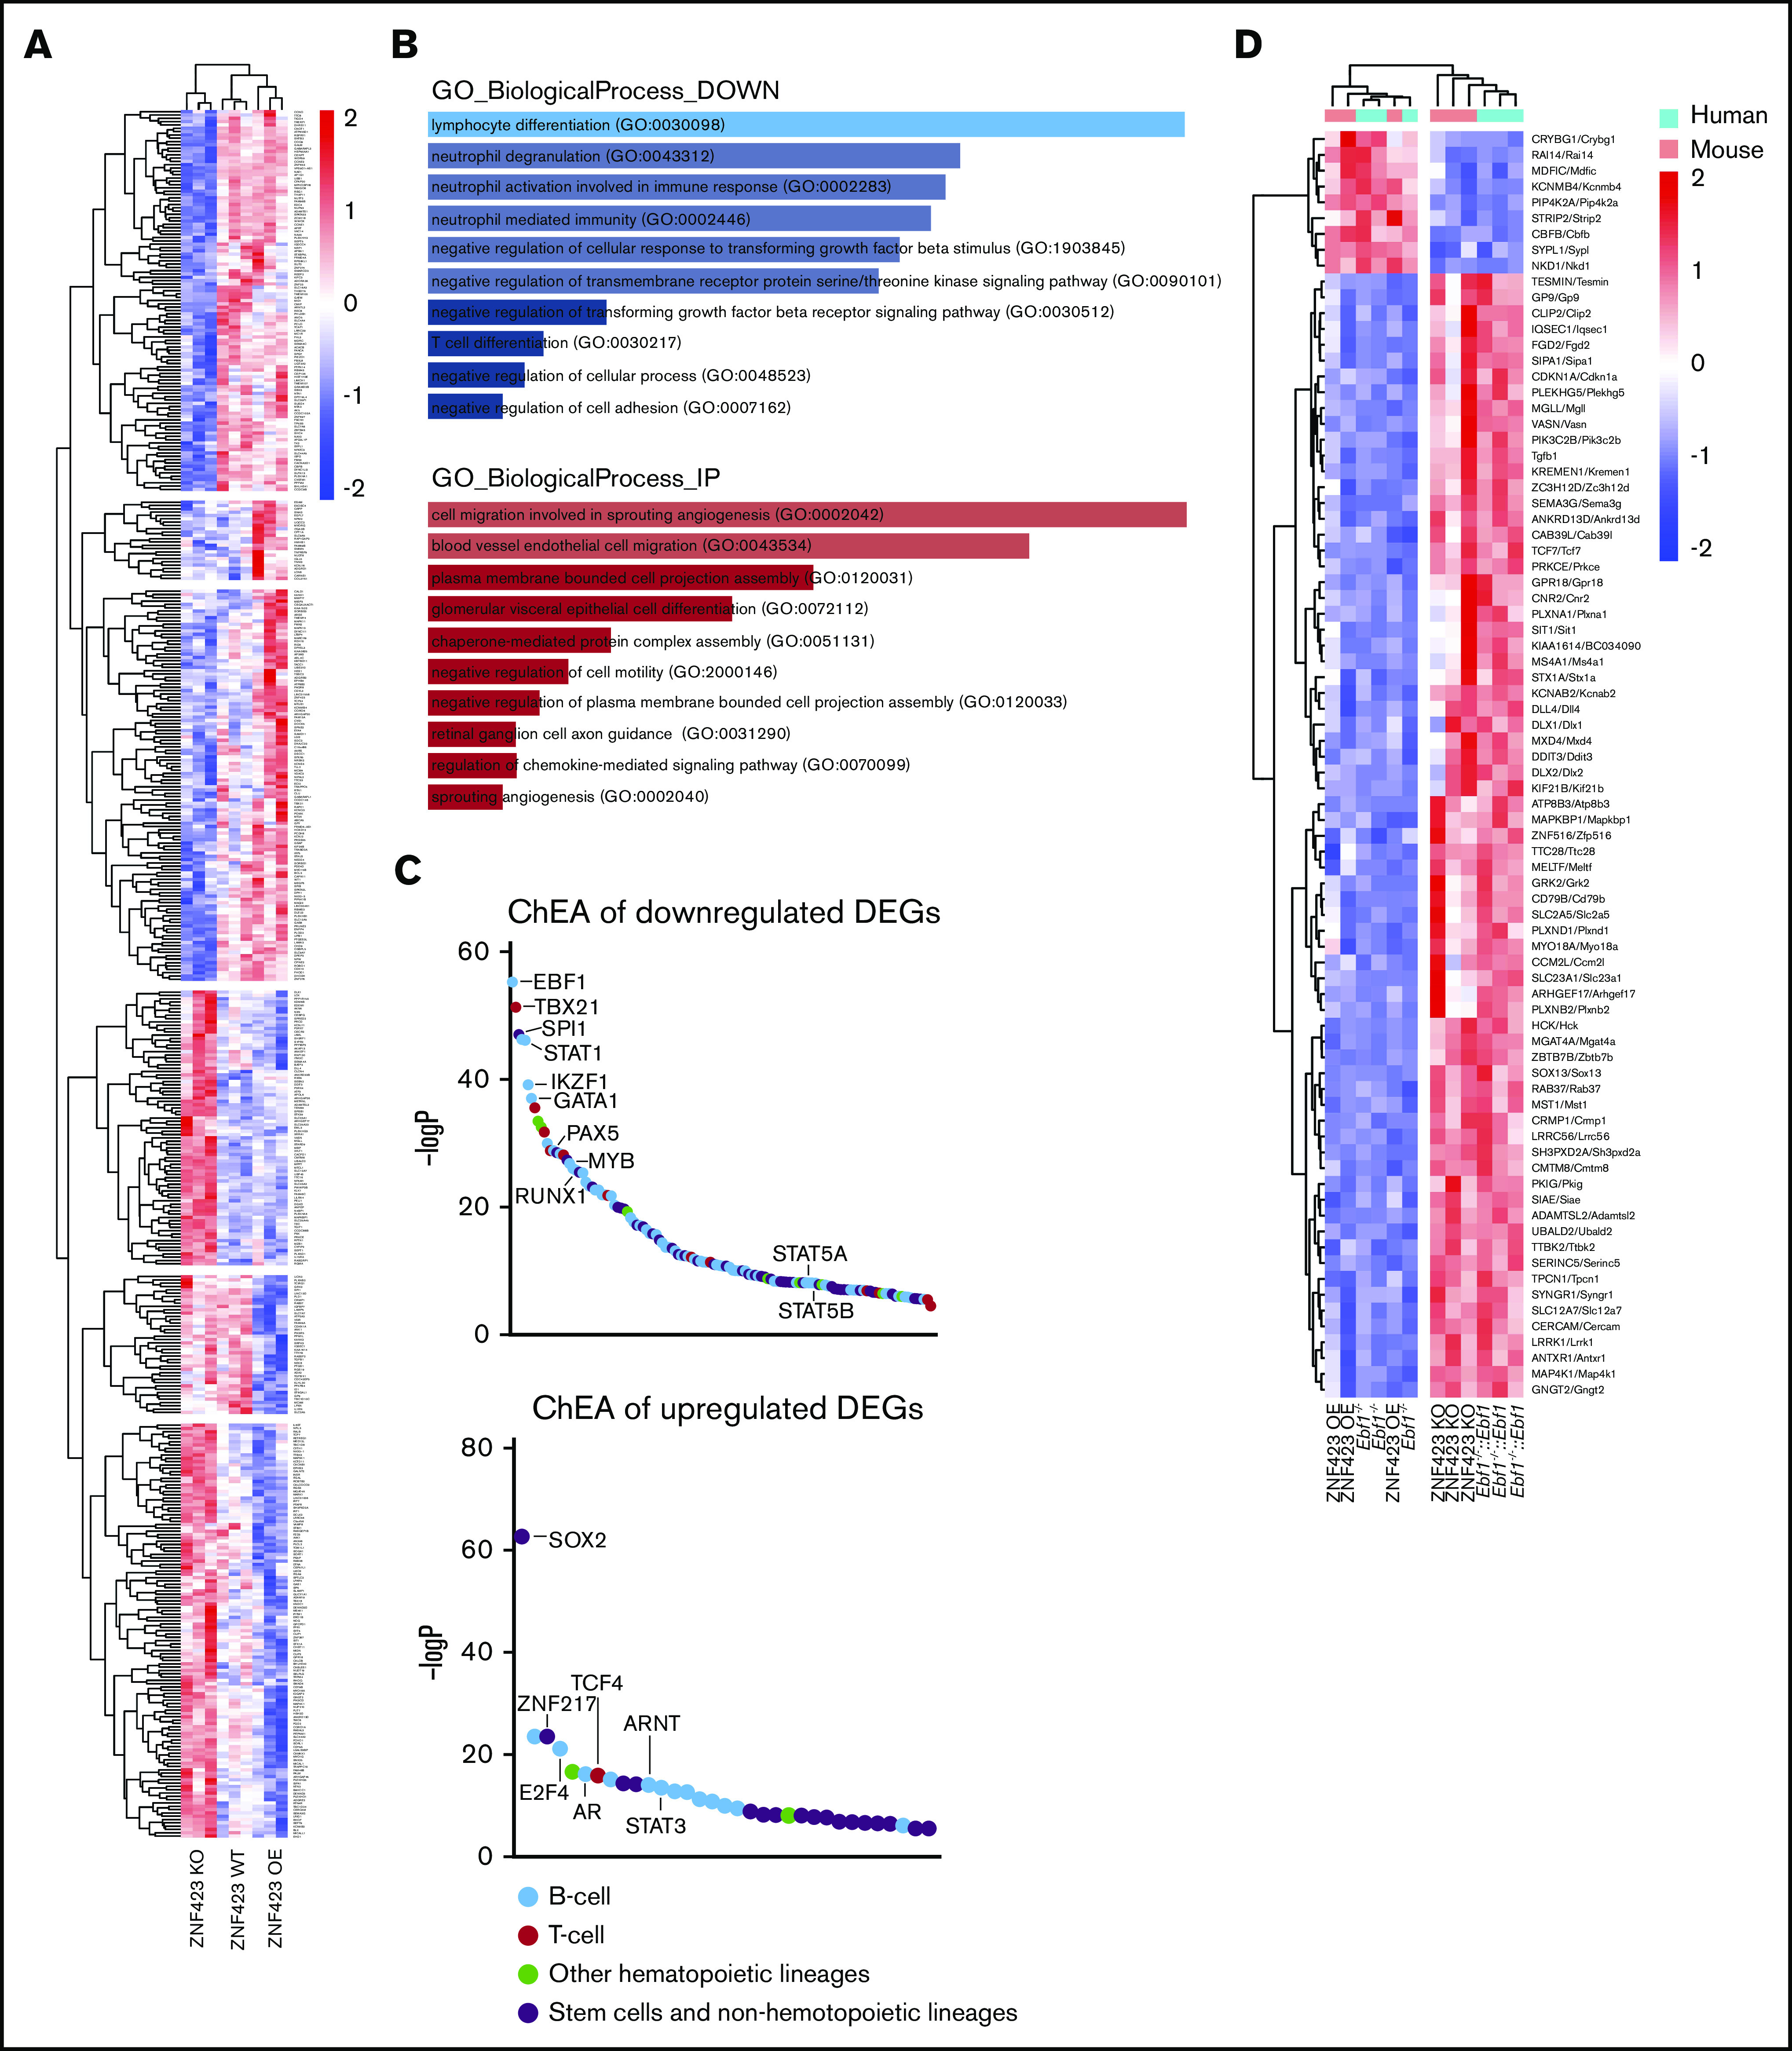
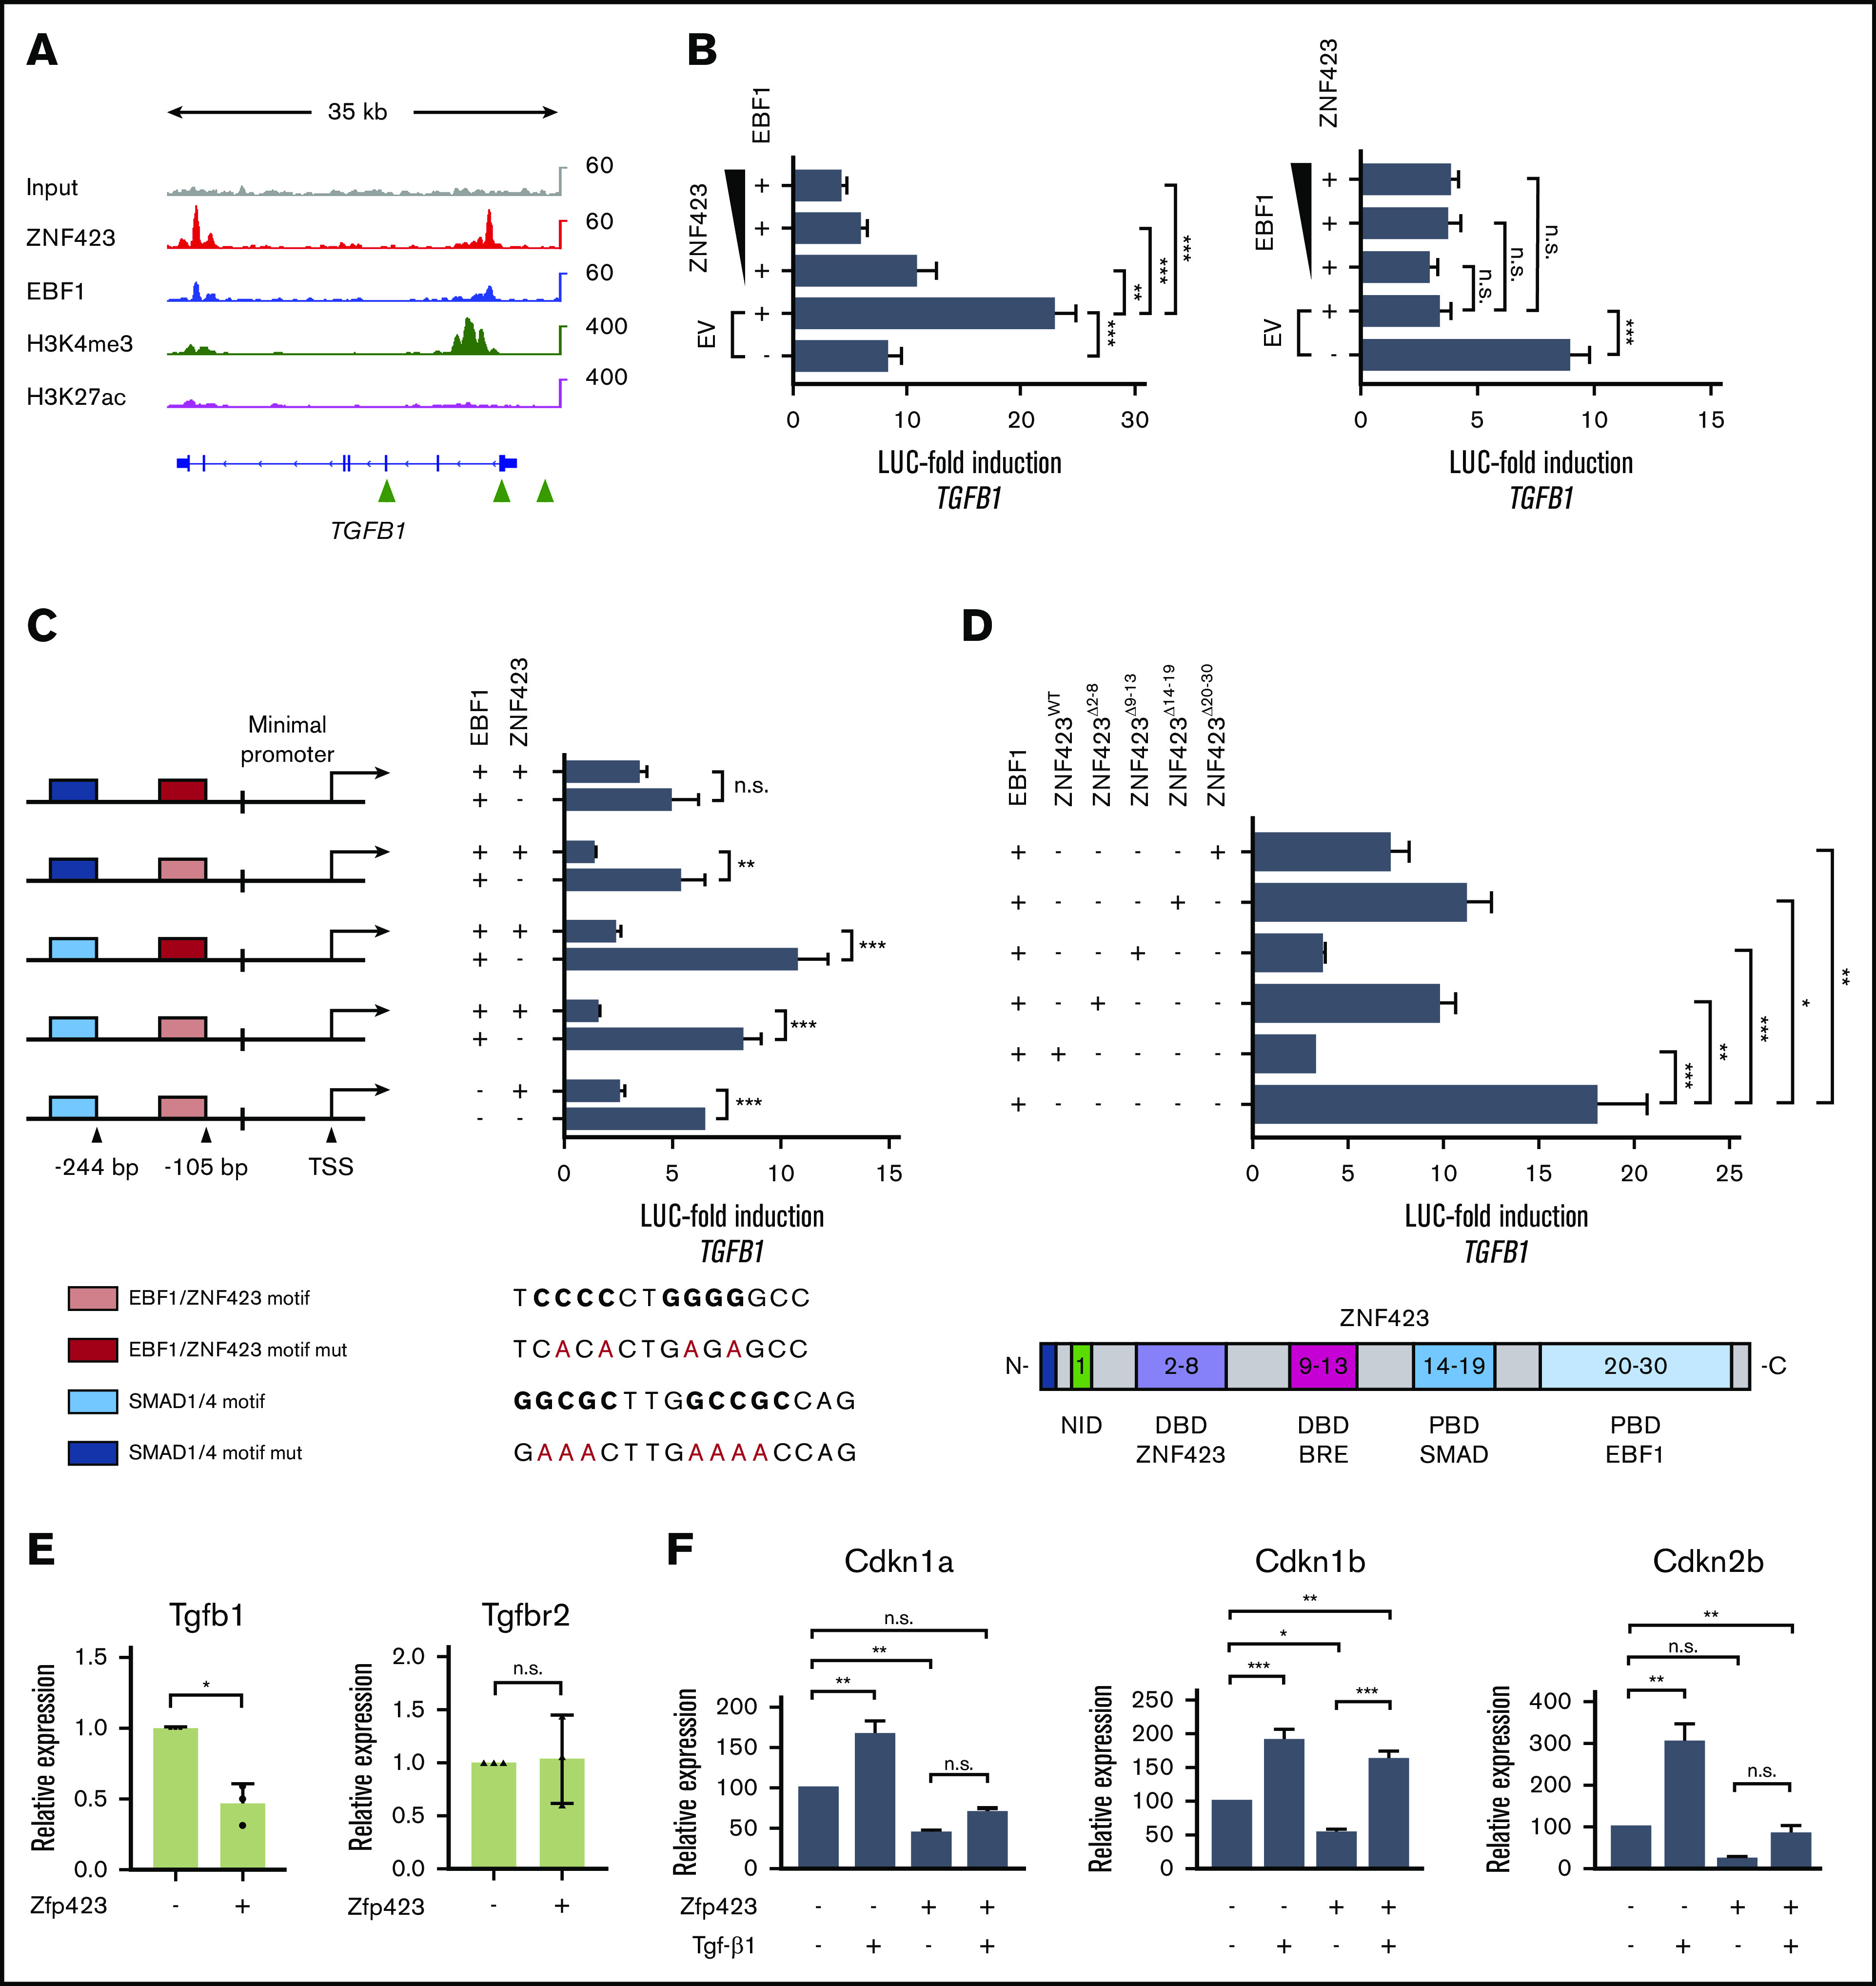
Aberrant expression of the transcriptional modulator and early B-cell factor 1 (EBF1) antagonist ZNF423 has been implicated in B-cell leukemogenesis, but its impact on transcriptional circuitries in lymphopoiesis has not been elucidated in a comprehensive manner. Herein, in silico analyses of multiple expression data sets on 1354 acute leukemia samples revealed a widespread presence of ZNF423 in various subtypes of acute lymphoblastic leukemia (ALL). Average expression of ZNF423 was highest in ETV6-RUNX1, B-other, and TCF3-PBX1 ALL followed by BCR-ABL, hyperdiploid ALL, and KMT2A-rearranged ALL. In a KMT2A-AFF1 pro-B ALL model, a CRISPR-Cas9-mediated genetic ablation of ZNF423 decreased cell viability and significantly prolonged survival of mice upon xenotransplantation. For the first time, we characterized the genome-wide binding pattern of ZNF423, its impact on the chromatin landscape, and differential gene activities in a B-lineage context. In general, chromatin-bound ZNF423 was associated with a depletion of activating histone marks. At the transcriptional level, EBF1-dependent transactivation was disrupted by ZNF423, whereas repressive and pioneering activities of EBF1 were not discernibly impeded. Unexpectedly, we identified an enrichment of ZNF423 at canonical EBF1-binding sites also in the absence of EBF1, which was indicative of intrinsic EBF1-independent ZNF423 activities. A genome-wide motif search at EBF1 target gene loci revealed that EBF1 and ZNF423 co-regulated genes often contain SMAD1/SMAD4-binding motifs as exemplified by the TGFB1 promoter, which was repressed by ZNF423 outcompeting EBF1 by depending on its ability to bind EBF1 consensus sites and to interact with EBF1 or SMADs. Overall, these findings underscore the wide scope of ZNF423 activities that interfere with B-cell lymphopoiesis and contribute to leukemogenesis.


Conflict of interest statement

Conflict-of-interest disclosure: The authors declare no competing financial interests.

Figures

None
Graphical abstract
Figure 1.
Figure 1.
ZNF423 is linked to differential gene regulation in subtypes of ALL. (A) Expression of ZNF423 transcripts in ALL, acute myeloid leukemia (AML), and normal bone marrow. Relative ZNF423 expression is depicted as Z-score computed from microarray data sets (MILE). Samples were color coded according to immunophenotypical and genetic subtype. (B) Differential gene regulation that is dependent on ZNF423 expression in 4 distinct genetic subtypes of ALL is depicted as volcano plots. Red dots, significant DEGs; black dots, nonsignificant DEGs. DEGs were calculated between upper and lower deciles of the samples from each subtype defined by ZNF423 expression. Top-ranked genes for each subtype and direction of regulation were highlighted. c-ALL, common ALL.
Figure 2.
Figure 2.
Expression of ZNF423, EBF1, SMAD1, and pSMAD1/5 in various hematopoietic cell lines. (A) Relative expression of ZNF423 messenger RNA (mRNA) (left panel) and EBF1 mRNA (right panel) in B-precursor, T-precursor lymphoblastic, and myelomonocytic leukemia cell lines. Real-time polymerase chain reaction (RT-PCR) was performed in technical triplicates with almost identical results (and minimal standard deviation [SD]). Data points represent the average expression level. (B) Immunoblot showing protein expression of ZNF423 and EBF1 in various leukemia cell lines using ZNF423- and EBF1-directed monoclonal antibodies. (C) Phospho-immunoblot analysis of SMAD1 after BMP2 stimulation (baseline vs 1-hour treatment with BMP2) of ALL cell lines. HeLa cell line was included as positive BMP2-SMAD–signaling control. Note cross-reactivity of pSMAD–directed antibody toward SMAD1 and SMAD5. β-actin was included as protein loading control. pSMAD1/5, phoshorylated SMAD1/phosphorylated SMAD5 (ambiguous detection of phospho-antibody).
Figure 3.
Figure 3.
ZNF423-modified pro-B ALL model. (A) Expression of ZNF423 protein in pro-B ALL model. Immunoblot analysis exhibits ZNF423 expression levels in parental wild-type (WT), retrovirus-driven ZNF423 overexpression (OE), and CRISPR-Cas9–mediated ZNF423 knockout (KO) SEM ALL cells. β-actin was used as loading control. (B) Luciferase (LUC) CD79B-promoter assay upon transfection of 293 cells with EBF1, ZNF423β, or ZNF423β Δ142-145 mutant as indicated. Experiments were performed as technical triplicates. Biological duplicates revealed similar results. All data were presented as mean ± SD. **P < .01. (C) FACS-based apoptosis analysis of WT, ZNF423-OE, and ZNF423-KO pro-B ALL SEM clones at low passage number (n < 5) using annexin-V/propidium iodide (PI) staining. AnnexinV+/PI signals reflect early apoptotic events and annexinV+/PI+ signals reflect late apoptotic events. Experiments were performed as technical triplicates with similar results. (D) Kaplan-Maier analysis of progression-free survival of NSG mice (n = 8 animals per cohort) upon xenotransplantation of 1 × 10⁶ ZNF423-OE, ZNF423-KO, or parental (WT control) pro-B ALL SEM cells. P values were calculated using a log-rank test. P < .05 was defined as significant. (E) FACS-based analysis of CD19 surface expression in B-cell progenitors at days 4 to 6 upon transduction with empty vector (EV) or Zfp423 and maintained in IL-7 culture. (F) Representative FACS profile depicting incorporation of 5-bromo-2′-deoxyuridine (BrdU) into CD19+ B-cell progenitors transduced either with empty vector or Zfp423. Data were acquired after 6 days in IL-7–supplemented culture medium. DNA was stained using Hoechst 33258. APC, allophycocyanin; FSC, forward scatter; n.s., not significant.
Figure 4.
Figure 4.
Genome-wide binding pattern of EBF1 and ZNF423 in pro-B ALL. (A) Chromatin immunoprecipitation (ChIP) followed by deep sequencing (ChIP-seq) of EBF1 vs ZNF423 in ZNF423-OE cells compared with EBF1 in ZNF423-KO cells. Representative ChIP-seq tracks of EBF1 and ZNF423 enrichment at CD79A and CD79B promoters are presented. Chromatin input was used as negative control. Images were created using Integrative Genomics Viewer (Broad Institute, Cambridge, MA). CD79A is situated on a positive strand and CD79B on a negative strand, as indicated by arrows. ChIP-seq was performed in technical duplicates. (B) Feature distribution of called EBF1 and ZNF423 peaks under enforced ZNF423 expression (ZNF423-OE) compared with EBF1 peaks upon ZNF423 ablation (ZNF423-KO). (C) Venn diagram of ChIP-seq identified frequencies of exclusive and overlapping EBF1 peaks in WT-SEM cells or upon enforced ZNF423 expression vs ZNF423-KO. (D) Venn diagram of overlapping and unique EBF1 and ZNF423 peaks at promoter regions (–2 kb to +1 kb from TSS) in SEM ZNF423-OE cells. (E) Motif search analysis for identification of most frequently represented binding sequences from EBF1 ChIP-seq data. Promoter peaks were analyzed using HOMER. Discovered motif is illustrated as multilevel consensus sequences showing conserved base letter. Table below lists –log P-value-ranked representation of TF motifs. (F) Motif search analysis from ZNF423 ChIP-seq data analogous to that in panel E.
Figure 5.
Figure 5.
ZNF423 modulates chromatin landscape in pro-B ALL. (A) Meta-analysis depicting the enrichment of histone ChIP-seq reads in the vicinity (± 2.5 kb) of EBF1 (left panel) and ZNF423 (right panel) peaks designated as summit. Distinct histone marks under ZNF423-OE vs ZNF423-KO condition are color coded and presented as mean RPM (reads per million mapped reads) per base pair. (B) Heatmaps showing the genome-wide abundance of enriched activating histone modifications (H3K4me3 and H3K27ac), depending on ZNF423 expression status (KO vs OE). TES, transcription end site. Color bar represents level of abundance of histone mark (blue, low abundance; red, high abundance).
Figure 6.
Figure 6.
ZNF423 is linked to repressed B-lymphopoietic and activated nonhematopoietic transcriptional circuitries. (A) Unsupervised cluster analysis of differentially regulated EBF1-bound genes that are dependent on ZNF423 (parental, ZNF423-OE, ZNF423-KO) depicted as heatmap. Relative expression levels of DEGs are presented as Z-score according to the color bar. (B) Gene Ontology (GO) analysis of ZNF423-dependent downregulated (blue) and upregulated EBF1 targets from panel A. (C) ChIP-X enrichment analysis (ChEA) of ZNF423-dependent EBF1 targets. Overrepresented transcription factors are displayed as decreasing –log P values and color coded according to cell lineage differentiation. Upper section: ZNF423-dependent downregulated transcriptional targets; lower section: ZNF423-dependent upregulated transcriptional targets. (D) Unsupervised cluster analysis of ZNF423-dependent EBF1 targets from panel A and murine orthologs from primary Ebf1−/− vs Ebf1−/−::Ebf1 B-progenitor cells (GSE21455) concordantly regulated in both data sets. Both data sets were z score standardized. Species-related clusters were color coded.
Figure 7.
Figure 7.
Co-regulation of TGFB1 by SMAD, EBF1, and ZNF423. (A) Enrichment of ZNF423 and EBF1 at the TGFB1 locus presented as ChIP-seq tracks with overexpression of ZNF423. Tracks of activating histone marks H3K4me3 and H3K27ac were included. ChIP-seq input is depicted as a control. Solid arrowheads (green) at the bottom of schematic gene locus highlight SMAD1 enrichment sites (ENCODE experiment using K562 leukemia cells; ENCSR038DJJ). (B) EBF1-dependent transactivation of TGFB1 promoter is repressed by ZNF423 as shown by luciferase reporter assay in 293T cells. Left panel: titration of increasing concentrations of ZNF423 at constant EBF1. **P < .002; ***P ≤ .0001; 2-tailed Student t test. Right panel: reverse experiment showing titration of increasing concentrations of EBF1 at constant ZNF423. Empty vector was used as a control. LUC-fold, luciferase fold-induction. Cloned TGFB1 promoter construct comprises −550 to 0 bp in relation to TSS. Each experiment was independently replicated at least 3 times. ***P = .0006; 2-tailed Student t test. (C) Mutagenesis analysis of EBF1 and ZNF423 and/or SMAD1/SMAD4 binding sites in cloned TGFB1 promoter in 293T cells using luciferase reporter assay. Consensus sites for EBF1 (–105 bp) and SMAD1 (–244 bp) are given in bold and mutated as indicated by red base letters. Solid color boxes denote mutated motifs; shaded boxes correspond to wild-type sequences. Each experiment was replicated at least 3 times. ***P ≤ .0007; **P = .0045; 2-tailed Student t test. (D) Transactivation of TGFB1 upon ZNF423 mutagenesis in transfected 293T cells using luciferase reporter assay. EBF1 was co-transfected with ZNF423-WT and various ZNF423 deletion mutants, as illustrated by schematic protein domain structure of ZNF423 shown at the bottom of the panel. Each experiment was independently replicated at least 3 times. NID, nucleosome remodeling and deacetylase (NuRD) complex interacting domain; DBD, DNA-binding domain; PBD, protein binding domain. ***P ≤ .0008; **P ≤ .0072; *P = .0171; 2-tailed Student t test. (E) Quantitative RT-PCR (qRT-PCR) analysis of Tgfb1 and Tgfbr2 mRNA in B-cell progenitors transduced either with empty vector or Zfp423 and maintained in IL-7–supplemented media. RNA was collected from sorted progenitors (B220+CD19+EYFP+) at day 7. (F) qRT-PCR analysis of Cdkn1a, Cdkn1b, and Cdkn2b transcripts in B-cell progenitors transduced either with empty vector or Zfp423 and cultivated in IL-7 media. At day 4 of culture, transduced progenitors were treated with recombinant mouse Tgfb1 at 10 ng/mL or control media for 3 additional days. RNA was collected from sorted progenitors (B220+CD19+EYFP+) at day 7. Experiments were performed in biological quadruples with similar results. All data are presented as mean ± SD.

Similar articles

Cited by

References

    1. Demarest RM, Dahmane N, Capobianco AJ. Notch is oncogenic dominant in T-cell acute lymphoblastic leukemia. Blood. 2011;117(10):2901-2909. - PMC - PubMed
    1. Kuiper RP, Schoenmakers EF, van Reijmersdal SV, et al. . High-resolution genomic profiling of childhood ALL reveals novel recurrent genetic lesions affecting pathways involved in lymphocyte differentiation and cell cycle progression. Leukemia. 2007;21(6):1258-1266. - PubMed
    1. Mullighan CG, Goorha S, Radtke I, et al. . Genome-wide analysis of genetic alterations in acute lymphoblastic leukaemia. Nature. 2007;446(7137):758-764. - PubMed
    1. Mandel EM, Grosschedl R. Transcription control of early B cell differentiation. Curr Opin Immunol. 2010;22(2):161-167. - PubMed
    1. Parra M. Epigenetic events during B lymphocyte development. Epigenetics. 2009;4(7):462-468. - PubMed

Publication types