SGK1 inhibition in glia ameliorates pathologies and symptoms in Parkinson disease animal models
- PMID: 33646633
- PMCID: PMC8033538
- DOI: 10.15252/emmm.202013076
SGK1 inhibition in glia ameliorates pathologies and symptoms in Parkinson disease animal models
Erratum in
-
Author Correction: SGK1 inhibition in glia ameliorates pathologies and symptoms in Parkinson disease animal models.EMBO Mol Med. 2025 Sep;17(9):2525-2529. doi: 10.1038/s44321-025-00270-y. EMBO Mol Med. 2025. PMID: 40790103 Free PMC article.
Abstract
Astrocytes and microglia are brain-resident glia that can establish harmful inflammatory environments in disease contexts and thereby contribute to the progression of neuronal loss in neurodegenerative disorders. Correcting the diseased properties of glia is therefore an appealing strategy for treating brain diseases. Previous studies have shown that serum/ glucocorticoid related kinase 1 (SGK1) is upregulated in the brains of patients with various neurodegenerative disorders, suggesting its involvement in the pathogenesis of those diseases. In this study, we show that inhibiting glial SGK1 corrects the pro-inflammatory properties of glia by suppressing the intracellular NFκB-, NLRP3-inflammasome-, and CGAS-STING-mediated inflammatory pathways. Furthermore, SGK1 inhibition potentiated glial activity to scavenge glutamate toxicity and prevented glial cell senescence and mitochondrial damage, which have recently been reported as critical pathologic features of and therapeutic targets in Parkinson disease (PD) and Alzheimer disease (AD). Along with those anti-inflammatory/neurotrophic functions, silencing and pharmacological inhibition of SGK1 protected midbrain dopamine neurons from degeneration and cured pathologic synuclein alpha (SNCA) aggregation and PD-associated behavioral deficits in multiple in vitro and in vivo PD models. Collectively, these findings suggest that SGK1 inhibition could be a useful strategy for treating PD and other neurodegenerative disorders that share the common pathology of glia-mediated neuroinflammation.
Keywords: Parkinson’s disease; glia; neuroinflammation; serum/glucocorticoid related kinase 1; synuclein alpha.
© 2021 The Authors. Published under the terms of the CC BY 4.0 license.
Conflict of interest statement
The authors declare that they have no conflict of interest.
Figures
- A–D
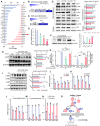
Nurr1 (N) and Foxa2 (F) synergistically downregulate SGK1 expression in cultured glia. (A) Up‐ and downregulated genes in the microarray data for the cultured glia transduced with N + F (vs. mock‐transduced control). Sgk1 is marked with an arrow in the top downregulated genes. (B–D) Effect of N and F on SGK1 expression in glial cells shown in the microarray (B), RNA‐seq (C), and RT–PCR (D) analyses. Data in (B and C) represent values of fold change (FC) or read count (RC) with color intensities. n = 3. One‐way ANOVA. Data are represented as mean ± SEM. Significantly different at P = 0.0493*, 0.0092**, 0.0009***.
- E–I
Downregulation of SGK1 is responsible for N + F function to inhibit NFκB‐mediated pro‐inflammatory cytokine expression. (E) WB analysis exhibiting N + F‐induced inhibition of NFκB intracellular signaling in cultured VM‐glia. The N + F‐mediated downregulation of NFκB signaling is attained by inhibiting IκB phosphorylation (E) and thus blocking the release of NFκB from the NFκB‐IκB inhibitory complex (F). Data are represented as mean ± SEM. n = 3 independent experiments; one‐way ANOVA with Tukey‐analysis. P = 0.015#, 0.002##, 1.33E‐12### (sgk1), 0.036#, 0.00004## (p‐IKKB). 0.00007### (p‐IkBα). 0.005#, 2.11E‐09### (p‐p65). 1.93E‐06### (p65 level in nucleus) in graph E. P = 6.44E‐09*, 0.00004**, 4.45E‐10*** in graph F. (G and H) N + F‐mediated downregulation of NFκB signaling (phosphorylation of p65, p‐p65, G) and pro‐inflammatory cytokine expression (IL‐1β, TNFα, H) were alleviated by forced SGK1 expression in the VM‐glial cultures. Data are represented as mean ± SEM. n = 3 independent cultures; two‐way ANOVA with Bonferroni post hoc analysis. Significantly different at P = 0.014#, 0.009*, 0.009**, 0.003+ (p‐p65) in graph G and P = 1.79E‐06*, 0.0003**, 0.004***, 0.0068#, 0.0392##, 0.0027### in graph H. (I) SGK1 inhibition blocks glial NFκB signaling. Data are represented as mean ± SEM. n = 4–6. One‐way ANOVA. Significantly different at P = 0.002*, 0.00004**, 0.00001#, 3.01E‐10##, 3.78E‐06+, 1.59E‐07++ in graph I.
- J–N
Glial pro‐inflammatory cytokine expression regulated by SGK1 inhibition (J–M) and overexpression (N). Data are represented as mean ± SEM. n = 3 independent cultures; unpaired Student’s t‐test. Significantly different at P = 0.0041*, 0.0010#, 0.0010+, 0.0067## in graph J and P = 0.0002*, 0.0345#, 0.0023+, 0.0012**, 0.0001## in graph K and P = 0.0367*, 0.0042+, 0.0003** in graph L and P = 0.0001*, 0.0009#, 0.0002+, 0.0082** in graph M and P = 0.0367*, 0.0059#, 0.0005**, 0.0006## in graph N.
- O
Schematic summary to show how SGK1 inhibition mediates the N + F‐induced anti‐inflammatory action in glia.

- A, B
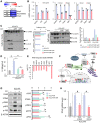
Top gene ontologies (GOs) and KEGG pathways of the genes downregulated in VM‐glia by the SGK1 inhibitor treatment. The purple bar indicates the number of genes under the designated GO term/KEGG pathway. The red bar indicates the p‐value, and the negative log of the p‐value (bottom) is plotted on the X‐axis.
- C
Gene set enrichment analysis (GESA) for inflammatory and immune responses.
- D
Scatterplots for the differentially expressed genes (DEGs) highlighting the inflammatory/immune genes that are most significantly downregulated in the inhibitor‐treated cultures.
- E
Heatmap for selected inflammatory genes in the SGK1 inhibitor‐treated and inhibitor‐untreated glial cultures. Data represent the RC values (inside box) and log2 [SGK1 inhibitor‐treated/control] (color intensity).
- F
Microglia and astrocyte reactivation‐specific marker expressions in the RNA‐seq data.
- A, B
mRNA expression of the NLRP3‐inflammasome components Nlrp3, Pycard (Asc), and Caspase1. Decreased expression of the components shown in the RNA‐seq (A) was confirmed using qPCR analyses in other independent VM‐glial cultures treated with the inhibitor (GSK‐650394) and sh‐Sgk1 and si‐Sgk1 (vs. DMSO, sh‐control, and si‐control, respectively) (B). n = 3; Student’s t‐test. Data are expressed as mean ± SEM. Significantly different at P = 0.0018*, 0.0405**, 0.0039***, 0.0002#, 0.0033##, 0.0099###, 0.0001####, 0.0056+, 0.0398++, 0.0067+++ in graph B.
- C
Immunoblot analysis to assess NLRP3 inflammasome activation. To activate the inflammasome pathway, VM‐derived glial cells were treated with LPS (0.25 µg/ml, 3 h) and then ATP (2.5 mM, 30 min) in the presence or absence of the SGK1 inhibitor GSK‐650394. Two days later, intracellular and released levels of pro‐ and activated caspase‐1 and IL‐1β proteins were determined in the culture media and cell lysates, respectively.
- D
Released level of IL‐1β (activated) was further quantified using ELISA. n = 3; ANOVA. Significantly different at p = 0.0002#, 0.0012*, 0.0004** in graph D.
- E, F
Expression of CGAS‐STING pathway genes in the RNA‐seq data. The graph represents log2 RC ratios of [GSK‐650394‐treated/DMSO‐treated control]. The molecules downregulated by the SGK1 inhibitor are marked with arrows in the CGAS‐STING signal pathway schematized in F.
- G
WB analysis demonstrating suppression of CGAS‐STING signaling by the SGK1 inhibitor in VM‐glial cultures. Representative blots are shown on the left. The levels of the active forms of CGAS‐STING signaling molecules are quantified from 5–10 independent blots (right). Data are represented as mean ± SEM. One‐way ANOVA. Significantly different at p = 0.001#, 0.014* (CGAS), 0.00004#, 0.0002* (STING), 0.017#, 0.037* (pTBK1), 0.009#, 0.045* (pIRF3), 0.012#, 0.036* (pP65) in graph G.
- H
Expression of Ifnb mRNA, a final product of the CGAS‐STING pathway, determined by real‐time PCR analyses. Data are represented as mean ± SEM. n = 3; Student’s t‐test. Significantly different at p = 0.0459#, 0.0305* in graph H.
- A, B
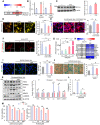
Ppargc1a (PGC1α) mRNA expression upregulated in VM‐glia treated with the SGK1 inhibitors in the RNA‐seq data (A) and qPCR analysis (B). Data are represented as mean ± SEM. n = 3; Student’s t‐test. Significantly different at P = 0.0011#, 0.0499* in graph B.
- C
Immunoblot for PGC1α protein expression. Data are represented as mean ± SEM. n = 3. Student’s t‐test. Significantly different at P = 0.0077* in graph C.
- D
Mitochondrial biogenesis estimated by MitoTimer reporter gene expression in cultured VM‐glia. Green fluorescence indicates newly synthesized mitochondria, and red fluorescence indicates old or damaged mitochondria. MFIs were estimated in three independent cultures (> 5 randomly selected microscopic fields/culture). Data are represented as mean ± SEM. One‐way ANOVA. Significantly different at P = 3.78E‐08*, 0.00003** in graph D.
- E
Mitochondrial ROS levels estimated using the MitoSox red probe. Fluorescence intensity was measured using ImageJ, and ROS levels are presented as mean fluorescent intensity (MFI). Mitochondrial damage was induced by treatment with the mitochondrial toxins CCCP (2 µM) + H2O2 (500 µM) for 4 h. MFIs were estimated in three independent cultures (> 5 randomly selected microscopic fields/culture). Data are represented as mean ± SEM. One‐way ANOVA. Significantly different at P = 0.0013*, 0.0273# in graph E.
- F
Mitochondrial membrane potential (JC‐1). The red fluorescence (JC‐1 Aggregate) indicates disrupted mitochondrial membrane potential, and green fluorescence (JC‐1 Monomer, insets) indicates intact potential. The inset images were taken from the same microscopic fields of the respective JC‐1 aggregate images. Mitochondrial damage was induced by treatment with the mitochondrial toxins CCCP (2 µM) + H2O2 (500 µM) for 4 h. MFIs were estimated in three independent cultures (> 5 randomly selected microscopic fields/culture). Data are represented as mean ± SEM. One‐way ANOVA. Significantly different at P = 0.0006*, 0.0093# in graph F.
- G
Intracellular levels of ATP, an indicator of mitochondrial oxidative phosphorylation. Data are expressed as mean ± SEM. n = 3 cultures; one‐way ANOVA. Significantly different at P = 0.0009*, 0.00004**, 0.04913#, 0.0024+ in graph G.
- H–M
Glial cell senescence rescued by SGK1 inhibition. (H) Expression of genes associated with cell senescence in the RNA‐seq data (VM‐glia with vs. without GSK‐650394 treatment). (I) Intracellular ROS levels estimated by DCF‐DA. Data are represented as mean ± SEM. n = 3; one‐way ANOVA. Significantly different at P = 0.0074*, 0.012# in graph I. (J) Senescence‐associated β‐galactosidase (SA‐β‐gal) activity. Data are represented as mean ± SEM. n = 3; one‐way ANOVA. Significantly different at P = 2.05E‐06*, 0.0042#, 0.0006+ in graph J. (K) Immunoblots for proteins associated with cell senescence. Significantly different at P = 0.008*, 0.001# (TNFA), 0.01*, 0.009# (HMGB1), 7.32E‐10*, 1.23E‐8# (IL6), 9.62E‐11*, 1.01E‐5# (MMP3), 0.001*, 5.72E‐4# (LAMIN B) in graph K. (L) IL‐6 levels secreted from cultured VM‐glia. The cytokine levels were estimated using ELISA of the media from the VM‐glia with and without the SGK1 inhibitor. Data are represented as mean ± SEM. n = 3 cultures. One‐way ANOVA. Significantly different at P = 0.0028*, 0.0062# in graph L. (M) Glial cell viability following treatment with senolytic compounds (azithromycin, fisetin). Data are represented as mean ± SEM. n = 3; Student’s t‐test. Significantly different at P = 0.0073*, 0.0018**, 0.0286#, 0.0269##, 0.0045### in graph M.
- A
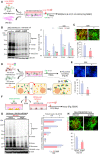
Schematic of the experimental procedure in (B and C).
- B
Western blot analysis for detecting SNCA oligomers. Data are represented as mean ± SEM. n = 4; one‐way ANOVA. Significantly different at P = 2.5E‐07*, 1.65E‐07**, 0.022#, 0.029##, 0.046+, 0.015++, 0.0136&, 0.0016&& in graph B.
- C
Immunocytochemical detection of p‐129‐SNCA, associated with SNCA aggregation. Data are represented as mean ± SEM. n = 6. Significantly different at P = 0.0363* in graph C.
- D, E
Bi‐FC‐based assessment of the inter‐neuronal propagation and aggregation of SNCA. (D) Schematic of the experimental procedures with Bi‐FC system. Bi‐FC+ inclusions (puncta) were counted in (E). Data are represented as mean ± SEM. n = 5. Significantly different at P = 0.0446* in graph E.
- F–H
Glial SGK1 knockdown effect on neuronal SNCA pathology. (F), Schematic of the experimental procedure in (G, H). VM‐glial cultures were transduced with sh‐Sgk1 (or sh‐cont) lentivirus. Medium was condition in sh‐Sgk1‐glia (or sh‐cont‐glia), and the conditioned medium (CM) treatment effects on neuronal SNCA aggregation were assessed by WB (G) and p‐129‐SNCA immunocytochemical (H) analyses. Data are represented as mean ± SEM. n = 3. Significantly different at P = 0.00003*, 0.0003**, 0.0012***, 0.00004****, 0.0321# in graph G and P = 0.0052* in graph H.
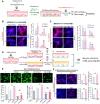
- A–C
Co‐culture experiments. (A) Schematic for the experimental procedure. Glia derived from mouse VM were transduced with sh‐Sgk1 (B) or SGK1 (CMV‐Sgk1, C), and co‐cultured with VM‐derived mDA neurons. Seven days after co‐culture, cells were exposed to H2O2 (500 µM, 3 h) or not (−), and then mDA neuron viability (TH+ cell counts) and neurite degeneration (TH+ fiber lengths) were estimated. Data are represented as mean ± SEM; n = 4 culture coverslips. Student’s t‐test. Significantly different at P = 0.033*, 0.0412**, 7.44E‐23#, 1.39E‐23## in graph B and P = 0.0489*, 0.0366**, 0.0078## in graph C.
- D, E
Glial neurotrophic functions potentiated by SGK1 downregulation were mediated in a paracrine manner. VM‐glia transduced with sh‐Sgk1 (or sh‐cont as a control) were challenged with H2O2 + LPS for 3 h or not. Glial conditioned medium (GCM) was prepared in each glial culture condition and administered to mDA neurons primarily cultured from mouse VM (D). (E) Cell viability of the neuronal cells was estimated using CCK8 assays and TuJ1+ cell counts. Data are represented as mean ± SEM. n = 3 cultures; one‐way ANOVA. Significantly different at P = 0.0002*, 3.29E‐08**, 0.0003***, 3.66E‐06#, 0.0029## (TuJ1+ cell counting), 0.0127+, 5.98E‐06++, 0.0002+++, 0.0005&, 0.0078&& (CCK8 assays) in graph E.
- F
Effect of the SGK1 inhibitor treatment in the mixed mDA neuron + VM‐glia co‐cultures. Data are represented as mean ± SEM. n = 3. Student’s t‐test. Significantly different at P = 0.0068*, 0.0368**, 0.0249#, 1.48E‐27## in graph F.
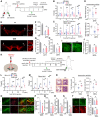
- A–J
Effect of treatment with the SGK1 inhibitor GSK‐650394 in the MPTP‐PD mouse model. (A) Overview of the experimental procedure. (B–D) Behaviors of MPTP‐PD mice assessed by pole (B), beam (C) at 3–6 weeks post‐MPTP injection, and locomotor activity (total distance & average speed, D) tests at 6 weeks post‐MPTP injection. n = 20 GSK‐650394‐treated MPTP‐PD mice, 14 vehicle‐treated MPTP‐PD mice, and 8 MPTP‐untreated non‐PD mice. Data are represented as mean ± SEM. Significantly different at P = 0.0012#, 0.0001*, 3.09E‐08##, 8.21E‐08** in graph B and P = 0.0009#, 0.0035*, 1.03E‐06##, 0.00003** in graph C and P = 0.0001*, 0.0284**, 0.0101# (total distance), 1.49E‐08*, 0.0005**, 0.0001# (average speed) in graph D. Histologic assessment of the number of TH+ mDA neurons (E, F), neurite lengths (E, G), and cell body sizes (E, H) of the mDA neurons in the SN and TH+ fiber intensities in the striatum (I, J). Shown in (E and I) are the representative images for TH+ DA neurons in the SN and TH‐immunoreactivity in the striatum, respectively. TH+ DA neurons in boxed areas of (E) are enlarged in right. Data are represented as mean ± SEM. n = 3–4 mice per group. Significantly different at P = 7.09E‐09#, 0.0001##, 0.0162* in graph F and P = 5.09E‐09#, 5.10E‐09##, 6.66E‐09* in graph G and P = 4.89E‐08#, 0.0001##, 0.0152* in graph H and 5.10E‐09#, 0.0128##, 0.0001* in graph J.
- K–U
Therapeutic effects of GSK‐650394 in SNCA‐PD model mice. Behaviors (L–N) and mDA neuron degeneration in the SN (O–U) of the SNCA‐PD mice were assessed at 6–12 (L, M) and 12 weeks post‐SNCA injection before (N) and after sacrifice (O–U). Significantly different at P = 0.008#, 0.021*, 0.00001##, 0.0009** in graph L and P = 0.00002#, 0.0344*, 0.0005##, 0.0067** in graph M and P = 0.0057#, 0.0345* (total distance), 0.0001#, 0.0375##, 0.0338* (average speed) in graph N. (P) SNCA pathology assessed by p129‐α‐syn immunoreactivity in TH + mDA neurons in the SN. Significantly different at P = 0.019* in graph P and P = 0.0001#, 0.0009##, 0.032* in graph Q and P = 5.1E‐09#, 5.1E‐09##, 0.0001* in graph R and P = 5.1E‐09#, 5.1E‐09##, 0.0005* in graph S and P = 5.1E‐09#, 7.83E‐09##, 0.0025* (TH), 0.0006#, 0.0062##, 0.041* (DAT) in graph U. n = 5 GSK‐650394‐treated SNCA‐PD mice, 5 vehicle‐treated SNCA‐PD mice, and 8 SNCA‐untreated non‐PD mice.

- A, B
Efficiency of AAV9‐mediated gene delivery. AAV9 viruses expressing the reporter GFP gene were stereotaxically injected into the SN of mice, and GFP expression in astrocytes, microglia, and neuronal cells was quantified. Data are represented as mean ± SEM. n = 3 mice (> 5 randomly selected microscopic fields per animal were counted). Significantly different at P = 0.006*, 5.1E‐09#, 5.36E‐09+ in graph B.
- C–O
Therapeutic effects of intra‐SN injection of sh‐Sgk1 AAV9 in SNCA‐PD mouse model. (C) Schematic of the experimental procedure. (D and E) SGK1 knockdown effect in vivo by treatment with shSgk1‐AAV9. Total SGK1 mRNA levels were estimated in the midbrain SN of the PD mice injected with shSgk1 (sh‐Control as control) AAV9 using real‐time PCR (D). Cell type‐specific SGK1 knockdown was estimated by counting SGK1‐immuonoreactivity in neuron (MAP2+), astrocyte (GFAP+), and microglia (Iba1+) populations (E). Data are represented as mean ± SEM. n = 4 mice in each group. Significantly different at P = 0.0004# in graph D and P = 0.049*, 0.007**, 0.002*** in graph E. (F–H) Behavior of the PD mice assessed by pole (F), beam (G) at 6–12 weeks, and locomotor activity (H) tests at 12 weeks post‐SNCA injection. Significantly different at P = 0.0003#, 0.0428*, 7.46E‐06##, 0.0012** in graph F and P = 8.04E‐08#, 0.004*, 1.62E‐09##, 3.3E‐06** in graph G and P = 0.0002#, 0.0194* (total distance), 9.54E‐06#, 0.0047* (average speed) in graph H. (I–O) Histologic assessment of p129‐SNCA immunoreactivity (I, J), TH+ mDA neuron counts (I, K), neurite lengths (L), and cell body sizes (M) in the SN and TH+ and DA transporter (DAT) fiber intensities in the striatum (N, O). Significantly different at P = 0.0001* in graph J, P = 2.35E‐25#, 1.09E‐16##, 4.36E‐08* in graph K and P = 1.5E‐40#, 1.08E‐24##, 2.32E‐07* in graph L and P = 9.07E‐20#, 2.59E‐16##, 0.05* in graph M and P = 4.62E‐22#, 5.11E‐12##, 3.49E‐06* (TH), 1.58E‐22#, 8.13E‐09##, 7.42E‐09* in graph O. n = 7 sh‐SGK1‐AAV9‐treated PD mice, 7 sh‐cont‐AAV9‐treated PD mice, and 8 SNCA‐untreated mice. Data are represented as mean ± SEM. One‐way ANOVA. Scale bar, 100 µm.

- A–C
Quantitative and morphometric analyses of microglia in the SN area of SNCA‐PD mice. Shown in (A) are representative views of Iba1+ microglia neighboring TH+ mDA neurons in the SNs of PD mice treated with GSK‐650394 and vehicle. Insets, enlarged views for the boxed areas. Data are represented as mean ± SEM. n = 3 mice per group. Significantly different at P = 1.49E‐11* in graph B and P = 0.000003* in graph C.
- D, E
The M1 marker CD16/32 expression in Iba1+ microglia. Data are represented as mean ± SEM. n = 3 mice per group. Significantly different at P = 0.0016* in graph E.
- F, G
mRNA expression of NLRP3‐inflammasome components and pro‐inflammatory cytokines in MPTP (F) and SNCA (G) PD mice injected with the SGK1 inhibitor or vehicle (control). Each bar represents the mean ± SEM of 3 PCR values from each animal, n = 3 mice per group. Significantly different at P = 0.0372*, 0.0173**, 0.0003*** in graph F and P = 0.002#, 0.0113##, 0.0053###, 0.0001#### in graph G.
- H–J
ASC expression in the SNs and SN microglia of SNCA‐PD mice. n = 5 mice per group. Data are represented as mean ± SEM. Significantly different at P = 1.91E‐09* in graph I and P = 0.0079* in graph J.
- K, L
β‐gal‐stained cell senescence in SNCA‐PD mouse SN. Data are represented as mean ± SEM. n = 5 mice per group. Significantly different at P = 0.0001*.
References
-
- Ackermann TF, Boini KM, Beier N, Scholz W, Fuchss T, Lang F (2011) EMD638683, a novel SGK inhibitor with antihypertensive potency. Cell Physiol Biochem 28: 137–146 - PubMed
-
- Afonina IS, Zhong Z, Karin M, Beyaert R (2017) Limiting inflammation‐the negative regulation of NF‐kappaB and the NLRP3 inflammasome. Nat Immunol 18: 861–869 - PubMed
-
- Anderson JP, Walker DE, Goldstein JM, de Laat R, Banducci K, Caccavello RJ, Barbour R, Huang J, Kling K, Lee M et al (2006) Phosphorylation of Ser‐129 is the dominant pathological modification of alpha‐synuclein in familial and sporadic Lewy body disease. J Biol Chem 281: 29739–29752 - PubMed
-
- Baba Y, Kuroiwa A, Uitti RJ, Wszolek ZK, Yamada T (2005) Alterations of T‐lymphocyte populations in Parkinson disease. Parkinsonism Relat Disord 11: 493–498 - PubMed
Publication types
MeSH terms
Substances
Associated data
- Actions
- Actions
LinkOut - more resources
Full Text Sources
Other Literature Sources
Medical
Molecular Biology Databases
Research Materials
Miscellaneous

