Meta-Analysis
. 2021 Feb 26:10:e58430.
doi: 10.7554/eLife.58430.

DNA methylation meta-analysis reveals cellular alterations in psychosis and markers of treatment-resistant schizophrenia

Affiliations
Meta-Analysis

DNA methylation meta-analysis reveals cellular alterations in psychosis and markers of treatment-resistant schizophrenia

Eilis Hannon et al. Elife. .

Abstract

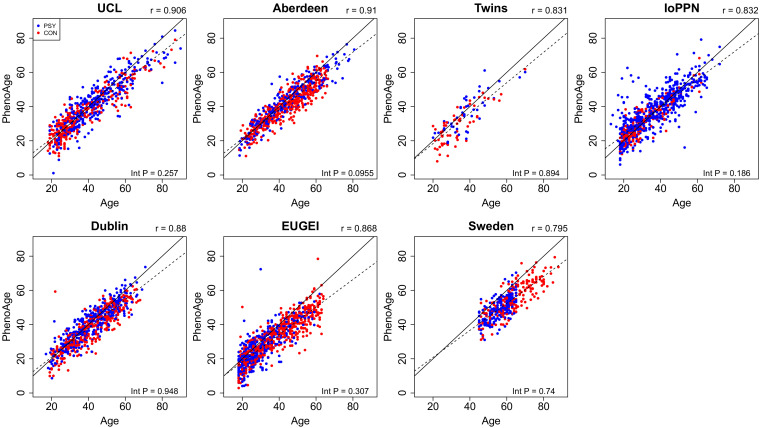
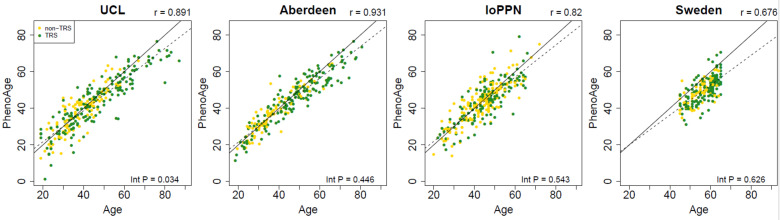
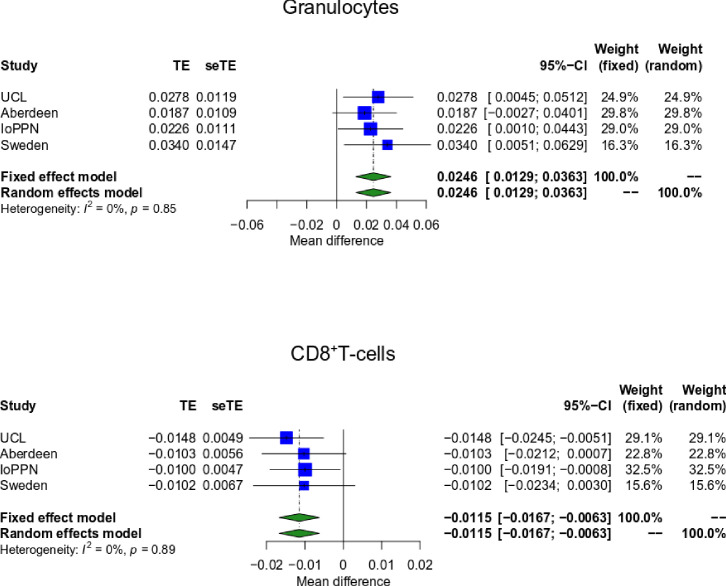
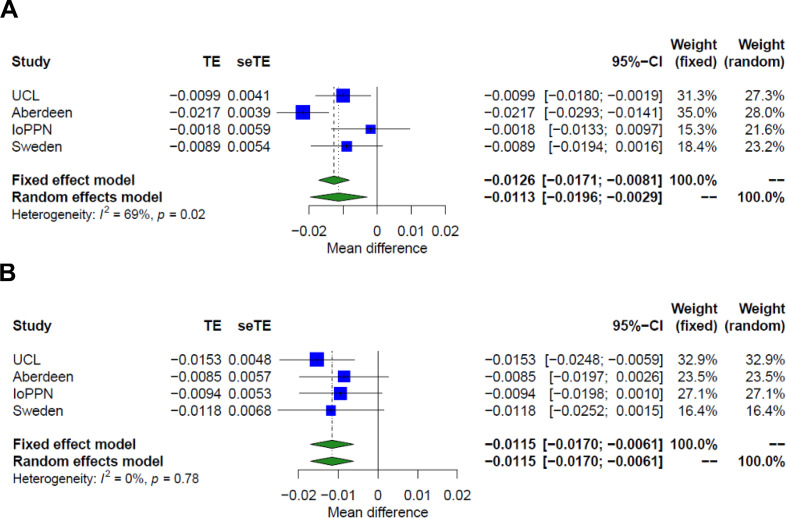
We performed a systematic analysis of blood DNA methylation profiles from 4483 participants from seven independent cohorts identifying differentially methylated positions (DMPs) associated with psychosis, schizophrenia, and treatment-resistant schizophrenia. Psychosis cases were characterized by significant differences in measures of blood cell proportions and elevated smoking exposure derived from the DNA methylation data, with the largest differences seen in treatment-resistant schizophrenia patients. We implemented a stringent pipeline to meta-analyze epigenome-wide association study (EWAS) results across datasets, identifying 95 DMPs associated with psychosis and 1048 DMPs associated with schizophrenia, with evidence of colocalization to regions nominated by genetic association studies of disease. Many schizophrenia-associated DNA methylation differences were only present in patients with treatment-resistant schizophrenia, potentially reflecting exposure to the atypical antipsychotic clozapine. Our results highlight how DNA methylation data can be leveraged to identify physiological (e.g., differential cell counts) and environmental (e.g., smoking) factors associated with psychosis and molecular biomarkers of treatment-resistant schizophrenia.

Keywords: DNA methylation; clozapine; epigenetics; genetics; genomics; human; psychosis; schizophrenia.


Conflict of interest statement

EH, ED, GM, JB, NB, MB, AC, CC, DD, TD, GD, MG, AG, CG, HH, CH, VJ, RK, JK, GK, CM, AM, DM, KM, CM, IN, DQ, AR, BR, DS, ST, TT, JV, JW, EV, GB, LS, JM No competing interests declared, MD M Di Forti reports personal fees from Janssen, outside the submitted work. FG Fiona Gaughran has received honoraria from Lundbeck, Otsuka, and Sunovion. She has a family member with professional links to Lilly and GSK, including shares. KK Kaarina Kowalec has consulted with Emerald Lake Safety Ltd. (2017-2018) and has received speaker honoraria from Biogen/Fraser Health Multiple Sclerosis Clinic (2018). Both are unrelated to the work published here. JM James MacCabe has received research funding from H Lundbeck. MO Michael C O'Donovan is supported by a collaborative research grant from Takeda Pharmaceuticals. Takeda played no part in the conception, design, implementation, or interpretation of this study. PS PF Sullivan reports the following potentially competing financial interests. Current: Lundbeck (advisory committee, grant recipient). Past three years: Pfizer (scientific advisory board). DC David A Collier is a full time employee and stockholder of Eli Lilly and Company. RM Robin M Murray reports personal fees from Janssen, Lundbeck, Sunovion, Recordati and Otsuka

Figures

Figure 1.
Figure 1.. Overview of the sample cohorts and analytical approaches used in this study of altered DNA methylation in psychosis and schizophrenia.
Figure 1—figure supplement 1.
Figure 1—figure supplement 1.. Forest plot showing the difference in mean age between psychosis cases and controls across each cohort.
TE: treatment effect (i.e., the mean difference between cases and controls); seTE: standard error of the treatment effect.
Figure 1—figure supplement 2.
Figure 1—figure supplement 2.. Scatterplot of the relationship between the first two genetic principal components merged with HapMap phase 3 data for individual cohorts.
With the exception of the IoPPN and EUGEI cohorts, there is little ethnic heterogeneity in each of the cohorts with samples being predominantly of Caucasian origin.
Figure 1—figure supplement 3.
Figure 1—figure supplement 3.. Scatterplots of DNAmAge derived from the DNA methylation data against actual chronological age for each of the cohorts.
DNAmAge was calculated using the algorithm described by Horvath, 2013. Each point represents an individual and is colored by psychosis status (blue = psychosis, red = control). The solid diagonal line depicts x=y, that is, where the estimated and actual values are the same. The dashed diagonal line depicts the line of best fit. Presented at the top of the graph is the Pearson’s correlation coefficient (r) between the estimated and actual age across all samples in that cohort. Also shown in the bottom right-hand corner of each panel is an interaction p-value from a test for different correlations between DNAmAge and actual age between psychosis cases and controls.
Figure 1—figure supplement 4.
Figure 1—figure supplement 4.. Scatterplots of PhenoAge derived from DNA methylation data against actual chronological age for each of the cohorts.
PhenoAge was calculated using the algorithm described by Levine et al., 2018. Each point represents an individual and is colored by psychosis status (blue = psychosis, red = control). The solid diagonal line depicts x=y, that is, where the estimated and actual values are the same. The dashed diagonal line depicts the line of best fit. Presented at the top of the graph is the Pearson’s correlation coefficient (r) between the estimated and actual age across all samples in that cohort. Also shown in the bottom right-hand corner of each panel is an interaction p-value from a test for different correlations between PhenoAge and actual age between psychosis cases and controls.
Figure 1—figure supplement 5.
Figure 1—figure supplement 5.. Scatterplots of DNAmAge derived from the DNA methylation data against actual chronological age for each of the cohorts.
DNAmAge was calculated using the algorithm described by Horvath, 2013. Each point represents an individual and is colored by medication status (yellow = schizophrenia cases not prescribed clozapine, green = treatment-resistant schizophrenia cases prescribed clozapine). The solid diagonal line depicts x=y, that is, where the estimated and actual values are the same. The dashed diagonal line depicts the line of best fit. Presented at the top of the graph is the Pearson’s correlation coefficient (r) between the estimated and actual age across all samples in that cohort. Also shown in the bottom right-hand corner of each panel is an interaction p-value from a test for different correlations between DNAmAge and actual age for schizophrenia patients prescribed clozapine and schizophrenia patients prescribed alternative medications.
Figure 1—figure supplement 6.
Figure 1—figure supplement 6.. Scatterplots of PhenoAge derived from the DNA methylation data against actual chronological age for each of the cohorts.
PhenoAge was calculated using the algorithm described by Levine et al., 2018. Each point represents an individual and is colored by schizophrenia status (yellow = schizophrenia cases not prescribed clozapine, green = treatment-resistant schizophrenia cases prescribed clozapine). The solid diagonal line depicts x=y, that is, where the estimated and actual values are the same. The dashed diagonal line depicts the line of best fit. Presented at the top of the graph is the Pearson’s correlation coefficient (r) between the estimated and actual age across all samples in that cohort. Also shown in the bottom right-hand corner of each panel is an interaction p-value from a test for different correlations between PhenoAge and actual age for schizophrenia patients prescribed clozapine and schizophrenia patients prescribed alternative medications.
Figure 2.
Figure 2.. Blood cell-type proportions derived from DNA methylation data are altered in psychosis.
Shown are forest plots from meta-analyses of differences in blood cell proportions derived from DNA methylation data between psychosis patients and controls for (A) monocytes, (B) granulocytes, (C) natural killer cells, (D) CD4+ T-cells, and (E) CD8+ T-cells. TE: treatment effect (i.e., the mean difference between cases and controls); seTE: standard error of the treatment effect.
Figure 2—figure supplement 1.
Figure 2—figure supplement 1.. Treatment-resistant schizophrenia patients prescribed clozapine are characterized by altered blood cell proportions.
Shown are forest plots from meta-analyses of differences in estimated blood cell proportions derived from DNA methylation data between treatment-resistant schizophrenia patients prescribed clozapine and schizophrenia patients prescribed other medications for granulocytes, CD8+ T-cells. TE: treatment effect (i.e., the mean difference between cases and controls); seTE: standard error of the treatment effect.
Figure 2—figure supplement 2.
Figure 2—figure supplement 2.. Additive effect of schizophrenia and treatment resistance on granulocyte proportions.
Shown are forest plots from meta-analyses of differences in estimated granulocyte proportions derived from DNA methylation data between (A) schizophrenia patients and controls and (B) treatment-resistant schizophrenia patients prescribed clozapine, and schizophrenia patients prescribed other medications. TE: treatment effect (i.e., the mean difference between cases and controls); seTE: standard error of the treatment effect.
Figure 2—figure supplement 3.
Figure 2—figure supplement 3.. Additive effect of schizophrenia and treatment resistance on CD8+ T-cell proportions.
Shown are forest plots from meta-analyses of differences in estimated granulocyte proportions derived from DNA methylation data between (A) schizophrenia patients and controls and (B) treatment-resistant schizophrenia patients prescribed clozapine and schizophrenia patients prescribed other medications. TE: treatment effect (i.e., the mean difference between cases and controls); seTE: standard error of the treatment effect.
Figure 3.
Figure 3.. Smoking scores derived from DNA methylation data highlight that psychosis patients are characterized by an elevated exposure to tobacco smoking.
Forest plot from a meta-analysis of differences in smoking score derived from DNA methylation data between psychosis patients and controls. The smoking score was calculated from DNA methylation data using the method described by Elliott et al., 2014. TE: treatment effect (i.e., the mean difference between cases and controls); seTE: standard error of the treatment effect.
Figure 3—figure supplement 1.
Figure 3—figure supplement 1.. Current and former smokers are characterized by a significantly higher smoking score derived from DNA methylation data than non-smokers.
Shown is the DNA methylation smoking score (y-axis) from individuals in the IoPPN cohort for whom self-reported smoking data was available regarding current (left panel) and former (right panel) smoking behavior. 0 = no, 1 = yes.
Figure 3—figure supplement 2.
Figure 3—figure supplement 2.. Treatment-resistant schizophrenia is associated with significantly higher DNA methylation-derived smoking scores.
Forest plot from meta-analyses of differences in smoking derived from DNA methylation data between treatment-resistant schizophrenia patients prescribed clozapine and schizophrenia patients prescribed other medications. TE: treatment effect (i.e., the mean difference between cases and controls); seTE: standard error of the treatment effect.
Figure 3—figure supplement 3.
Figure 3—figure supplement 3.. Treatment-resistant schizophrenia (TRS) patients show an elevated exposure to tobacco smoking relative to non-TRS and controls in a model testing both schizophrenia diagnosis status and TRS status simultaneously.
(A) Schizophrenia diagnosis was associated with a significant increase in smoking score (mean difference = 3.98; p=2.19×10⁻⁸) with (B) TRS status associated with an additional increase within cases (mean difference = 2.15; p=2.22×10⁻⁷). TE: treatment effect (i.e., the mean difference between cases and controls); seTE: standard error of the treatment effect.
Figure 4.
Figure 4.. Differential DNA methylation at multiple loci across the genome is associated with psychosis and schizophrenia.
Manhattan plots depicting the –log10 p-value from the epigenome-wide association study meta-analysis (y-axis) against genomic location (x-axis). (A) presents results from the analysis comparing psychosis patients and controls, and (B) presents results from the analysis comparing diagnosed schizophrenia cases and controls.
Figure 4—figure supplement 1.
Figure 4—figure supplement 1.. Including genetic principal components (PCs) into DNA methylation analysis models has little effect on the results in ethnically heterogeneous cohorts.
Shown is a scatterplot of statistics (–log10 p-value) from an epigenome-wide association study (EWAS) of psychosis in the IoPPN cohort without the inclusion of any genetic PCs in the analysis model (x-axis) compared to an EWAS of psychosis including five genetic PCs in the analysis model (y-axis).
Figure 5.
Figure 5.. Psychosis-associated differential DNA methylation at sites annotated to genes previously implicated in disease etiology.
Shown are forest plots for differentially methylated positions (DMPs) annotated to the GABA transporter SLC6A12 (cg00517261; p=1.53×10⁻⁸), the GABA receptor GABBR1 (cg00667298; p=5.07×10⁻⁹), and the calcium voltage-gated channel subunit gene CACNA1C (cg01833890; p=8.42×10⁻⁹). TE: treatment effect (i.e., the mean difference between cases and controls); seTE: standard error of the treatment effect.
Figure 6.
Figure 6.. Comparison of effect sizes for schizophrenia-associated differentially methylated positions (DMPs) overlapping with epigenome-wide association study (EWAS) results for other traits.
Shown for each overlapping DMP is the association effect size for the other trait (x-axis) taken from the online EWAS catalog (http://ewascatalog.org/) compared to the effect size identified in our meta-analysis of schizophrenia (y-axis).
Figure 7.
Figure 7.. DNA methylation at sites associated with schizophrenia is more strongly influenced by genetic factors and common environmental influences than equivalent matched sites across the genome.
A series of density plots for estimates of additive genetic effects (A, left), common environmental effects (C, middle), and non-shared environmental effects (E, right) derived using data from a dataset generated by Hannon et al., 2018b: schizophrenia DMPs (red) and matched background sites (green).
Figure 8.
Figure 8.. Differences in DNA methylation between schizophrenia cases and controls are partially influenced by a subset of cases with treatment-resistant schizophrenia (TRS).
Forest plots from a meta-analysis of differences in DNA methylation at cg16322565 located in the NR1L2 gene on chromosome 3 between (A) schizophrenia patients and controls and (B) TRS patients prescribed clozapine and non-TRS prescribed other medications. TE: treatment effect (i.e., the mean difference between cases and controls); seTE: standard error of the treatment effect.
Figure 8—figure supplement 1.
Figure 8—figure supplement 1.. Forest plot of a site where DNA methylation is significantly associated with schizophrenia and within cases, with treatment-resistant schizophrenia.
TE: treatment effect (i.e., the mean difference between cases and controls); seTE: standard error of the treatment effect.
Figure 8—figure supplement 2.
Figure 8—figure supplement 2.. Forest plot of a site where DNA methylation is significantly associated with schizophrenia and within cases, with treatment-resistant schizophrenia but with an opposite directions of effect.
TE: treatment effect (i.e., the mean difference between cases and controls); seTE: standard error of the treatment effect.
Author response image 1.
Author response image 1.. Comparison of effect sizes from an EWAS of diagnosed SZ (x-axis) and FEP (y-axis) for SZ-associated DMPs.
Shown is the mean difference (% DNAm) between cases and controls.
Author response image 2.
Author response image 2.. Limited evidence for a relationship between age and DNAm at SZ-associated DMPs.
Shown is a histogram of –log10(p-values) for the interaction term between age and schizophrenia status across all 1,048 SZ-associated DMPs.
Author response image 3.
Author response image 3.. Limited evidence for a relationship between sex and DNAm at SZ-associated DMPs.
Shown is a histogram of –log10(p-values) for the interaction term between sex and schizophrenia status across all 1,048 SZ-associated DMPs.
Author response image 4.
Author response image 4.. Comparison of results from our EWAS meta-analysis with those for 167 replicated SZ-associated DMPs identified by Montano et al.
Overall there is a significant enrichment of consistent results between the analyses for these DMPs. The red crosses highlight the two DNAm sites that were reported as significant by Montano et al. and also passed our multiple testing threshold in our meta-analysis.
Author response image 5.
Author response image 5.. Comparison of results from our EWAS meta-analysis (x-axis) with those identified in an analysis of human PFC (y-axis).
Overall there is a significant enrichment of consistent results between the analyses for SZ-associated DMPs. Black dots represent DMPs that we found to show low covariation (r < 0.2) between blood and cortex tissue in a previous analysis of matched samples from the same individuals (Hannon et al., Epigenetics, PMID: 26457534), with blue (r > 0.2) and red (r > 0.5) symbols highlighting sites with stronger covariation in DNAm between tissues.

References

    1. Aberg KA, McClay JL, Nerella S, Clark S, Kumar G, Chen W, Khachane AN, Xie L, Hudson A, Gao G, Harada A, Hultman CM, Sullivan PF, Magnusson PK, van den Oord EJ. Methylome-wide association study of schizophrenia: identifying blood biomarker signatures of environmental insults. JAMA Psychiatry. 2014;71:255–264. doi: 10.1001/jamapsychiatry.2013.3730. - DOI - PMC - PubMed
    1. Ajnakina O, Horsdal HT, Lally J, MacCabe JH, Murray RM, Gasse C, Wimberley T. Validation of an algorithm-based definition of treatment resistance in patients with schizophrenia. Schizophrenia Research. 2018;197:294–297. doi: 10.1016/j.schres.2018.02.017. - DOI - PubMed
    1. Aleman A, Kahn RS, Selten JP. Sex differences in the risk of schizophrenia: evidence from meta-analysis. Archives of General Psychiatry. 2003;60:565–571. doi: 10.1001/archpsyc.60.6.565. - DOI - PubMed
    1. Alvir JM, Lieberman JA, Safferman AZ, Schwimmer JL, Schaaf JA. Clozapine-induced agranulocytosis. incidence and risk factors in the united states. New England Journal of Medicine. 1993;329:162–167. doi: 10.1056/NEJM199307153290303. - DOI - PubMed
    1. Bachmann CJ, Aagaard L, Bernardo M, Brandt L, Cartabia M, Clavenna A, Coma Fusté A, Furu K, Garuoliené K, Hoffmann F, Hollingworth S, Huybrechts KF, Kalverdijk LJ, Kawakami K, Kieler H, Kinoshita T, López SC, Machado-Alba JE, Machado-Duque ME, Mahesri M, Nishtala PS, Piovani D, Reutfors J, Saastamoinen LK, Sato I, Schuiling-Veninga CCM, Shyu YC, Siskind D, Skurtveit S, Verdoux H, Wang LJ, Zara Yahni C, Zoëga H, Taylor D. International trends in clozapine use: a study in 17 countries. Acta Psychiatrica Scandinavica. 2017;136:37–51. doi: 10.1111/acps.12742. - DOI - PubMed

Publication types

Associated data