. 2021 Mar 1;19(3):e3001107.
doi: 10.1371/journal.pbio.3001107. eCollection 2021 Mar.

Assessment of transparency indicators across the biomedical literature: How open is open?

Affiliations

Assessment of transparency indicators across the biomedical literature: How open is open?

Stylianos Serghiou et al. PLoS Biol. .

Abstract

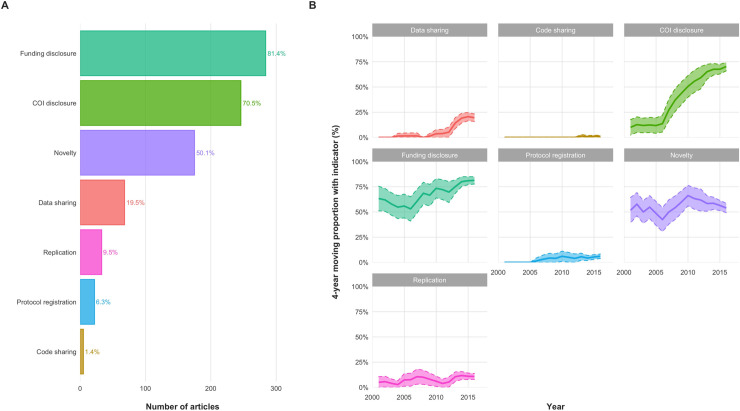
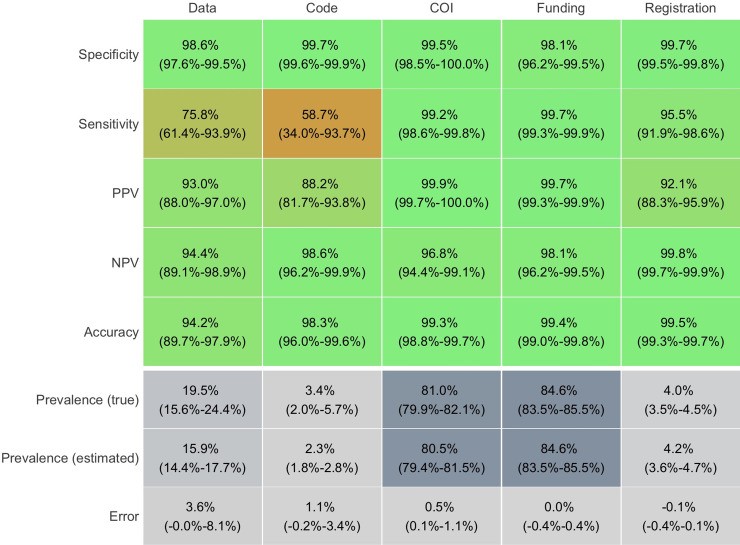
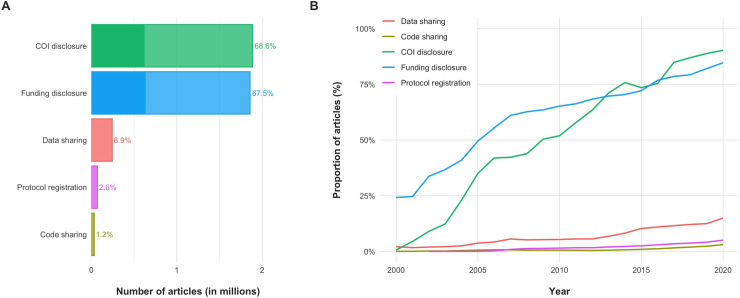
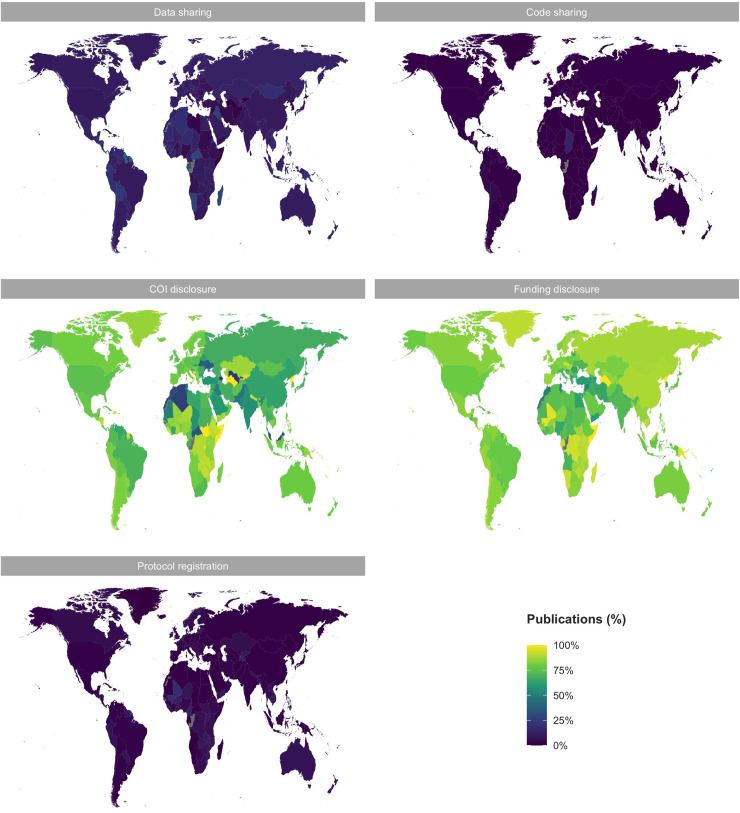
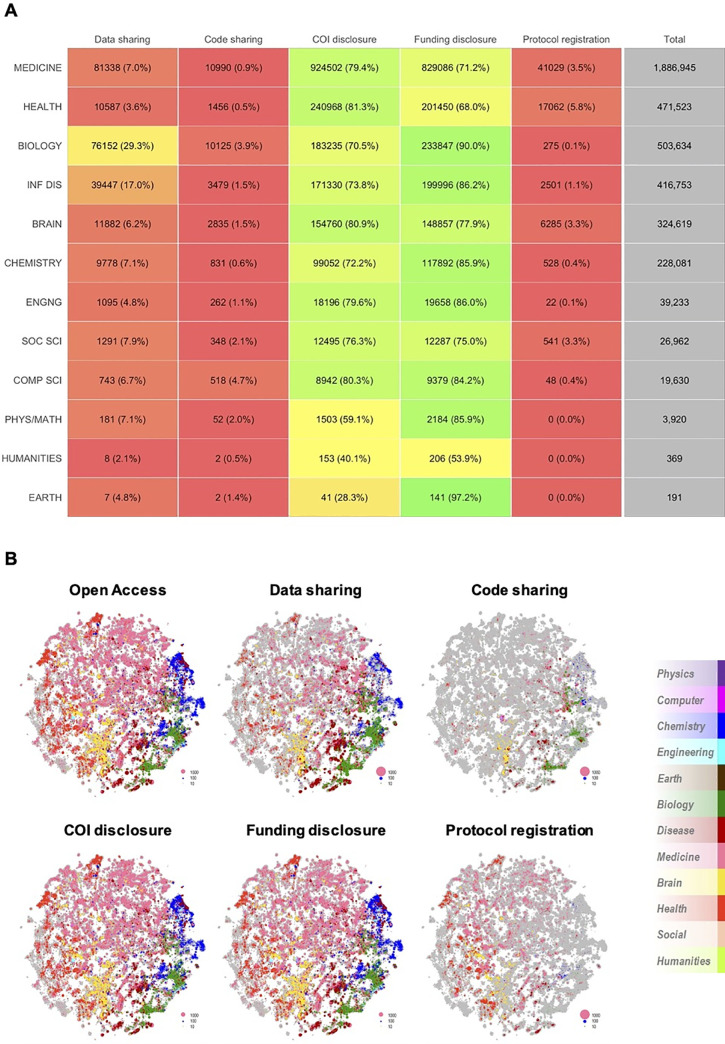
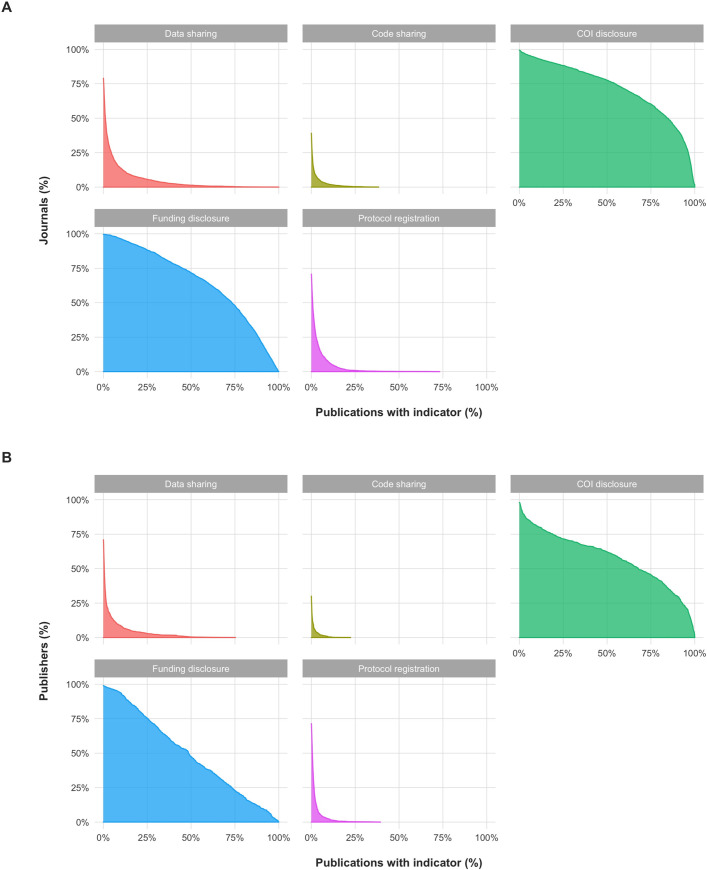
Recent concerns about the reproducibility of science have led to several calls for more open and transparent research practices and for the monitoring of potential improvements over time. However, with tens of thousands of new biomedical articles published per week, manually mapping and monitoring changes in transparency is unrealistic. We present an open-source, automated approach to identify 5 indicators of transparency (data sharing, code sharing, conflicts of interest disclosures, funding disclosures, and protocol registration) and apply it across the entire open access biomedical literature of 2.75 million articles on PubMed Central (PMC). Our results indicate remarkable improvements in some (e.g., conflict of interest [COI] disclosures and funding disclosures), but not other (e.g., protocol registration and code sharing) areas of transparency over time, and map transparency across fields of science, countries, journals, and publishers. This work has enabled the creation of a large, integrated, and openly available database to expedite further efforts to monitor, understand, and promote transparency and reproducibility in science.


Conflict of interest statement

The authors have declared that no competing interests exist.

Figures

Fig 1
Fig 1. Indicators of transparency and reproducibility across publications and time.
(A) Indicators of transparency and reproducibility across 349 research articles (2015–2018). Most publications included COI or Funding disclosures, but few mentioned Data, Code, or Protocol sharing. Similarly, most claimed Novelty but few mentioned a Replication component. (B) Indicators of transparency and reproducibility across time on the basis of manual assessment. These graphs merge data from this study on 349 research articles (2015–2018) with similar data from 2 previous studies on another 590 PubMed articles (2000–2018) [20,22]. Proportions are displayed as a 4-year centered moving average. The shaded region indicates the 95% CI. The most notable change is that of COI disclosures, the reporting of which increased from 12% in 2000 to 76% in 2018. The data underlying this figure can be found on OSF at http://www.doi.org/10.17605/OSF.IO/E58WS. CI, confidence interval; COI, Conflict of interest; OSF, Open Science Framework.
Fig 2
Fig 2. Validation of algorithms for Data sharing, Code sharing, COI disclosure, Funding disclosure, and Protocol registration in 6,017 PMC articles from 2015 to 2019.
The displayed performance was assessed in subsamples from 6,017 PMC articles: 189 research articles for Data sharing (100 positive, 89 negative), 291 research articles for Code sharing (110 positive, 181 negative), 325 articles for COI disclosure (100 positive, 225 negative), 326 for Funding disclosure (100 positive, 226 negative), and 308 for Protocol availability (161 positive, 147 negative). All algorithms displayed high accuracy (>94%) and low error in prevalence estimation (≤3.6%) compared to manual assessment. Error, difference between true and estimated prevalence; NPV, negative predictive value; PPV, positive predictive value (precision); Prevalence (true), manual estimate of proportion of articles with indicator; Prevalence (estimated), automated estimate of proportion of articles with indicator. The data underlying this figure can be found on OSF at http://www.doi.org/10.17605/OSF.IO/E58WS. COI, Conflict of interest; OSF, Open Science Framework; PMC, PubMed Central.
Fig 3
Fig 3. Indicators of transparency across the entire open biomedical literature on PMC (PMCOA) and time.
(A) Most open biomedical articles report COI disclosures and Funding disclosures, but only a minority report any Data sharing, Code sharing, or open Protocol registration. Note that this figure displays the obtained results with no adjustments (see text for adjustments). The opaque section of the bars for COI and Funding disclosure denotes the number of publications that would have been recognized had we only used information currently provided on PMC. Such information appears to underestimate the true prevalence of these indicators by two-thirds. (B) Transparency in the open biomedical literature on PMC (2000–2020). Reporting on all indicators of transparency has been increasing for the past 20 years. However, the increase for COI and Funding disclosures has been much more dramatic than for Data sharing, Code sharing, and Protocol registration. The data underlying this figure can be found on OSF at http://www.doi.org/10.17605/OSF.IO/E58WS. COI, Conflict of interest; OSF, Open Science Framework; PMC, PubMed Central; PMCOA, PubMed Central Open Access.
Fig 4
Fig 4. Indicators of transparency across countries of affiliation for all open access articles on PMC (PMCOA) for 1990–2020.
Indicators of transparency are roughly homogeneously reported across countries. The light green to yellow maps indicate that the majority of publications from most countries reported COI and Funding disclosures. The purple maps indicate that the majority of publications from most countries did not report any Data, Code, or Protocol sharing. Note that the country was only reported in 479,843 articles. The data underlying this figure can be found on OSF at http://www.doi.org/10.17605/OSF.IO/E58WS. COI, Conflict of interest; OSF, Open Science Framework; PMC, PubMed Central; PMCOA, PubMed Central Open Access.
Fig 5
Fig 5. Indicators of transparency across fields of science on PMCOA.
(A) Reporting of indicators of transparency across fields of science for all articles on PMCOA since 1990. COI and Funding disclosures are by far the most highly reported indicators within all fields, whereas Code sharing and Protocol registration are by far the least reported. The indicator with the biggest proportional difference between minimum and maximum reporting across fields of science was Protocol registration (0.1% versus 5.8%; Coefficient of variation, 130), and the indicator with the smallest proportional difference was Funding disclosure (53.9% versus 90.0%; Coefficient of variation, 14.5). (B) Indicators of transparency in all articles of PMCOA published between 2015 and 2019 across galaxies of science. The galaxy in gray represents all clusters of articles published between 2015 and 2019. On top of the gray galaxy, we overlaid colored representations of the proportion of each cluster that is open access or reports on any of the indicators of transparency. The open access galaxy is very similar to that of COI and Funding disclosures, suggesting that most of the open literature reports on both. A number of Chemistry (blue) and Biology (green) clusters are smaller in COI disclosure, whereas a number of Health services (red) and Infectious diseases (burgundy) clusters are smaller in Funding disclosure. Biology (green) and Infectious diseases (burgundy) are pronounced in Data sharing. A very small proportion of clusters report Code sharing or open Protocol registration—of those, the majority are Biology (green) and Health services (red) clusters, respectively. The data underlying this figure can be found on OSF at http://www.doi.org/10.17605/OSF.IO/E58WS. COI, Conflict of interest; OSF, Open Science Framework; PMCOA, PubMed Central Open Access.
Fig 6
Fig 6. Indicators of transparency across 2,477 journals and 609 publishers with at least 100 publications on PMCOA between 1990 and 2020.
(A) Proportion of journals with at least a designated proportion of publications reporting on each indicator of transparency. For example, for the graph on Funding disclosures, approximately 50% of journals (vertical axis) report Funding disclosures in at least approximately 75% of their publications (horizontal axis). Similarly, they indicate that no journal reports Protocol registration in more than approximately 75% of publications. The concave (bent outward) distribution of COI and Funding disclosures indicates that most publications in most journals disclose COI or Funding, respectively. However, the convex (bent inward) distribution of Data sharing, Code sharing, and Protocol registration indicate that most publications do not report on each of these indicators in most journals. About three quarters of journals have hosted at least 1 publication sharing data, and about one-third of journals have hosted at least 1 publication sharing code. (B) Proportion of publishers with at least a designated proportion of articles (research or non-research) reporting on each indicator of transparency. For example, these graphs indicate that approximately 50% of journals (vertical axis) report Funding disclosures in at least approximately 50% of their articles (horizontal axis). Similarly, no publisher reports Data sharing in more than approximately 75% of articles. As in (A), the shapes of these distributions indicate that most articles of most publishers report on COI and Funding, but most do not report on Data sharing, Code sharing, or Protocol registration. Almost three quarters of publishers host articles that never report Code sharing, and roughly one-quarter of publishers host articles that never report Data sharing. The data underlying this figure can be found on OSF at http://www.doi.org/10.17605/OSF.IO/E58WS. COI, Conflict of interest; OSF, Open Science Framework; PMCOA, PubMed Central Open Access.

Comment in

References

    1. Goodman SN, Fanelli D, Ioannidis JPA. What does research reproducibility mean? Sci Transl Med. 2016;8:341ps12. 10.1126/scitranslmed.aaf5027 - DOI - PubMed
    1. Baker M. 1,500 scientists lift the lid on reproducibility. Nature. 2016;533:452–4. 10.1038/533452a - DOI - PubMed
    1. Ioannidis JPA. Why Most Published Research Findings Are False. PLoS Med. 2005;2(8):e124. 10.1371/journal.pmed.0020124 - DOI - PMC - PubMed
    1. Prinz F, Schlange T, Asadullah K. Believe it or not: how much can we rely on published data on potential drug targets? Nat Rev Drug Discov. 2011(10):712–2. 10.1038/nrd3439-c1 - DOI - PubMed
    1. Begley CG, Ellis LM. Drug development: Raise standards for preclinical cancer research. Nature. 2012;483:531–3. 10.1038/483531a - DOI - PubMed

Publication types

LinkOut - more resources