

Frequency following responses and rate change complexes in cochlear implant users
- PMID: 33647574
- PMCID: PMC8052190
- DOI: 10.1016/j.heares.2021.108200
Frequency following responses and rate change complexes in cochlear implant users
Abstract
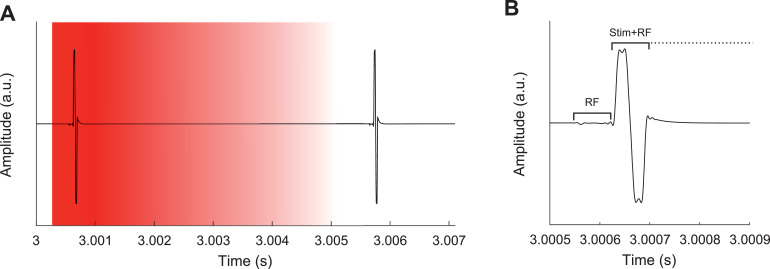
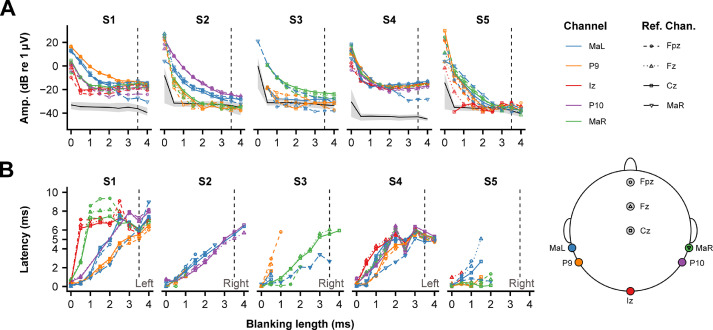
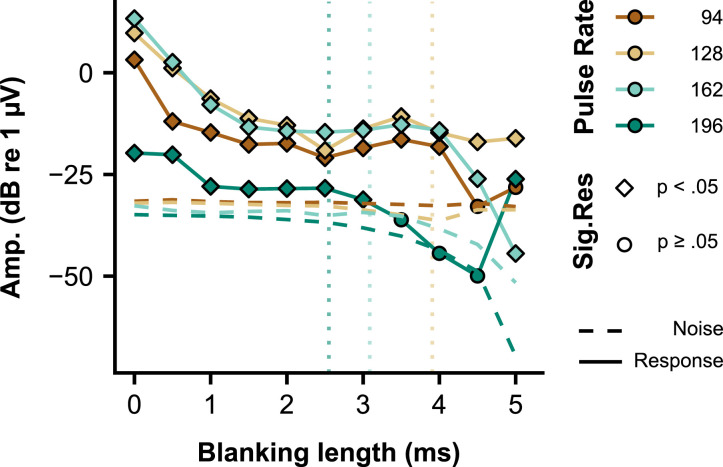
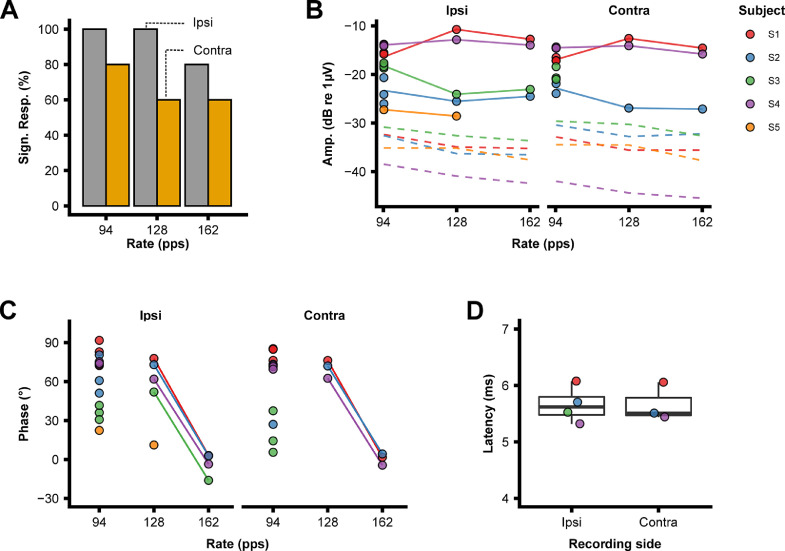
The upper limit of rate-based pitch perception and rate discrimination can differ substantially across cochlear implant (CI) users. One potential reason for this difference is the presence of a biological limitation on temporal encoding in the electrically-stimulated auditory pathway, which can be inherent to the electrical stimulation itself and/or to the degenerative processes associated with hearing loss. Electrophysiological measures, like the electrically-evoked frequency following response (eFFR) and auditory change complex (eACC), could potentially provide valuable insights in the temporal processing limitations at the level of the brainstem and cortex in the electrically-stimulated auditory pathway. Obtaining these neural responses, free from stimulation artifacts, is challenging, especially when the neural response is phase-locked to the stimulation rate, as is the case for the eFFR. In this study we investigated the feasibility of measuring eFFRs, free from stimulation artifacts, to stimulation rates ranging from 94 to 196 pulses per second (pps) and eACCs to pulse rate changes ranging from 36 to 108%, when stimulating in a monopolar configuration. A high-sampling rate EEG system was used to measure the electrophysiological responses in five CI users, and linear interpolation was applied to remove the stimulation artifacts from the EEG. With this approach, we were able to measure eFFRs for pulse rates up to 162 pps and eACCs to the different rate changes. Our results show that it is feasible to measure electrophysiological responses, free from stimulation artifacts, that could potentially be used as neural correlates for rate and pitch processing in CI users.
Keywords: Artifact removal; Auditory change complex; Cochlear implants; Frequency following response; Pitch; Rate; Stimulation artifacts; Temporal processing.
Copyright © 2021. Published by Elsevier B.V.
Figures


Similar articles
-
Artifact removal by template subtraction enables recordings of the frequency following response in cochlear-implant users.Sci Rep. 2024 Mar 14;14(1):6158. doi: 10.1038/s41598-024-56047-9. Sci Rep. 2024. PMID: 38486005 Free PMC article.
-
Auditory steady-state responses in cochlear implant users: Effect of modulation frequency and stimulation artifacts.Hear Res. 2016 May;335:149-160. doi: 10.1016/j.heares.2016.03.006. Epub 2016 Mar 17. Hear Res. 2016. PMID: 26994660
-
Electrophysiological assessment of temporal envelope processing in cochlear implant users.Sci Rep. 2020 Sep 21;10(1):15406. doi: 10.1038/s41598-020-72235-9. Sci Rep. 2020. PMID: 32958791 Free PMC article.
-
Music perception with cochlear implants: a review.Trends Amplif. 2004;8(2):49-82. doi: 10.1177/108471380400800203. Trends Amplif. 2004. PMID: 15497033 Free PMC article. Review.
-
Electrical stimulation of the auditory nerve: the coding of frequency, the perception of pitch and the development of cochlear implant speech processing strategies for profoundly deaf people.Clin Exp Pharmacol Physiol. 1996 Sep;23(9):766-76. doi: 10.1111/j.1440-1681.1996.tb01178.x. Clin Exp Pharmacol Physiol. 1996. PMID: 8911712 Review.
Cited by
-
Using Interleaved Stimulation and EEG to Measure Temporal Smoothing and Growth of the Sustained Neural Response to Cochlear-Implant Stimulation.J Assoc Res Otolaryngol. 2023 Apr;24(2):253-264. doi: 10.1007/s10162-023-00886-2. Epub 2023 Feb 8. J Assoc Res Otolaryngol. 2023. PMID: 36754938 Free PMC article.
-
Applications and Challenges of Auditory Brain-Computer Interfaces in Objective Auditory Assessments for Pediatric Cochlear Implants.Exploration (Beijing). 2025 Mar 6;5(3):20240078. doi: 10.1002/EXP.20240078. eCollection 2025 Jun. Exploration (Beijing). 2025. PMID: 40585760 Free PMC article. Review.
-
Artifact removal by template subtraction enables recordings of the frequency following response in cochlear-implant users.Sci Rep. 2024 Mar 14;14(1):6158. doi: 10.1038/s41598-024-56047-9. Sci Rep. 2024. PMID: 38486005 Free PMC article.
-
Simultaneous subcortical and cortical electrophysiological recordings of spectro-temporal processing in humans.Front Neurol. 2022 Aug 3;13:928158. doi: 10.3389/fneur.2022.928158. eCollection 2022. Front Neurol. 2022. PMID: 35989907 Free PMC article.
-
Temporal Pitch Sensitivity in an Animal Model: Psychophysics and Scalp Recordings : Temporal Pitch Sensitivity in Cat.J Assoc Res Otolaryngol. 2022 Aug;23(4):491-512. doi: 10.1007/s10162-022-00849-z. Epub 2022 Jun 6. J Assoc Res Otolaryngol. 2022. PMID: 35668206 Free PMC article.
References
-
- Bidelman G.M. Subcortical sources dominate the neuroelectric auditory frequency-following response to speech. Neuroimage. 2018;175:56–69. - PubMed
-
- Carlyon R.P., Cosentino S., Deeks J.M., Parkinson W., Arenberg J.A. Effect of stimulus polarity on detection thresholds in cochlear implant users: relationships with average threshold, gap detection, and rate discrimination. J. Assoc. Res. Otolaryngol. 2018;19:559–567. doi: 10.1007/s10162-018-0677-5. - DOI - PMC - PubMed
Publication types
MeSH terms
Grants and funding
LinkOut - more resources
Full Text Sources
Other Literature Sources
Medical
