. 2021 Mar 1;40(1):86.
doi: 10.1186/s13046-021-01890-1.

HMGA1-TRIP13 axis promotes stemness and epithelial mesenchymal transition of perihilar cholangiocarcinoma in a positive feedback loop dependent on c-Myc

Affiliations

HMGA1-TRIP13 axis promotes stemness and epithelial mesenchymal transition of perihilar cholangiocarcinoma in a positive feedback loop dependent on c-Myc

Zhipeng Li et al. J Exp Clin Cancer Res. .

Erratum in

Abstract

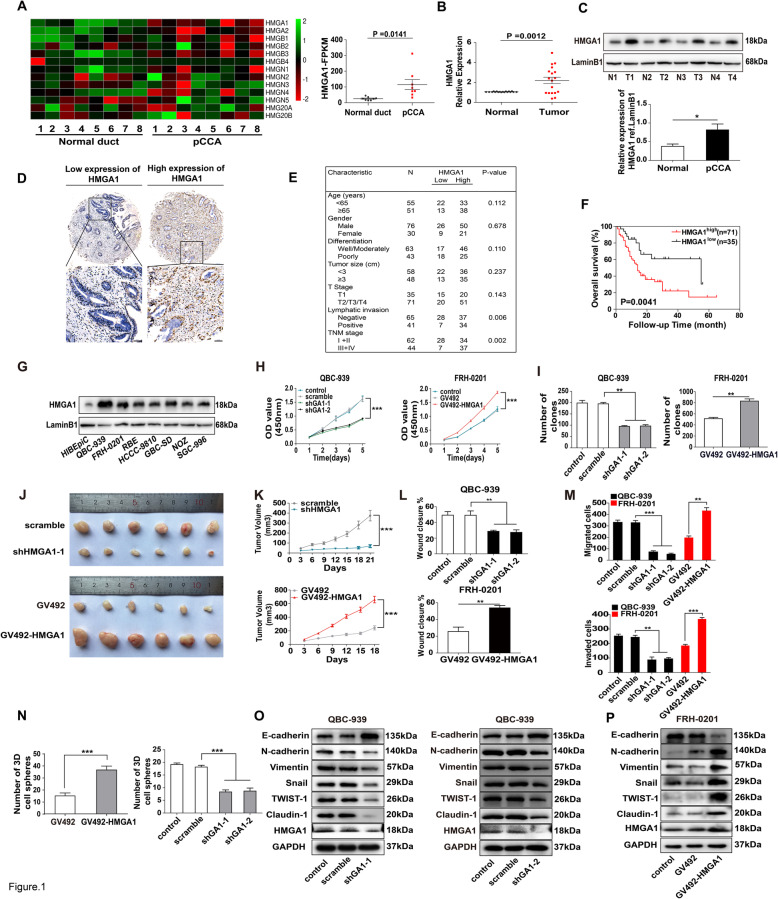
Background: Cholangiocarcinoma is a highly malignant cancer with very dismal prognosis. Perihilar cholangiocarcinoma(pCCA) accounts for more than 50% of all cholangiocarcinoma and is well-characterized for its low rate of radical resection. Effects of radiotherapy and chemotherapy of pCCA are very limited.

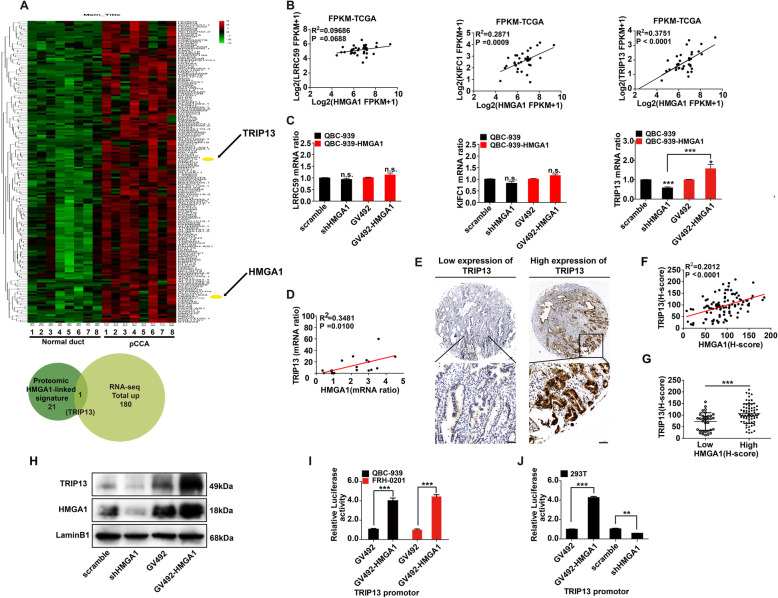
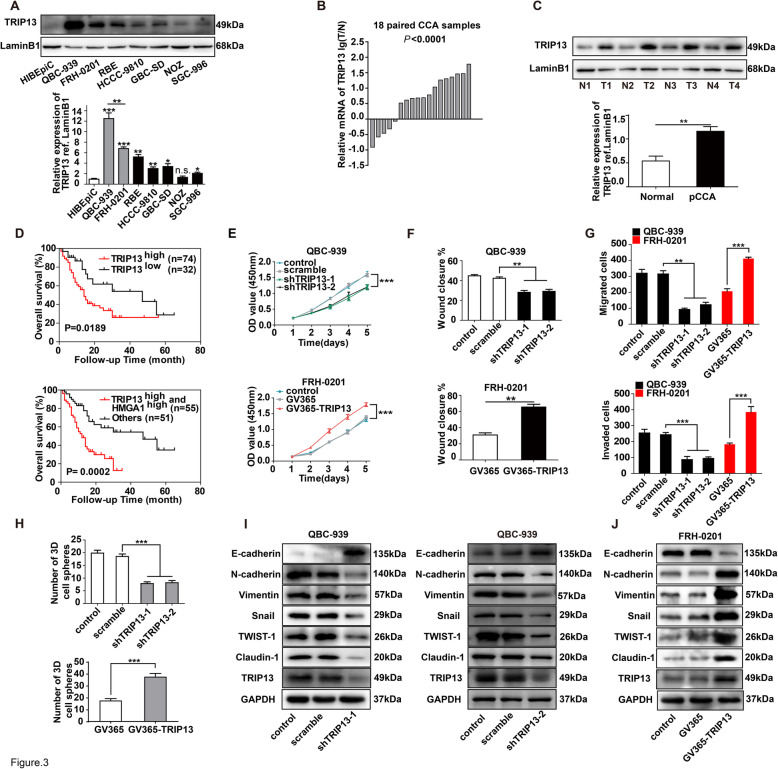
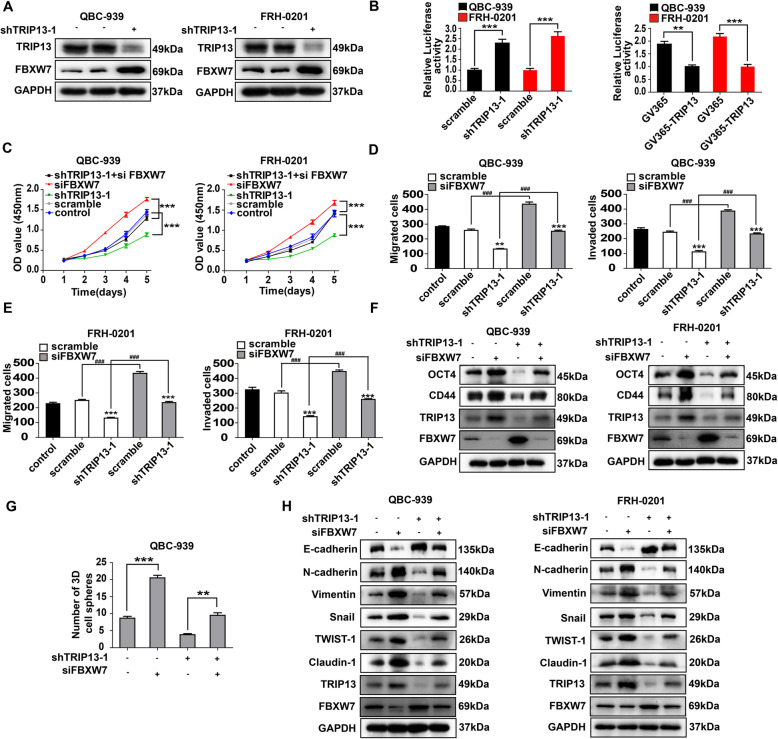
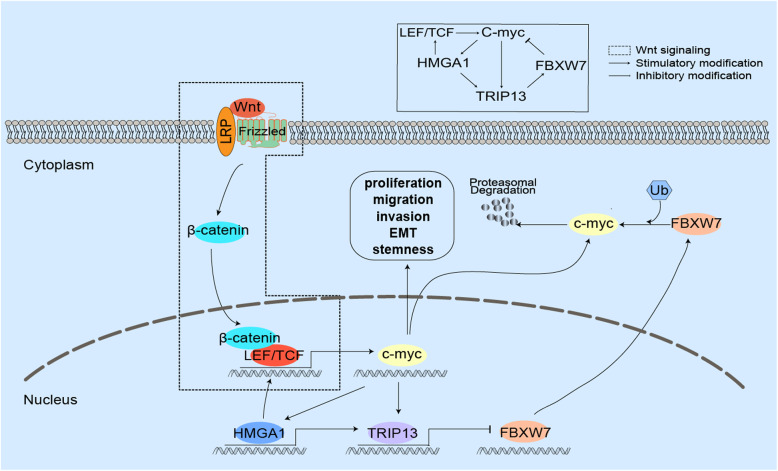
Methods: Here we screened potential biomarkers of pCCA with transcriptome sequencing and evaluated the prognostic significance of HMGA1 in a large cohort pCCA consisting of 106 patients. With bioinformatics and in vitro/vivo experiments, we showed that HMGA1 induced tumor cell stemness and epithelial-mesenchymal-transition (EMT), and thus facilitated proliferation, migration and invasion by promoting TRIP13 transcription. Moreover, TRIP13 was also an unfavorable prognostic biomarker of pCCA, and double high expression of HMGA1/TRIP13 could predict prognosis more sensitively. TRIP13 promoted pCCA progression by suppressing FBXW7 transcription and stabilizing c-Myc. c-Myc in turn induced the transcription and expression of both HMGA1 and TRIP13, indicating that HMGA-TRIP13 axis facilitated pCCA stemness and EMT in a positive feedback pathway.

Conclusions: HMGA1 and TRIP13 were unfavorable prognostic biomarkers of pCCA. HMGA1 enhanced pCCA proliferation, migration, invasion, stemness and EMT, by inducing TRIP13 expression, suppressing FBXW7 expression and stabilizing c-Myc. Moreover, c-Myc can induce the transcription of HMGA1 and TRIP13, suggesting that HMGA-TRIP13 axis promoted EMT and stemness in a positive feedback pathway dependent on c-Myc.

Keywords: Epithelial-mesenchymal-transition; HMGA1;TRIP13; Perihilar cholangiocarcinoma; Prognostic biomarker; Stemness.


Conflict of interest statement

The authors declare no potential conflicts of interest.

Figures

Fig. 1
Fig. 1
HMGA1 enhanced oncogenic progression of pCCA cells. a Left: Heatmap of HMG gene expression profiles in eight pairs of pCCA tissues and adjacent normal tissues. Right: FPKM of HMGA1 in pCCA and adjacent normal tissues were shown. Data were were analyzed by paired t tests (b) HMGA1 mRNA expression in 18 paired pCCA and adjacent normal duct tissues, detected by qRT-PCR. P value was calculated with paired t tests. c Up: HMGA1 expression in four randomly-selected pairs of pCCA tissues (T) and adjacent normal tissues (N), detected by Western blot. Bottom: quantification of bands in the left panel. d Representative images of immunohistochemical staining for low/high expression of HMGA1 in the tissue microarray (top: 100× magnification, scale bar, 200 μm; bottom: 400× magnification, scale bar, 50 μm). e Correlation between HMGA1 expression and clinicopathological features (Chi-square tests). f Kaplan-Meier survival analysis in patients with pCCA with low (n = 35) and high (n = 71) HMGA1 expression (cut-off: 77.4). g HMGA1 expression in human cholangiocarcinoma cell lines, gallbladder carcinoma cell lines, and intrahepatic bile duct cell line HiBEpiC. (H) HMGA1 was silenced in QBC939 and overexpressed in FRH0201, and the effects of HMGA1 on pCCA cell proliferation were measured by CCK-8 assays. i effects of HMGA1 on colony formation in QBC939 and FRH0201 cells after knockdown in QBC939 or overexpression in FRH0201. j QBC939 cells with stable HMGA1 knockdown (up) or overexpression (bottom) were subcutaneously injected to nude mice for xenograft model (n = 6/group). k Tumor volumes in xenografts established using cells infected with lentivirus carrying scrambled shRNA, shHMGA1, empty vector, or GV492-HMGA1. l,m The effects of HMGA1 on migration and invasion were detected with wound-healing assay(l) and transwell assay(m) after silencing HMGA1 in QBC939 or overexpressing HMGA1 in FRH0201 cells. n Effects of HMGA1 on stemness was detected by 7-day-sphere formation activity with stable HMGA1-silencing or HMGA1-overexpressing QBC939 cells. o,p Effects of HMGA1 on EMT were detected by Western blot after silencing HMGA1 in QBC939(o) and overexpressing HMGA1 in FRH0201 cells(p). *P < 0.05, **P < 0.01, and ***P < 0.001 compared with the corresponding control group. Data are shown as means ±S.D., and statistical significance was analyzed with one-way ANOVA(h and k) or T-test. Analyzed data were from three independent experiments, and each subgroup was performed at least in triplicate (c,g, h,i, l-p)
Fig. 2
Fig. 2
HMGA1 promoted the transcription and expression of TRIP13. a Heatmap and hierarchical clustering analysis revealed 180 up-regulated gene expression profiles in eight pairs of pCCA tissues and adjacent normal tissues. TRIP13 was filtered out as the only overlapping gene between the 21 Proteomic HMGA1-linked signature and 180 total upregulated genes (a). c Correlations between HMGA1 and LRRC59/KIFC1/TRIP13 mRNA in 36 cases of CCA were evaluated. The linear correlations were analyzed using the Spearman method. d Changes in LRRC59/KIFC1/TRIP13 mRNA after knocking down or overexpressing HMGB1 in QBC939 cells. e Correlation between HMGA1 and TRIP13 mRNA in 12 fresh pCCA tissues. mRNA ratio was calculated by mRNA (tumor)/mRNA (adjacent tissue). f Representative IHC images of low and high TRIP13 expression (top: 100× magnification, scale bar, 200 μm; bottom: 400× magnification, scale bar, 50 μm). g IHC scores of HMGA1 were significantly associated with TRIP13 scores in pCCA tissues. h Patients with high HMGA1 expression had higher TRIP13 expression. i TRIP13 expression was detected in stable QBC939 cells with HMGA1 knockdown or overexpression. j and k HMGA1 promoted the transcription of TRIP13 in both QBC939 and FRH0201 cells (j), and 293 T cells(k). The transcriptional activity of TRIP13 was detected with luciferase assays. * represented P < 0.05, and *** represented P < 0.001 compared with control or indicated groups, calculated by T-test in (j, h and k). Spearman correlation analysis was performed in (c, e and g). Analyzed data were from three independent experiments, and shown as means± SEM
Fig. 3
Fig. 3
TRIP13 was correlated with poor prognosis and progression of pCCA. a TRIP13 expression in biliary cell lines. Up: Expression of TRIP13 in HiBEpiC, iCCA cell lines, pCCA cell lines and gallbladder cancer cells. Bottom: the quantification of the TRIP13 bands in WB. b TRIP13 mRNA levels in 18 pairs of pCCAs and adjacent normal bile duct tissues were detected with qRT-PCR, and showed as log (TRIP13Tumor/TRIP13Non-tumor). c TRIP13 expression was detected in four pairs of pCCA tissues and adjacent normal duct tissues with WB (up), and the bands were quantified (bottom). d The prognostic significance of TRIP13 expression (up), and co-expression of TRIP13 and HMGA1(bottom) were analyzed with survival analysis by log-rank test. e HMGA1 was knocked down in QBC-939 cells and overexpressed in FRH-0201 cells; cell proliferation was detected with CCK8 assays within 4 days of culture. f,g Migration and invasion of QBC-939 and FRH-0201 cells, as detected by wound healing assay (f) or transwell assay(g) after silencing or overexpressing HMGA1. h 7-day sphere formation assays were performed to determine the effects of TRIP13 on stem cell characteristics of pCCA cells. i, j Effect of TRIP13 on the EMT in pCCA cells was evaluated by WB after silencing (i) or overexpressing (j) TRIP13 expression. *, ** and *** represents P < 0.05, P < 0.01 and P < 0.001, compared with the corresponding control group, analyzed with the T-test (c,f-h) or one-way ANOVA (e). Data were from three independent experiments and shown as means ± S.E.M.
Fig. 4
Fig. 4
TRIP13 was required for HMGA1-induced pCCA progression. a,b CCK8 assay (a) and colony formation assay (b) showed that TRIP13 knockdown attenuated the proliferation induced by HMGA1 overexpression. c Stable QBC-939 cells with/without HMGA1 overexpression and TIRP13 knockdown were injected subcutaneously for xenografts. d TIRP13 knockdown significantly decreased the volume and weight of xenografts. e,f TIRP13 knockdown attenuated cell ability of migration(e) and invasion(f) of pCCA cells. g TRIP13 is required in HMGA1-induced metastasis. Up: metastasis of stable QBC-939 cells with TIRP13 knockdown and/or HMGA1 overexpression to the liver, as verified by HE staining. The mouse metastasis model was established by tail vein injection of stable cells. Scale bar: 50 μm. h numbers of metastatic lesions on the surface of the liver. i 7-day sphere formation assays were performed to evaluated the effects of TRIP13 on HMGA1-induced pCCA stemness. j EMT biomarkers were detected to evaluate the effects of TRIP13 on HMGA1-induced pCCA EMT. n.s. represents not significant. *, ** and *** represents P < 0.05, P < 0.01 and P < 0.001, analyzed with one-way ANOVA(a,d) or T-test (b,e,f,i,h,j). Analyzed data were from three independent experiments, and each subgroup was performed at least in triplicate (a,b, e,f,i,j)
Fig. 5
Fig. 5
FBXW7 suppressed TRIP13-induced stemness and EMT. a TRIP13 knockdown decreased FBXW7 expression in QBC-939 and FRH-0201 cells. b Luciferase assays showed that TRIP3 inhibited FBXW7 transcription in QBC-939 and FRH-0201. c Silencing TRIP13 suppressed pCCA proliferation and knocking down FBXW7 had contrary effects. d,e Transwell assay showed that silencing FBXW7 promoted the migration(d) and invasion(e) which was decreased by TRIP13 knockdown. f,g QBC-939 and FRH-0201 were transfected with shTRIP13 and/or siFBXW7. The biomarkers of stemness (CD44 and OCT4)(f) and 7-day sphere formation assay(g) were performed. (H) EMT biomarkers were detected after regulating TRIP13 and/or FBXW7 expression in QBC939(left) or FRH0201(right). In (b,d,e,g), ** and *** represents P < 0.01 and < 0.001, compared with corresponding control group or indicated groups. In (b,d), the P value was calculated with T-test(b,d,g) or one-way ANOVA(c). Analyzed data were from three independent experiments, and each subgroup was performed at least in triplicate
Fig. 6
Fig. 6
HMGA1-TRIP13 axis promotes invasion, stemness and EMT in a positive feedback pathway dependent on c-Myc. a,b WB(a) and qRT-PCR(b) showed that FBXW7 and TRIP13 knockdown regulated c-Myc expression but had little effect on c-Myc mRNA. c MG132 inhibited the FBXW7-induced c-Myc degradation. QBC-939(left) and FRH-0201(right) were incubated in 10 μM MG132 for 12 h before lysis. d FBXW7 knockdown decreased the ubiquitination of c-Myc. 24 h after transfection with HA-Ub and siFBXW7, QBC-939 cells were incubated in 10 μM MG132 for 12 h. HA beads were used to precipitate HA-interacting proteins and c-Myc antibody was used to detect the ubiquitinated c-Myc. e,f c-Myc inhibitor 10,058-F4(e) and c-Myc knockdown(f) decreased the expression of HMGA1 and TRIP13 in pCCA cells. 10,058-F4(10 μM) was used to pre-incubate QBC-939 cells for 12 h. g Luciferase assays revealed that c-Myc promoted the transcription of TRIP13 and HMGA1 of QBC-939 cells. The transcriptional activity of HMGA1(up) and TRIP13(bottom) were detected with luciferase assays. ** represents P < 0.01, calculated with T-test. h HMGA1 knockdown rapidly decreased TRIP13 expression, while TRIP13 knockdown attenuated HMGA1 expression 12–24 h later. QBC-939 were transfected with shTRIP13 or shHMGA1 and incubated for 0–96 h. Analyzed data were from three independent experiments, and each subgroup was performed at least in triplicate
Fig. 7
Fig. 7
Inhibitors of HMGA1, TRIP13 or c-Myc can block their feedback and suppress pCCA progression. a In the presence of Wnt3A(100 ng/ml), 10 μM 10,058-F4, 10μg/ml HMGA1 inhibitor Netropsin and 10 μM TRIP13 inhibitor DCZ0415 were used to incubate QBC-939 for 12 h. All these inhibitors inhibited the expression of c-Myc, TRIP13 and HMGA1. b,c WB b and sphere formation(c) indicated the inhibitors of c-Myc, HMGA1 and TRIP13 decreased stemness of pCCA. d Inhibitors of c-Myc, HMGA1 and TRIP13 attenuated EMT of pCCA. e,f Inhibitors of c-Myc, HMGA1 and TRIP13 attenuated migration (e) and invasion (f) of pCCA in Wnt3a stimulation. ** and *** represents P < 0.01 and < 0.001, calculated with T-test. Analyzed data were from three independent experiments and displayed by the mean + S.E.M.
Fig. 8
Fig. 8
The schematic depiction of the positive feedback loop of HMGA1-TRIP13-c-Myc pathway. HMGA1 can induce the transcription and expression of TRIP13, therefore suppress FBXW7 expression and stabilize c-Myc, and eventually promote pCCA proliferation, migration, invasion, stemness and EMT. In the other side, c-Myc promoted HMGA1 and TRIP13 transcription, forming a positive feedback loop to amplify the effects of HMGA1-TRIP13 axis. Moreover, HMGA1 increased c-Myc expression via upregulating TCF family, which established another positive feedback pathway

References

    1. Razumilava N, Gores GJ. Cholangiocarcinoma. Lancet. 2014;383(9935):2168–79. - DOI - PMC - PubMed
    1. Rizvi S, Khan SA, Hallemeier CL, Kelley RK, Gores GJ. Cholangiocarcinoma - evolving concepts and therapeutic strategies. Nat Rev Clin Oncol. 2018;15(2):95–111. - DOI - PMC - PubMed
    1. Qiu B, Chen T, Sun R, Liu Z, Zhang X, Li Z, Xu Y, Zhang Z. Sprouty4 correlates with favorable prognosis in perihilar cholangiocarcinoma by blocking the FGFR-ERK signaling pathway and arresting the cell cycle. EBioMedicine. 2019;50:166–77. - DOI - PMC - PubMed
    1. Siriwardena AK. Klatskin Tumor. J Clin Oncol. 2017;35(36):4091–2. - DOI - PubMed
    1. Valle J, Wasan H, Palmer DH, Cunningham D, Anthoney A, Maraveyas A, Madhusudan S, Iveson T, Hughes S, Pereira SP, et al. Cisplatin plus gemcitabine versus gemcitabine for biliary tract cancer. N Engl J Med. 2010;362(14):1273–81. - DOI - PubMed

MeSH terms