. 2021 Mar 1;9(1):15.
doi: 10.1186/s40364-021-00265-0.

Single-cell map of diverse immune phenotypes in the acute myeloid leukemia microenvironment

Affiliations

Single-cell map of diverse immune phenotypes in the acute myeloid leukemia microenvironment

Rongqun Guo et al. Biomark Res. .

Abstract

Background: Knowledge of immune cell phenotypes, function, and developmental trajectory in acute myeloid leukemia (AML) microenvironment is essential for understanding mechanisms of evading immune surveillance and immunotherapy response of targeting special microenvironment components.

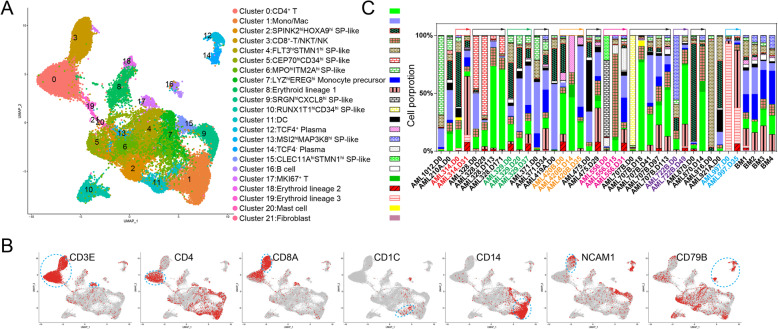
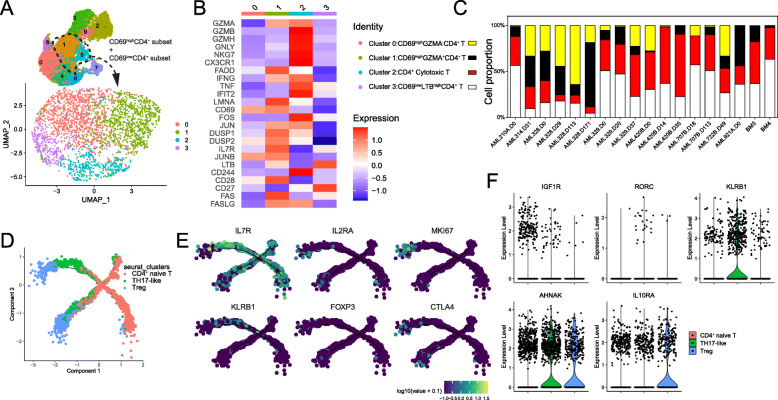
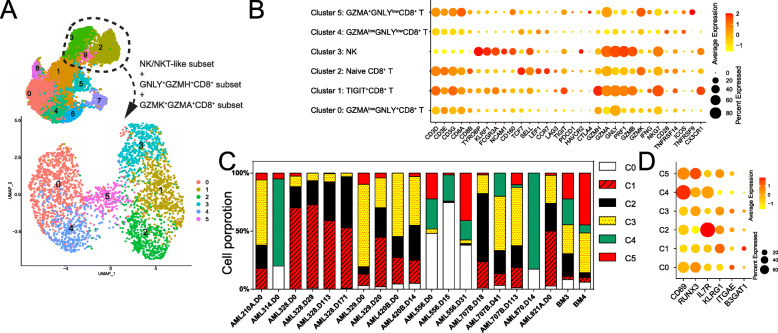
Methods: Using a single-cell RNA sequencing (scRNA-seq) dataset, we analyzed the immune cell phenotypes, function, and developmental trajectory of bone marrow (BM) samples from 16 AML patients and 4 healthy donors, but not AML blasts.

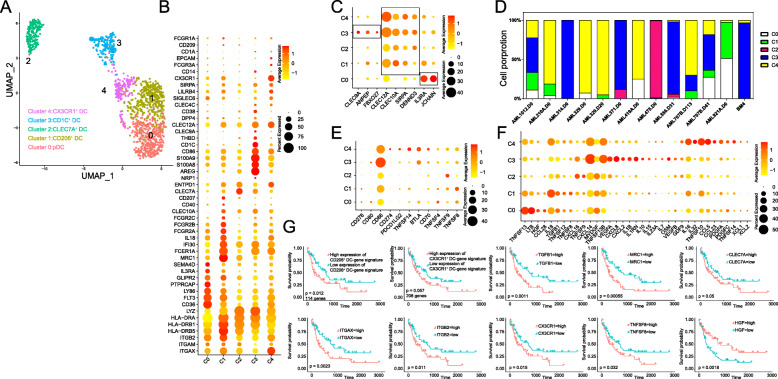
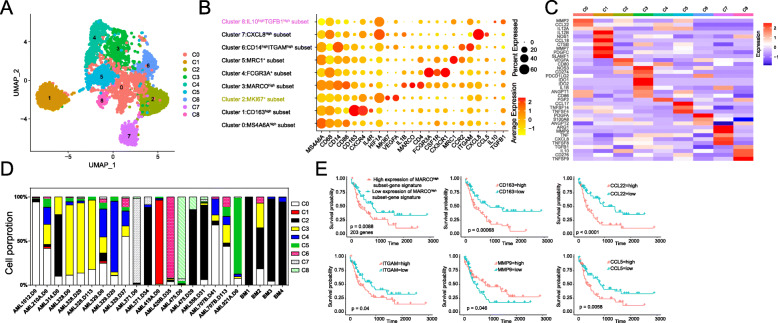
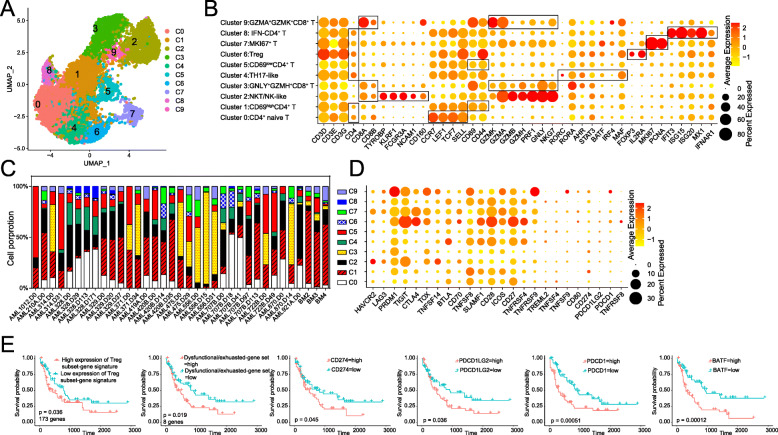
Results: We observed a significant difference between normal and AML BM immune cells. Here, we defined the diversity of dendritic cells (DC) and macrophages in different AML patients. We also identified several unique immune cell types including T helper cell 17 (TH17)-like intermediate population, cytotoxic CD4+ T subset, T cell: erythrocyte complexes, activated regulatory T cells (Treg), and CD8+ memory-like subset. Emerging AML cells remodels the BM immune microenvironment powerfully, leads to immunosuppression by accumulating exhausted/dysfunctional immune effectors, expending immune-activated types, and promoting the formation of suppressive subsets.

Conclusion: Our results provide a comprehensive AML BM immune cell census, which can help to select pinpoint targeted drug and predict efficacy of immunotherapy.

Keywords: Acute myeloid leukemia; Bone marrow; Immune cells; Immune phenotypes; Microenvironment; Myeloid cells; Single-cell RNA sequencing; T lymphocytes.


Conflict of interest statement

The authors declare that they have no competing interests.

Figures

Fig. 1
Fig. 1
Dissection and clustering of AML patient BM cells and healthy donor BM cells. a The UMAP projection of BM cells from 16 AML patients and 4 healthy donors, showing the formation of 22 main clusters, including 3 for T/NK cells (Cluster 0, Cluster 3, and Cluster 17), 3 for B lineage (Cluster 12, Cluster 14, and Cluster 16), 3 for mature myeloid lineage (Cluster 1, Cluster 11, and Cluster 20), 3 for erythroid lineage (Cluster 8, Cluster 18, and Cluster 19), 9 for SP-like cells (Cluster 2, Cluster 4, Cluster 5, Cluster 6, Cluster 7, Cluster 9, Cluster 10, Cluster 13, and Cluster 15), and 1 for non-hematopoietic stromal cells (Cluster 21). Each dot represents to one single cell, and is colored according to cell cluster. b CD3E, CD4, CD8A, CD1C, CD14, NCAM1, and CD79B-expressing (expression value > 0) of across 36,477 BM-derived cells illustrated in UMAP plots. c Histogram of cell-type fractions for each AML patient and healthy donors’ BM cells, colored based on cell type
Fig. 2
Fig. 2
Dissection and clustering of DC-like cells in AML patients and healthy donors. a UMAP plot of DC-like cells from Fig. 1a-represented DC cluster. These DC-like cells can be divided into 5 subsets. b Expression of DC-related genes across the transcriptionally defined DC clusters. c Dot plot of select canonical DC-related genes (cDC1: CLEC9A, ANPEP, and FBXO27; cDC2: CLEC12A, CLEC10A, SIRPA, and DENND3; pDC: IL3RA and JCHAIN) differentially expressed between different DC subsets. d Proportion of 5 DC subsets in total DC cells in each AML patient or healthy donor. Only samples of containing ≥10 DC-like cells were represented. e Dot plot of differentially expressed co-inhibitory and co-stimulation molecule genes. f Dot plot of differentially expressed cytokine genes. g The Kaplan-Meier overall survival curves of TCGA AML patients grouped by specific DC subset (CD206+ DC and CX3CR1+ DC) gene sets and DC-related genes (TGFB1, MRC1, CLEC7A, ITGAX, ITGB2, CX3CR1, CCL22, and TNFSF8). + represents censored observations, and P value was calculated by multivariate Cox regression
Fig. 3
Fig. 3
Dissection and clustering of mature myeloid lineages in AML patients and healthy donors. a UMAP plot of Monocyte/Macrophages from Fig. 1a-represented Mono/Mac cluster. These mature myeloid cells can be divided into 9 subsets without CD14+CD3D+ subset. b Dot plot of differentially key cell-type marker genes. c Heatmap of mean expression of selected cytokine genes in each cell subset. d Proportion of 9 mature myeloid subsets in myeloid population subsets in each AML patient or healthy donor. Only samples of containing ≥20 myeloid cells were represented. e The Kaplan-Meier overall survival curves of TCGA AML patients grouped by specific MACRO+ subset gene sets and myeloid-related genes (CD163, ITGAM, MMP9, and CCL5). + represents censored observations, and P value was calculated by multivariate Cox regression
Fig. 4
Fig. 4
Diversity of T/NK subsets revealed by scRNA-seq analysis. a UMAP plot of sc-RNAseq data (n = 10,096 cells) showed 10 distinct clusters. b Dot plot of differently key cell-type marker genes. c Histogram showed the fractions of different cell-type in T/NK populations for each AML patient and healthy donors’ BM cells, colored based on cell type. d Dot plot showed the transcript expression pattern of stimulation molecules and their receptors. e The Kaplan-Meier overall survival curves of TCGA AML patients grouped by specific Treg gene sets, dysfunctional/exhausted-gene set (LAG3, TIGIT, CTLA4, HAVCR2, TOX, PDCD1, CD274, PDCD1LG2), and several genes (CD274, PDCD1LG2, and BATF). + represents censored observations, and P value was calculated by multivariate Cox regression
Fig. 5
Fig. 5
Unique CD4+ subsets revealed by scRNA-seq analysis. a UMAP plot of CD69highCD4+ population and CD69lowCD4+ population. These 2515 cells can be divided into 4 subsets. b Heatmap showing average expression level of cell-type genes expressed by the 4 clusters. c Histogram showed the fractions of different cell-type in CD69highCD4+ population and CD69lowCD4+ population for each AML patient and healthy donors’ BM cells, colored based on cell type. d The branched trajectory of state transition of naïve CD4+ T cells, TH17-like cells, and Treg cells in a two-dimensional state-space inferred by Monocle (version 2.14.0). Each dot corresponded to one single cell, colored according to its cluster label. e Expression maps showing log-normalized expression of typical markers (IL7R, IL2RA, MKI67, KLRB1, FOXP3, and CTLA4) in the differentiation of Naïve CD4+ T to TH17-like cells and/or Treg cells. Data are shown as log-normalized expression. Yellow indicates high expression, dark blue indicates low expression. f Violin plot showing the expression levels of functional genes (IGF1R, RORC, KLRB1, AHNAK, and IL10RA)
Fig. 6
Fig. 6
Dysfunctional/exhausted CD8+-T/NK subsets revealed by scRNA-seq analysis. a UMAP plot of NK/NKT-like population, GNLY+GZMH+CD8+ T population, and GZMK+GZMA+CD8+ T population. These 2901 cells can be divided into 6 subsets. b Dot plot showed the transcript expression pattern of cell-type genes. c Histogram showed the fractions of different cell-type in NK/NKT-like population, GNLY+GZMH+CD8+ T population, and GZMK+GZMA+CD8+ T population for each AML patient and healthy donors’ BM cells, colored based on cell type. d Dot plot showed the transcript expression pattern of memory-like CD8+ T-related genes

References

    1. Gebru MT, Wang H-G. Therapeutic targeting of FLT3 and associated drug resistance in acute myeloid leukemia. J Hematol Oncol. 2020;13(1):155. doi: 10.1186/s13045-020-00992-1. - DOI - PMC - PubMed
    1. Shafat MS, Gnaneswaran B, Bowles KM, Rushworth SA. The bone marrow microenvironment - home of the leukemic blasts. Blood Rev. 2017;31(5):277–286. doi: 10.1016/j.blre.2017.03.004. - DOI - PubMed
    1. Kokkaliaris KD, Scadden DT. Cell interactions in the bone marrow microenvironment affecting myeloid malignancies. Blood Adv. 2020;4(15):3795–3803. doi: 10.1182/bloodadvances.2020002127. - DOI - PMC - PubMed
    1. Chen Y, Hoffmeister LM, Zaun Y, Arnold L, Schmid KW, Giebel B, Klein-Hitpass L, Hanenberg H, Squire A, Reinhardt HC, Dührsen U, Bertram S, Hanoun M. Acute myeloid leukemia–induced remodeling of the human bone marrow niche predicts clinical outcome. Blood Adv. 2020;4(20):5257–5268. doi: 10.1182/bloodadvances.2020001808. - DOI - PMC - PubMed
    1. Miraki-Moud F, Anjos-Afonso F, Hodby KA, Griessinger E, Rosignoli G, Lillington D, Jia L, Davies JK, Cavenagh J, Smith M, Oakervee H, Agrawal S, Gribben JG, Bonnet D, Taussig DC. Acute myeloid leukemia does not deplete normal hematopoietic stem cells but induces cytopenias by impeding their differentiation. Proc Natl Acad Sci U S A. 2013;110(33):13576–13581. doi: 10.1073/pnas.1301891110. - DOI - PMC - PubMed

LinkOut - more resources