. 2021 Mar 2:10:e62800.
doi: 10.7554/eLife.62800.

Mapping immune variation and var gene switching in naive hosts infected with Plasmodium falciparum

Affiliations

Mapping immune variation and var gene switching in naive hosts infected with Plasmodium falciparum

Kathryn Milne et al. Elife. .

Abstract

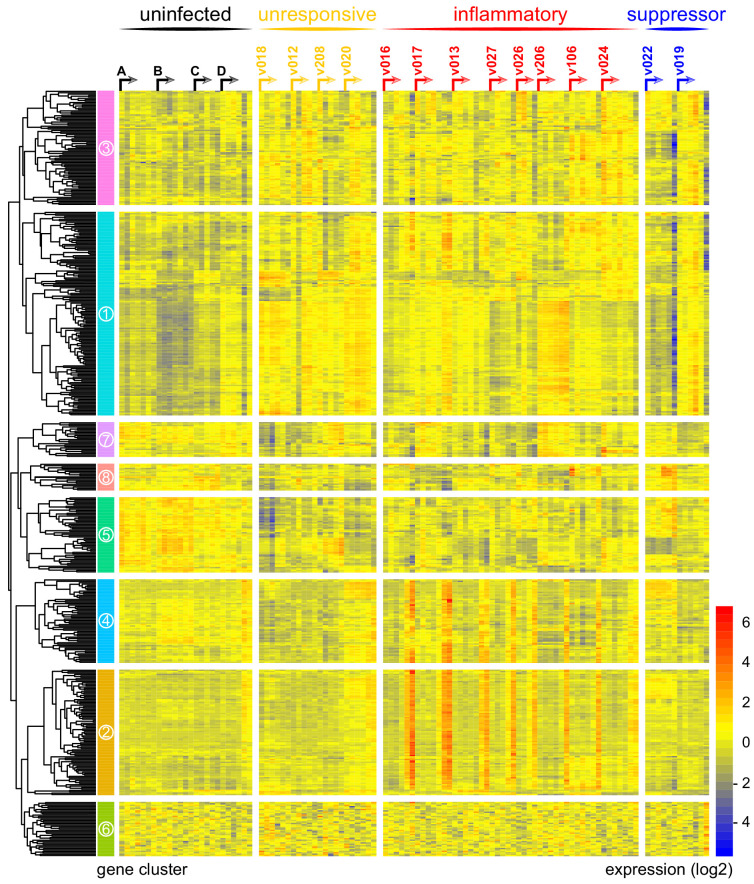
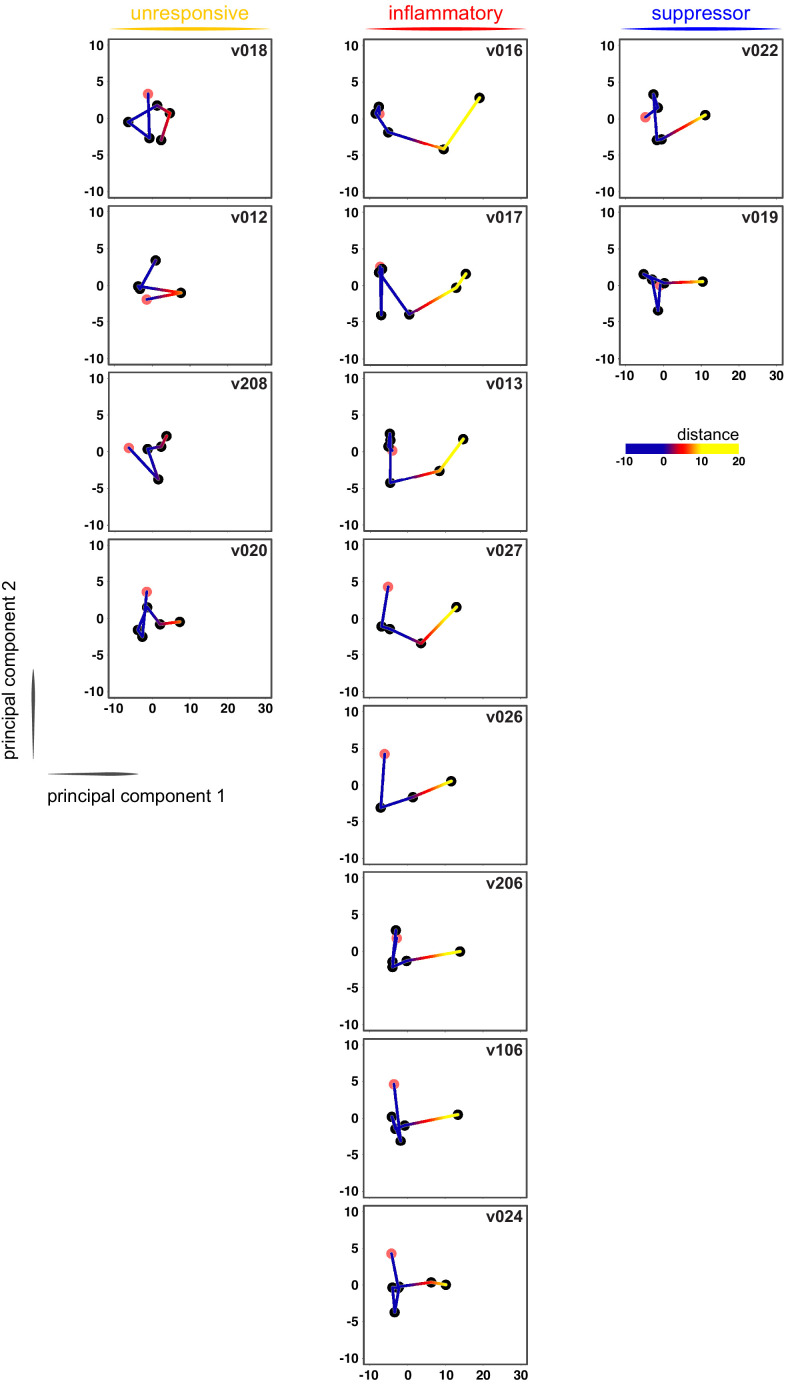
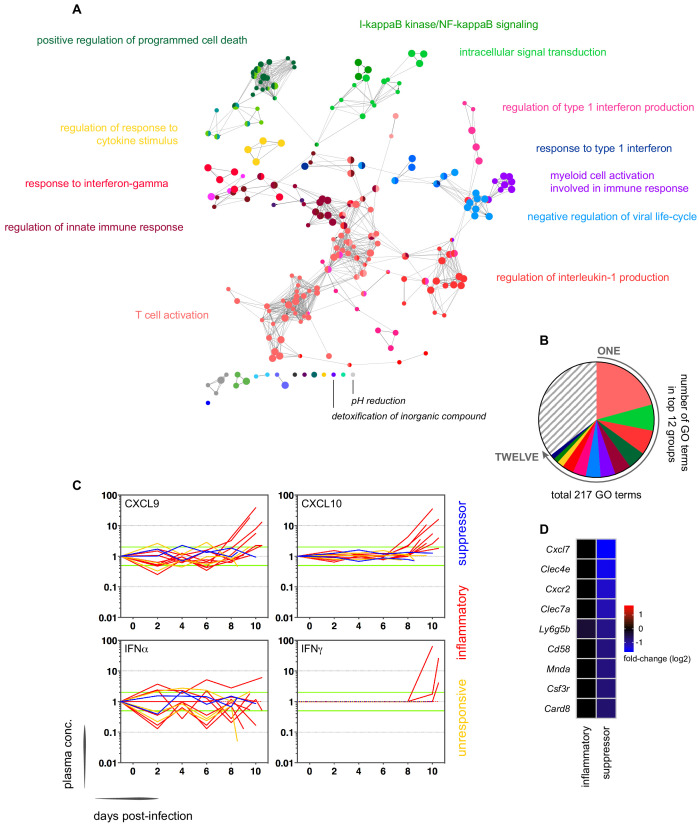
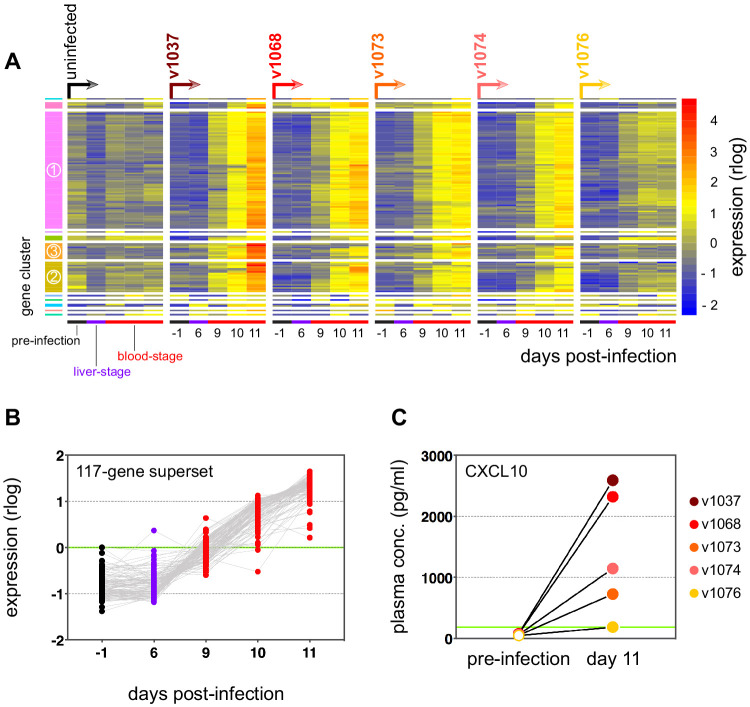
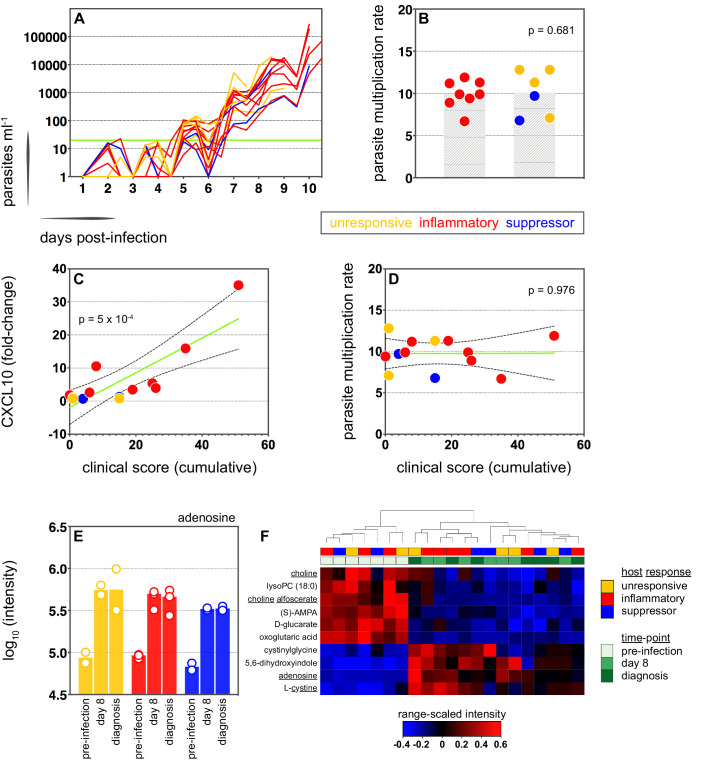
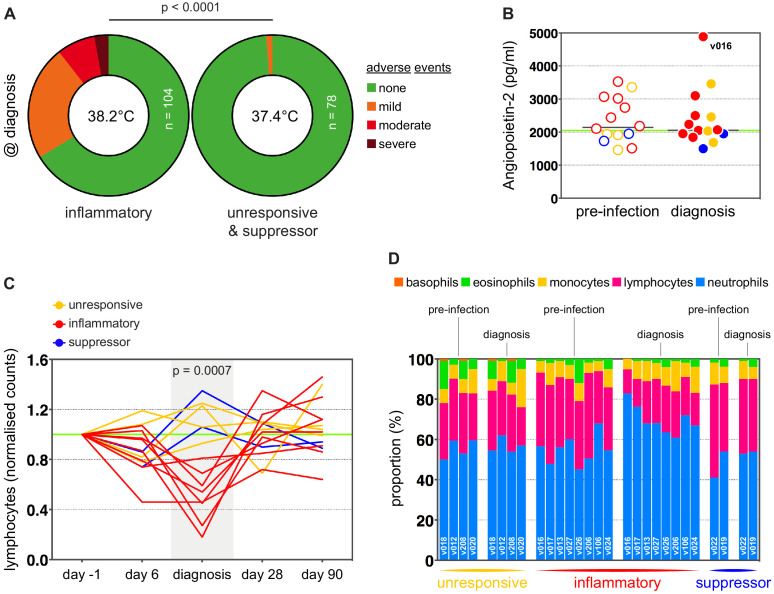
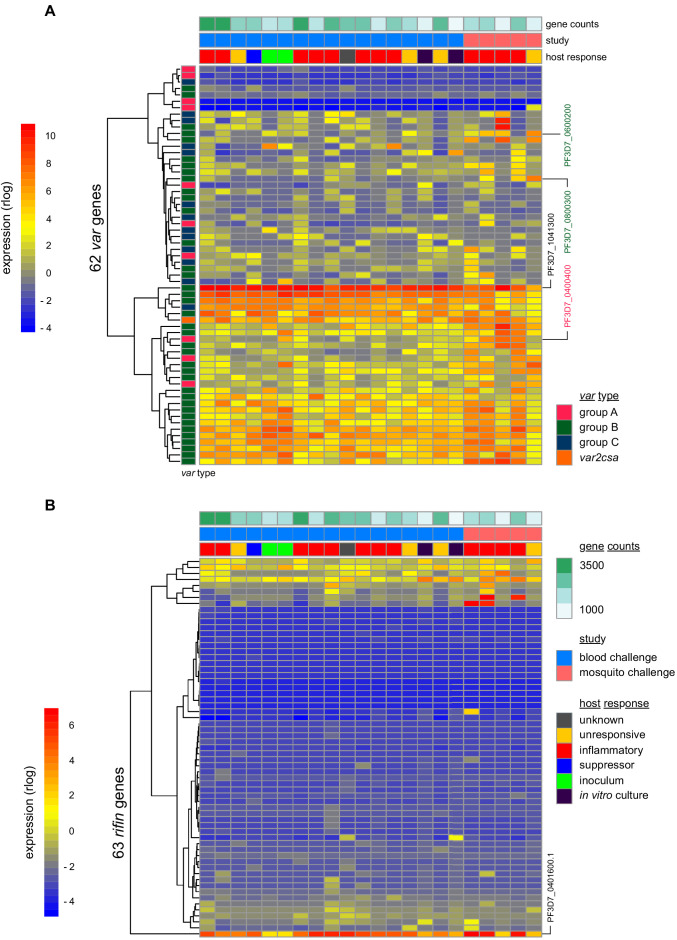
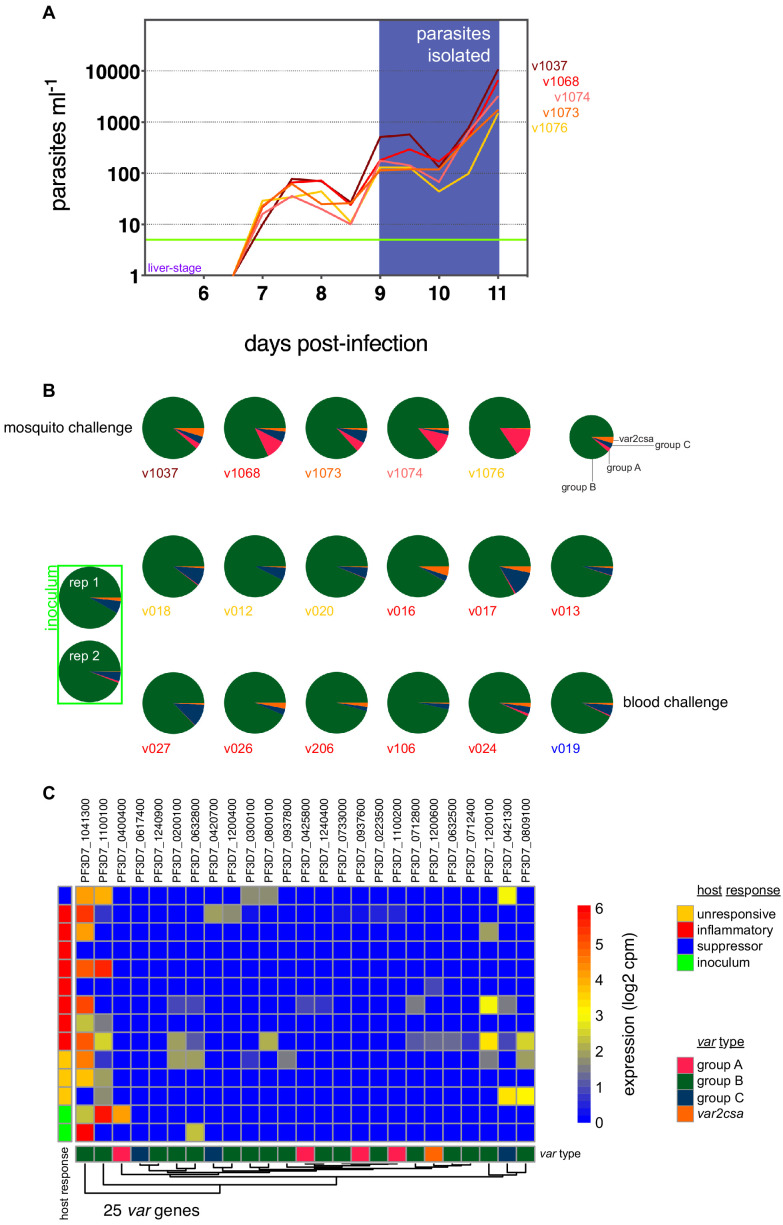
Falciparum malaria is clinically heterogeneous and the relative contribution of parasite and host in shaping disease severity remains unclear. We explored the interaction between inflammation and parasite variant surface antigen (VSA) expression, asking whether this relationship underpins the variation observed in controlled human malaria infection (CHMI). We uncovered marked heterogeneity in the host response to blood challenge; some volunteers remained quiescent, others triggered interferon-stimulated inflammation and some showed transcriptional evidence of myeloid cell suppression. Significantly, only inflammatory volunteers experienced hallmark symptoms of malaria. When we tracked temporal changes in parasite VSA expression to ask whether variants associated with severe disease rapidly expand in naive hosts, we found no transcriptional evidence to support this hypothesis. These data indicate that parasite variants that dominate severe malaria do not have an intrinsic growth or survival advantage; instead, they presumably rely upon infection-induced changes in their within-host environment for selection.

Keywords: P. falciparum; falciparum malaria; human; human immune variation; immunology; infectious disease; inflammation; metabolomics; microbiology; systems immunology; var gene switching.


Conflict of interest statement

KM, AI, AR, ML, AO, GS, DM, WN, CR, NE, SS, RP, AM, NV, MS, AH, MB, MB, SD, JR, PS No competing interests declared

Figures

Figure 1.
Figure 1.. Immune variation in falciparum malaria.
Log2 expression values of 517 protein-coding genes in whole blood during infection. Genes (rows) are ordered by hierarchical clustering whereas whole blood samples (columns) are ordered by volunteer and time-point (pre-infection to diagnosis, left to right). Arrows start from the pre-infection sample and volunteers are grouped by host response. Uninfected controls demonstrate minimal within-host variation in expression of these genes. Median sample number per volunteer = 6.
Figure 1—figure supplement 1.
Figure 1—figure supplement 1.. Immune quiescence is a common early outcome of infection.
Principal component analysis of the 517-gene superset in whole blood during infection. Each dot represents one time-point (pink is pre-infection) and every volunteer is centred around their own average position through time (mean x-y coordinates set to zero). Each volunteer was analysed independently and distance travelled (relative to average position) measures the magnitude of their immune response.
Figure 2.
Figure 2.. Interferon-stimulated inflammation is the dominant response to blood-stage infection.
(A) Gene ontology network of 2028 genes differentially expressed at diagnosis in the inflammatory group. Each node represents a significantly enriched GO term (adj p<0.05) and node size is determined by significance (bigger nodes have lower p values). Nodes are interconnected according to their relatedness (kappa score >0.4) and grouped if they are connected and share >40% genes. Each functional group is then given a unique colour and the leading GO term in the top 12 groups is highlighted. Two GO terms of interest, which are not part of any functional group, are also shown in italics. (B) The proportion of GO terms in each of the top 12 functional groups; collectively, these account for two thirds of all significantly enriched GO terms in inflammatory volunteers. (C) Plasma concentration of interferon alpha and gamma and interferon-stimulated chemokines (CXCL9 and CXCL10) during infection. One line represents one volunteer (no data for v020) and lines are colour-coded by host response. For each volunteer, all data points are normalised to their own baseline (day −1); horizontal green lines represent a twofold increase or decrease compared to baseline. (D) Log2 fold-change of nine immune genes involved in myeloid cell differentiation and activation in whole blood at diagnosis. Data are presented relative to pre-infection samples and all genes are significantly downregulated in the two suppressor volunteers (adj p<0.05).
Figure 2—figure supplement 1.
Figure 2—figure supplement 1.. Sporozoites do not trigger a systemic transcriptional response in human malaria.
(A) Rlog expression values of the 117-gene superset in whole blood after mosquito challenge. Genes (rows) are ordered by hierarchical clustering, whereas whole blood samples (columns) are ordered by volunteer and time-point. An uninfected control volunteer displayed minimal within-host variation in expression of these genes. Sample number per volunteer = 5. (B) Rlog expression values of the 117-gene superset shown as the mean of all infected volunteers; each dot represents a single gene. (A and B) Day 6 was chosen as the end point of liver-stage infection as there were no detectable circulating parasites at this time; 24 hr later every volunteer was parasitaemic. (C) Plasma concentration of CXCL10 after mosquito challenge; one dot represents one volunteer and the green line shows the mean concentration in the uninfected control.
Figure 3.
Figure 3.. Systemic inflammation coincides with the onset of clinical symptoms.
(A) Parasite growth curves colour-coded by host response; each line represents one volunteer. Blood samples were collected every 12 hr for qPCR analysis of circulating parasite density and the horizontal green line represents the lower limit of quantification (20 parasites ml−1). (B) Parasite multiplication rates colour-coded by host response; each dot represents one volunteer and shaded areas show the mean value. A Mann Whitney test was used to ask whether the parasite multiplication rate observed in the inflammatory group was different to all other volunteers (p value is shown). (C and D) Linear regression of CXCL10 (C) or parasite multiplication rate (D) plotted against clinical score (the sum of adverse events during infection). CXCL10 fold-change measures plasma concentration at diagnosis over baseline (day −1). One dot represents one volunteer (no data for v020) and dots are colour-coded by host response. The green line represents the best-fit model (p value of the slope is shown) and dashed lines are the 95% confidence intervals. (E) Log10 transformed intensity values of adenosine in plasma during infection. An authentic standard was run in tandem with all samples to validate adenosine detection. (F) Range-scaled intensity values of 10 plasma metabolites that were differentially abundant during infection. Metabolites (rows) and samples (columns) are ordered by hierarchical clustering. Note that an authentic standard was used to validate detection of all underlined metabolites and the full name for oxoglutaric acid is 4-hydroxy-2-oxoglutaric acid. (E and F) Only plasma samples from the most inflammatory and symptomatic volunteers (v016, v017, and v013), the suppressor volunteers (v022 and v019) and two unresponsive volunteers (v018 and v208) were analysed for metabolite abundance.
Figure 3—figure supplement 1.
Figure 3—figure supplement 1.. Adverse events after blood challenge.
Data on symptoms were collected every 12 hr from day 2 post-infection either on diary cards (self-reporting) or during clinic visits. Adverse events were graded as mild (transient or mild discomfort – no medical intervention required); moderate (mild to moderate limitation in activity – no or minimal medical intervention required); or severe (marked limitation in activity – may require medical intervention).
Figure 3—figure supplement 2.
Figure 3—figure supplement 2.. Inflammation is linked to hallmark symptoms of malaria.
(A) Proportion of mild, moderate and severe adverse events at diagnosis. For each volunteer, adverse events were recorded for 13 clinical categories and these were summed to give a clinical score at diagnosis (mild = 1, moderate = 2 and severe = 3). A Fisher’s exact test was then used to assess the significance of the difference in clinical score between the inflammatory group and unresponsive/suppressor hosts (p value is shown and n = total number of data-points recorded). The maximum core body temperature measured in any volunteer within a group is shown in each doughnut plot. (B) Plasma concentration of Angiopoietin-2 comparing pre-infection (open circle) and diagnosis (filled circle) samples. Each dot represents one volunteer and dots are colour-coded by host response. The green line represents the mean reference value measured in healthy human donors (heparin plasma samples). (C) Lymphocyte counts in whole blood during infection; each line represents one volunteer and lines are colour-coded by host response. Data are shown as fold-change over baseline (day −1). A Mann Whitney test was used to assess the significance of differences in cell counts between inflammatory volunteers and all other hosts at diagnosis (p value is shown). (D) Five-part differential whole blood counts comparing pre-infection and diagnosis samples. Volunteer numbers are inset into stacked bars and samples are ordered by host response followed by time-point.
Figure 3—figure supplement 3.
Figure 3—figure supplement 3.. A conserved early metabolic signature of falciparum malaria.
Volcano plot showing the 10 plasma metabolites that were differentially abundant during infection. We grouped unresponsive (v018 and v208), inflammatory (v016, v017 and v013), and suppressor (v022 and v019) hosts and grouped two post-infection time-points (day 8 and diagnosis) to identify a conserved and persistent signature, respectively. These samples (n = 14) were tested against pre-infection plasma (n = 7) using an FDR-corrected p value < 0.1. A positive intensity ratio indicates metabolites are more abundant during infection, whereas a negative ratio indicates metabolite depletion. Vertical black dotted lines represent a 1.5-fold change in abundance. Squares with a solid black border show that an authentic standard was run in tandem with the samples to validate metabolite detection.
Figure 4.
Figure 4.. Parasite variants associated with severe disease do not rapidly expand in naive hosts.
(A and B) Rlog expression values of var (A) and rifin (B) genes in the inoculum and diagnosis parasite samples after blood challenge (blue study); parasites obtained from volunteers infected by mosquito bite are also shown (pink study). Genes (rows) are ordered by hierarchical clustering and colour-coded by var type; parasite samples are colour-coded by host response; and in vitro cultured ring-stage parasites are shown for comparison. Two volunteers did not have parasite sequencing data (unresponsive volunteer v208 and suppressor volunteer v022) and the two inoculum samples are technical replicates of one biological sample. The var (PF3D7_1041300) and rifin (PF3D7_0401600) genes dominantly expressed across all samples are labelled. Var genes associated with severe disease (group A variant PF3D7_0400400 and DC8-like variants PF3D7_0600200 and PF3D7_0800300) are also labelled. Gene counts show the number of parasite genes that have at least three uniquely mapping reads; this provides a measure of genome coverage in every sample.
Figure 4—figure supplement 1.
Figure 4—figure supplement 1.. Group B var genes dominate the PfEMP1 landscape in naive hosts.
(A) Parasite growth curves in five volunteers infected by mosquito bite; each line represents one volunteer and the horizontal green line represents the lower limit of detection (five parasites ml−1). On days 9, 10, and 11 post-infection parasites were isolated from whole blood and immediately processed for ex vivo RNA-sequencing – for every volunteer, read counts were pooled from all three time-points to generate a comprehensive parasite transcriptome 2–3 cycles after liver egress. (B) Proportion of read counts that map to groups A, B, C, or E (var2csa) var genes after mosquito challenge (top row) or blood challenge (bottom two rows); parasite samples are colour-coded by host response. Note that the two inoculum samples are a technical replicate of a single biological sample. (C) Log2(cpm) expression values of var gene intron-spanning reads in the inoculum and diagnosis samples after blood challenge. Genes (columns) are ordered by hierarchical clustering and colour-coded by var type; parasite samples by host response.

References

    1. Abdi AI, Hodgson SH, Muthui MK, Kivisi CA, Kamuyu G, Kimani D, Hoffman SL, Juma E, Ogutu B, Draper SJ, Osier F, Bejon P, Marsh K, Bull PC. Plasmodium falciparum malaria parasite var gene expression is modified by host antibodies: longitudinal evidence from controlled infections of kenyan adults with varying natural exposure. BMC Infectious Diseases. 2017;17:585. doi: 10.1186/s12879-017-2686-0. - DOI - PMC - PubMed
    1. Ademolue TW, Aniweh Y, Kusi KA, Awandare GA. Patterns of inflammatory responses and parasite tolerance vary with malaria transmission intensity. Malaria Journal. 2017;16:145. doi: 10.1186/s12936-017-1796-x. - DOI - PMC - PubMed
    1. Amit-Avraham I, Pozner G, Eshar S, Fastman Y, Kolevzon N, Yavin E, Dzikowski R. Antisense long noncoding RNAs regulate var gene activation in the malaria parasite Plasmodium falciparum. PNAS. 2015;112:E982–E991. doi: 10.1073/pnas.1420855112. - DOI - PMC - PubMed
    1. Azasi Y, Lindergard G, Ghumra A, Mu J, Miller LH, Rowe JA. Infected erythrocytes expressing DC13 PfEMP1 differ from recombinant proteins in EPCR-binding function. PNAS. 2018;115:1063–1068. doi: 10.1073/pnas.1712879115. - DOI - PMC - PubMed
    1. Bachmann A, Petter M, Krumkamp R, Esen M, Held J, Scholz JA, Li T, Sim BK, Hoffman SL, Kremsner PG, Mordmüller B, Duffy MF, Tannich E. Mosquito passage dramatically changes var gene expression in controlled human Plasmodium falciparum infections. PLOS Pathogens. 2016;12:e1005538. doi: 10.1371/journal.ppat.1005538. - DOI - PMC - PubMed

Publication types

MeSH terms

Associated data