. 2021 May;126(5):996-1008.
doi: 10.1016/j.bja.2020.12.040. Epub 2021 Feb 26.

Electrophysiological signatures of acute systemic lipopolysaccharide-induced inflammation: potential implications for delirium science

Affiliations

Electrophysiological signatures of acute systemic lipopolysaccharide-induced inflammation: potential implications for delirium science

Ziyad W Sultan et al. Br J Anaesth. 2021 May.

Abstract

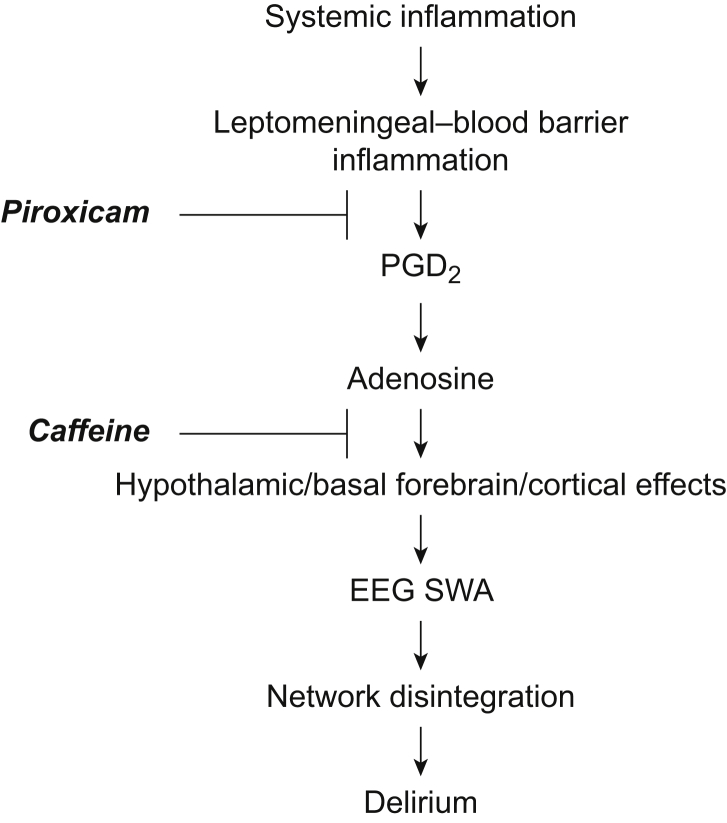
Background: Novel preventive therapies are needed for postoperative delirium, which especially affects older patients. A mouse model is presented that captures inflammation-associated cortical slow wave activity (SWA) observed in patients, allowing exploration of the mechanistic role of prostaglandin-adenosine signalling.

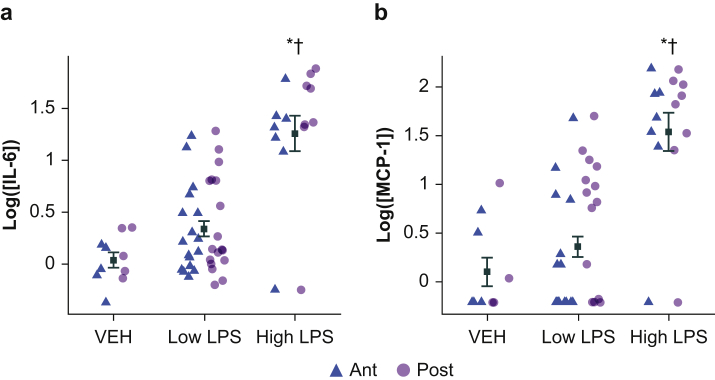
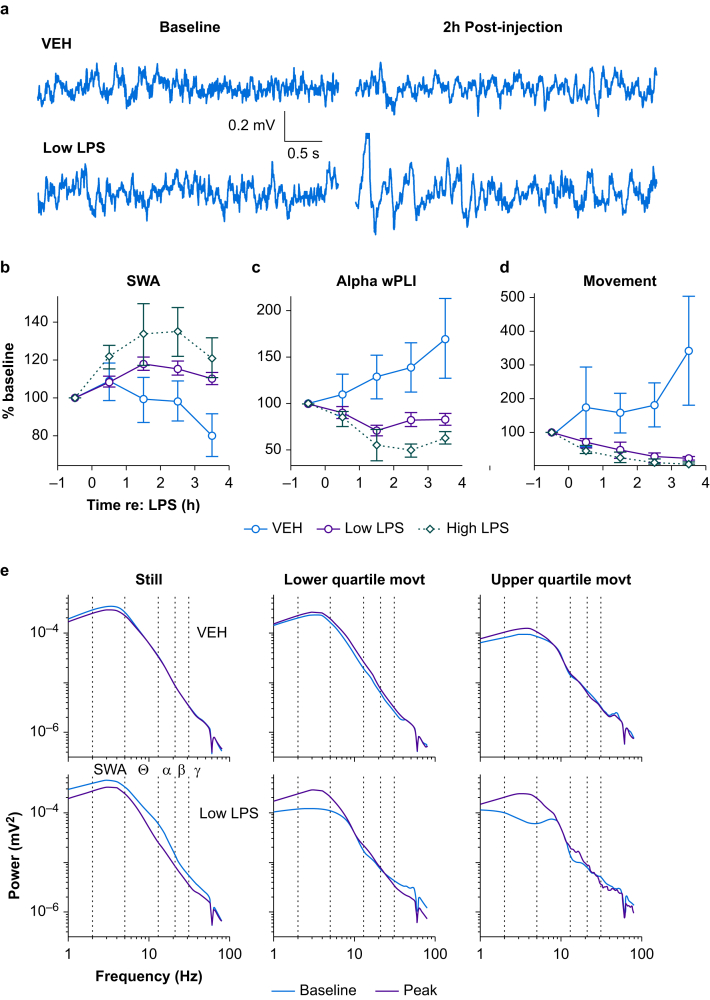
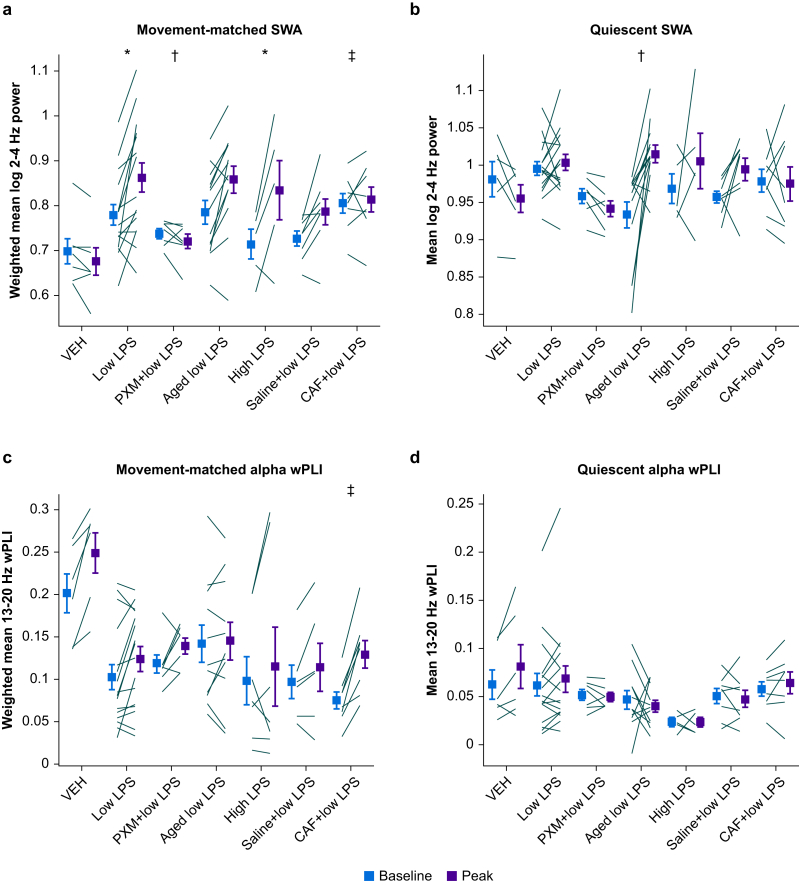
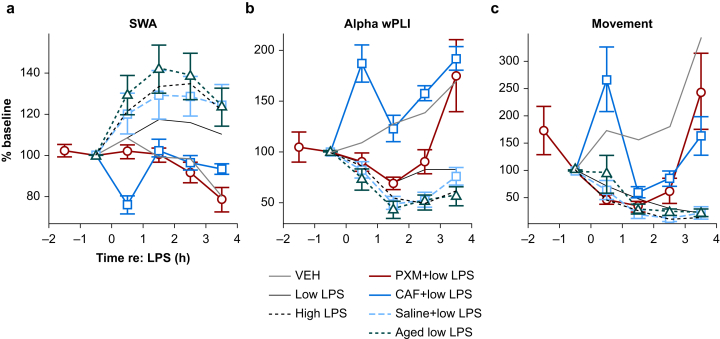
Methods: EEG and cortical cytokine measurements (interleukin 6, monocyte chemoattractant protein-1) were obtained from adult and aged mice. Behaviour, SWA, and functional connectivity were assayed before and after systemic administration of lipopolysaccharide (LPS)+piroxicam (cyclooxygenase inhibitor) or LPS+caffeine (adenosine receptor antagonist). To avoid the confounder of inflammation-driven changes in movement which alter SWA and connectivity, electrophysiological recordings were classified as occurring during quiescence or movement, and propensity score matching was used to match distributions of movement magnitude between baseline and post-LPS administration.

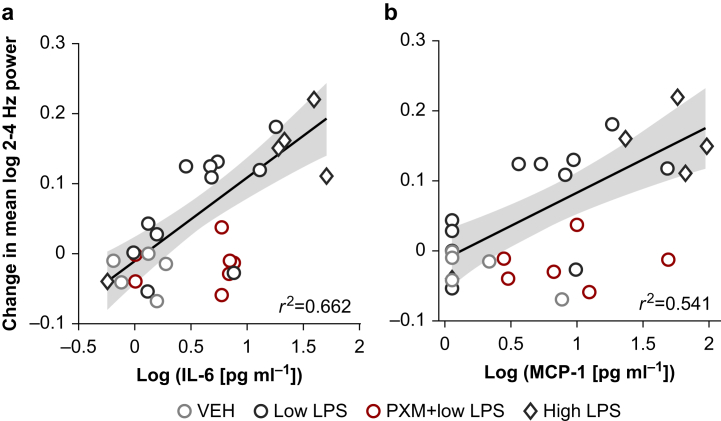
Results: LPS produces increases in cortical cytokines and behavioural quiescence. In movement-matched data, LPS produces increases in SWA (likelihood-ratio test: χ2(4)=21.51, P<0.001), but not connectivity (χ2(4)=6.39, P=0.17). Increases in SWA associate with interleukin 6 (P<0.001) and monocyte chemoattractant protein-1 (P=0.001) and are suppressed by piroxicam (P<0.001) and caffeine (P=0.046). Aged animals compared with adult animals show similar LPS-induced SWA during movement, but exaggerated cytokine response and increased SWA during quiescence.

Conclusions: Cytokine-SWA correlations during wakefulness are consistent with observations in patients with delirium. Absence of connectivity effects after accounting for movement changes suggests decreased connectivity in patients is a biomarker of hypoactivity. Exaggerated effects in quiescent aged animals are consistent with increased hypoactive delirium in older patients. Prostaglandin-adenosine signalling may link inflammation to neural changes and hence delirium.

Keywords: cytokines; delirium; electroencephalography; functional connectivity; slow wave activity.


Figures

Fig 1
Fig 1
Proinflammatory cytokine levels in neocortex after lipopolysaccharide treatment. (a) Shown are IL-6 protein concentrations measured via enzyme-linked immunosorbent assay in neocortical homogenate samples from mice (including animals with and without EEG implant) euthanised 4 h after LPS injection. Each point represents log IL-6 concentration (pg ml−1) from samples obtained bilaterally from anterior (ant) or posterior cortex (post). Overlaid symbols (black) represent the within-group mean across all samples. Error bars represent ± standard error of the mean. (b) MCP-1 protein concentration values are shown. MCP-1 samples below the threshold of detection were set to the square root of the lowest observed quantity (1.13). ∗Indicates significant difference from VEH. Indicates significant difference from low LPS. IL-6, interleukin 6; LPS, lipopolysaccharide; MCP-1, monocyte chemoattractant protein-1; VEH, vehicle.
Fig 2
Fig 2
Generalised slowing of EEG and disrupted functional connectivity after lipopolysaccharide injection. (a) Representative time-domain EEG signals during the pre-injection baseline hour (left) and 2 h post-injection (right) are shown for animals that received either a saline ‘vehicle’ (top) or 25 μg kg−1 ‘low’ LPS injection (bottom). Traces were selected based on having mean SWA values approximately equal to the mean SWA over the entire hour. (b) The time series of SWA (2–4 Hz) normalised to mean spectral power (2–80 Hz) are shown for the different LPS doses. Symbols represent the mean percent change in SWA from baseline across all animals at each LPS dose at each recording hour. Error bars represent plus or minus standard error of the mean. (c) Time series of alpha band (13–20 Hz) anterior-posterior wPLI, a measure of functional connectivity. (d) The time series of movement for each LPS dose is shown. Symbols represent the mean percent change in movement from baseline across all animals at each dose of LPS at each recording hour. Error bars represent plus or minus standard error of the mean. (e) Example EEG power spectra separated according to movement magnitude. Power spectra were calculated in overlapping 4-s windows and aligned with movement epochs, then data were binned into quiescence (i.e. zero movement, left), lower quartile movement (middle), or upper quartile movement (right), and averaged. Pre-injection spectra (‘Baseline’) and average spectra of 1–3 h post-injection (‘Peak’), averaged across four EEG channels, are shown from animals that received either vehicle (top) or a 25 μg kg−1 ‘low’ dose of LPS (bottom). LPS, lipopolysaccharide; movt, movement; SWA, slow wave activity; VEH, vehicle; wPLI, weighted phase lag index.
Fig 3
Fig 3
Changes in slow wave activity and alpha band wPLI during movement or quiescence. (a) Movement-matched SWA values at baseline or peak LPS. Lines indicate mean log SWA values for individual animals and symbols represent group averages. Error bars indicate plus or minus standard error of the mean. (b) SWA during quiescence. (c) Movement-matched alpha band wPLI. (d) Alpha wPLI during quiescence. ∗Indicates significant difference of differences from vehicle. Indicates significant difference of differences from low LPS. Indicates significant difference of differences from saline+low LPS. CAF, caffeine citrate; LPS, lipopolysaccharide; PXM, piroxicam; SWA, slow wave activity; VEH, vehicle; wPLI, weighted phase lag index.
Fig 4
Fig 4
Cytokine correlations with changes in movement-matched slow wave activity. (a) Scatterplot of the change in movement-matched SWA from baseline to peak LPS vs log IL-6 concentration. Markers represent values for individual animals. The line indicates the polynomial least-squares fit (using the MATLAB function ‘regress’) for LPS-only groups, and the shading indicates the 95% prediction interval of the regression line. The r value for the fit is also indicated. (b) Scatterplot of the change in movement-matched SWA from baseline to peak vs log MCP-1 concentration. IL-6, interleukin-6; LPS, lipopolysaccharide; MCP-1, monocyte chemoattractant protein-1; PXM, piroxicam; SWA, slow wave activity; VEH, vehicle.
Fig 5
Fig 5
EEG and movement time course summary across groups. (a) The time series of SWA (2–4 Hz) normalised to mean spectral power (2–80 Hz) are shown for all LPS groups (vehicle, low LPS, and high LPS are the same as in Fig. 2). Symbols represent the mean percent change in SWA from baseline across all animals at each LPS dose at each recording hour. Error bars represent plus or minus standard error of the mean. (b) Gamma power time series. (c) Alpha wPLI time series. (d) Movement time series. Bars indicate plus or minus standard error of the mean. CAF, caffeine citrate; LPS, lipopolysaccharide; PXM, piroxicam; SWA, slow wave activity; VEH, vehicle; wPLI, weighted phase lag index.
Fig 6
Fig 6
Working model of inflammation-driven slow wave activity. Our working model of the generation of wakeful SWA relevant to delirium begins with systemic inflammation leading to leptomeningeal–blood barrier inflammation, release of prostaglandin D2 and, via prostaglandin D receptor activation, release of adenosine. The enrichment of prostaglandin D receptors on the basal forebrain and hypothalamus suggests that adenosine then acts at the nearby arousal centres to promote sleep, and cortical SWA during wakefulness. PGD2, prostaglandin D2; SWA, slow wave activity.

References

    1. Sanders R.D. Hypothesis for the pathophysiology of delirium: role of baseline brain network connectivity and changes in inhibitory tone. Med Hypotheses. 2011;77:140–143. - PubMed
    1. Cunningham C., Maclullich A.M.J. At the extreme end of the psychoneuroimmunological spectrum: delirium as a maladaptive sickness behaviour response. Brain Behav Immun. 2013;28:1–13. - PMC - PubMed
    1. Griffin É.W., Skelly D.T., Murray C.L., Cunningham C. Cyclooxygenase-1-dependent prostaglandins mediate susceptibility to systemic inflammation-induced acute cognitive dysfunction. J Neurosci. 2013;33:15248–15258. - PMC - PubMed
    1. Ramanan V.K., Risacher S.L., Nho K. GWAS of longitudinal amyloid accumulation on 18F-florbetapir PET in Alzheimer’s disease implicates microglial activation gene IL1RAP. Brain. 2015;138:3076–3088. - PMC - PubMed
    1. Whittington R.A., Planel E., Terrando N. Impaired resolution of inflammation in Alzheimer’s disease: a review. Front Immunol. 2017;8:1464. - PMC - PubMed