. 2021 Jun 15;89(12):1127-1137.
doi: 10.1016/j.biopsych.2020.12.024. Epub 2021 Jan 9.

Examining Sex-Differentiated Genetic Effects Across Neuropsychiatric and Behavioral Traits

Collaborators, Affiliations

Examining Sex-Differentiated Genetic Effects Across Neuropsychiatric and Behavioral Traits

Joanna Martin et al. Biol Psychiatry. .

Abstract

Background: The origin of sex differences in prevalence and presentation of neuropsychiatric and behavioral traits is largely unknown. Given established genetic contributions and correlations, we tested for a sex-differentiated genetic architecture within and between traits.

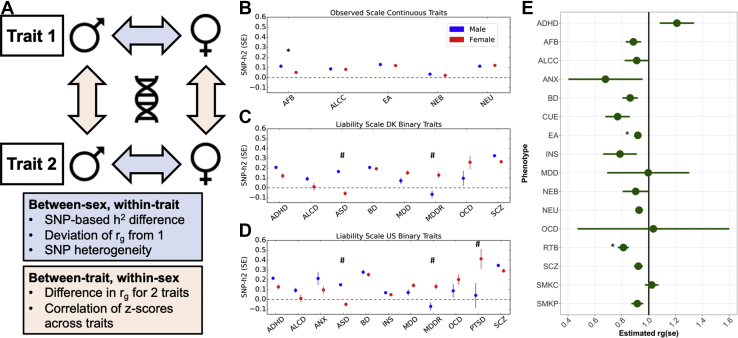
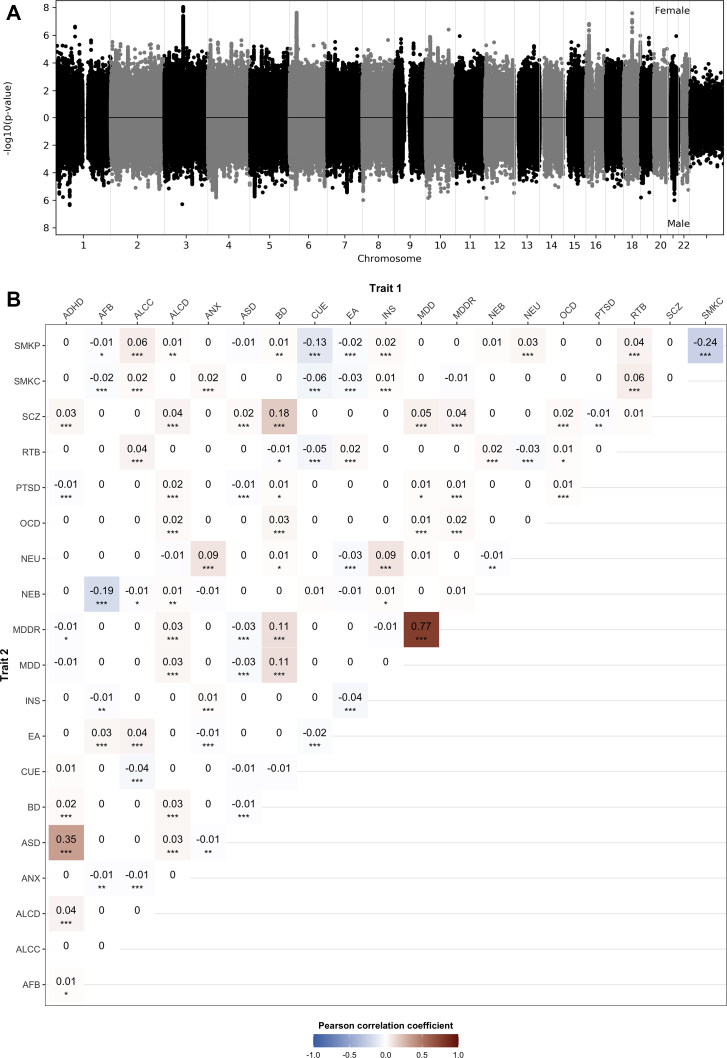
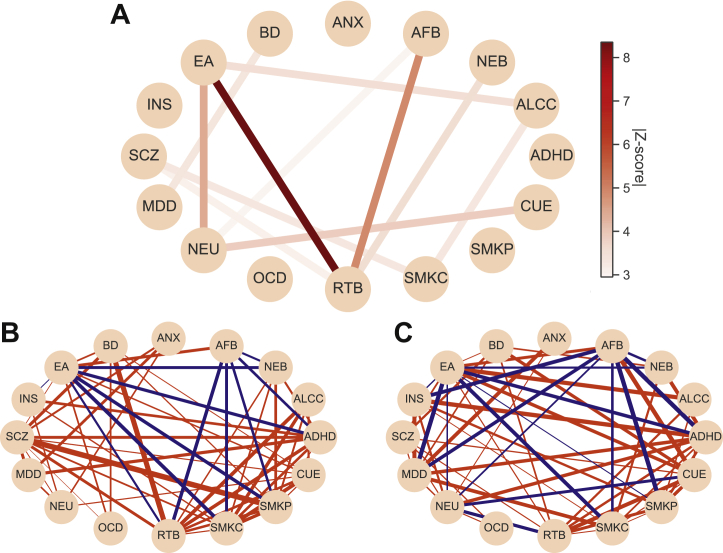
Methods: Using European ancestry genome-wide association summary statistics for 20 neuropsychiatric and behavioral traits, we tested for sex differences in single nucleotide polymorphism (SNP)-based heritability and genetic correlation (rg < 1). For each trait, we computed per-SNP z scores from sex-stratified regression coefficients and identified genes with sex-differentiated effects using a gene-based approach. We calculated correlation coefficients between z scores to test for shared sex-differentiated effects. Finally, we tested for sex differences in across-trait genetic correlations.

Results: We observed no consistent sex differences in SNP-based heritability. Between-sex, within-trait genetic correlations were high, although <1 for educational attainment and risk-taking behavior. We identified 4 genes with significant sex-differentiated effects across 3 traits. Several trait pairs shared sex-differentiated effects. The top genes with sex-differentiated effects were enriched for multiple gene sets, including neuron- and synapse-related sets. Most between-trait genetic correlation estimates were not significantly different between sexes, with exceptions (educational attainment and risk-taking behavior).

Conclusions: Sex differences in the common autosomal genetic architecture of neuropsychiatric and behavioral phenotypes are small and polygenic and unlikely to fully account for observed sex-differentiated attributes. Larger sample sizes are needed to identify sex-differentiated effects for most traits. For well-powered studies, we identified genes with sex-differentiated effects that were enriched for neuron-related and other biological functions. This work motivates further investigation of genetic and environmental influences on sex differences.

Keywords: Behavioral; GWAS; Genetic correlation; Heritability; Psychiatric; Sex differences.


Figures

Figure 1
Figure 1
(A) Schematic illustration of the key analyses used to investigate between-sex, within-trait and between-trait, within-sex differences. (B–D) Estimates of sex stratified SNP-based heritability (SNP-h2) on (B) the observed scale for continuous traits and the liability scale using population prevalence based on (C) Denmark (DK) and (D) the United States (US). Estimates were obtained from linkage disequilibrium score regression. Points represent the estimated SNP-h2 in males (blue) and females (red), while bars represent SE of the SNP-h2 estimates. Significant sex difference in heritability is denoted as follows: ∗p < .0042 (adjusted p value threshold corrected for multiple testing using Bonferroni). #Traits for which significance in difference is not interpretable owing to negative or nonsignificant from zero SNP-h2 value for one of the measurements. (E) Within-trait, between-sex genetic correlation (rg) estimates using linkage disequilibrium score regression. Points represent the estimated rg, and bars represent SE of the rg estimates. Significant deviation from 1 is denoted as follows: ∗p < .0031 (adjusted p value threshold corrected for multiple testing using Bonferroni). ADHD, attention-deficit/hyperactivity disorder; AFB, age at first birth; ALCC, alcohol use; ALCD, alcohol dependence; ANX, anxiety disorders; ASD, autism spectrum disorder; BD, bipolar disorder; CUE, cannabis use (ever); EA, educational attainment; INS, insomnia; MDD, major depressive disorder; MDDR, major depressive disorder recurrent; NEB, number of children ever born; NEU, neuroticism; OCD, obsessive-compulsive disorder; PTSD, posttraumatic stress disorder; RTB, risk-taking behavior; SCZ, schizophrenia; SMKC, smoking (current); SMKP, smoking (previous); SNP, single nucleotide polymorphism.
Figure 2
Figure 2
Sharing of variants with sex-differentiated effects between traits. (A) Miami plot for female-only (top) and male-only (bottom) genome-wide association studies for cannabis use (ever): female cases: N = 17,244; male cases: N = 17,414. For each single nucleotide polymorphism, we computed z scores using Equation 1. (B) Matrix of the Pearson correlation coefficients for pairs of traits. We performed Pearson’s correlation of z scores and a block jackknife approach to estimate the significance of the correlation for all pairs of traits. The estimated significance of the coefficients is denoted as follows: ∗p < .05, ∗∗p < .01, ∗∗∗p < .001. Color coding represents positive (red) or negative (blue) correlation. ADHD, attention-deficit/hyperactivity disorder; AFB, age at first birth; ALCC, alcohol use; ALCD, alcohol dependence; ANX, anxiety disorders; ASD, autism spectrum disorder; BD, bipolar disorder; CUE, cannabis use (ever); EA, educational attainment; INS, insomnia; MDD, major depressive disorder; MDDR, major depressive disorder recurrent; NEB, number of children ever born; NEU, neuroticism; OCD, obsessive-compulsive disorder; PTSD, posttraumatic stress disorder; RTB, risk-taking behavior; SCZ, schizophrenia; SMKC, smoking (current); SMKP, smoking (previous).
Figure 3
Figure 3
(A) Network plot showing between-trait genetic correlations with a significant sex difference as computed by z score. The edge color represents the absolute value of the z score for the difference in genetic correlation between the same 2 phenotypes in females vs. males. Only pairs of traits with false discovery rate corrected q < .05 sex difference are shown. (B, C) Between-trait, within-sex genetic correlation analysis. Network plots for genetic correlation estimates (rg) for pairs of traits in (B) males and (C) females, where each node represents a trait, and the edge represents positive (red) or negative (blue) genetic correlation. The thickness of the edge represents −log10(q value) of correlation significance. Only genetic correlations with false discovery rate corrected q < .05 are shown. Genetic correlations were visualized using the Python package Networkx (50) and Matplotlib (51). ADHD, attention-deficit/hyperactivity disorder; AFB, age at first birth; ALCC, alcohol use; ANX, anxiety disorders; ASD, autism spectrum disorder; BD, bipolar disorder; CUE, cannabis use (ever); EA, educational attainment; INS, insomnia; MDD, major depressive disorder; NEB, number of children ever born; NEU, neuroticism; OCD, obsessive-compulsive disorder; RTB, risk-taking behavior; SCZ, schizophrenia; SMKC, smoking (current); SMKP, smoking (previous).

Comment in

References

    1. Westergaard D., Moseley P., Sørup F.K.H., Baldi P., Brunak S. Population-wide analysis of differences in disease progression patterns in men and women. Nat Commun. 2019;10:1–14. - PMC - PubMed
    1. Traglia M., Bseiso D., Gusev A., Adviento B., Park D.S., Mefford J.A. Genetic mechanisms leading to sex differences across common diseases and anthropometric traits. Genetics. 2017;205:979–992. - PMC - PubMed
    1. Rawlik K., Canela-Xandri O., Tenesa A. Evidence for sex-specific genetic architectures across a spectrum of human complex traits. Genome Biol. 2016;17:166. - PMC - PubMed
    1. Khramtsova E.A., Davis L.K., Stranger B.E. The role of sex in the genomics of human complex traits. Nat Rev Genet. 2019;20:173–190. - PubMed
    1. Naqvi S., Godfrey A.K., Hughes J.F., Goodheart M.L., Mitchell R.N., Page D.C. Conservation, acquisition, and functional impact of sex-biased gene expression in mammals. Science. 2019;365 - PMC - PubMed

Publication types