. 2023 May 1;65(5):e00143-21.
doi: 10.1128/AAC.00143-21. Epub 2021 Mar 1.

Lytic bacteriophages facilitate antibiotic sensitization of Enterococcus faecium

Affiliations

Lytic bacteriophages facilitate antibiotic sensitization of Enterococcus faecium

Gregory S Canfield et al. Antimicrob Agents Chemother. .

Erratum in

Abstract

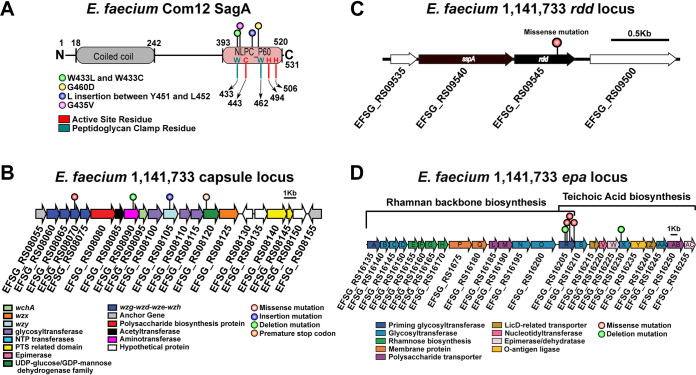
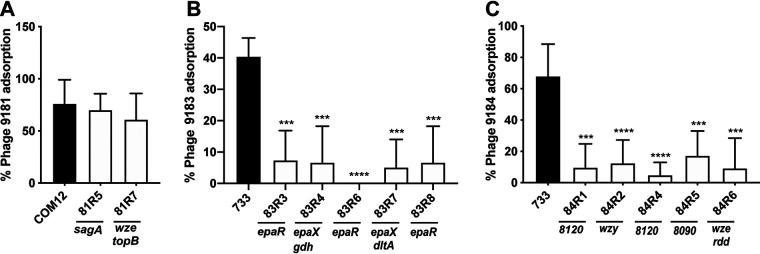
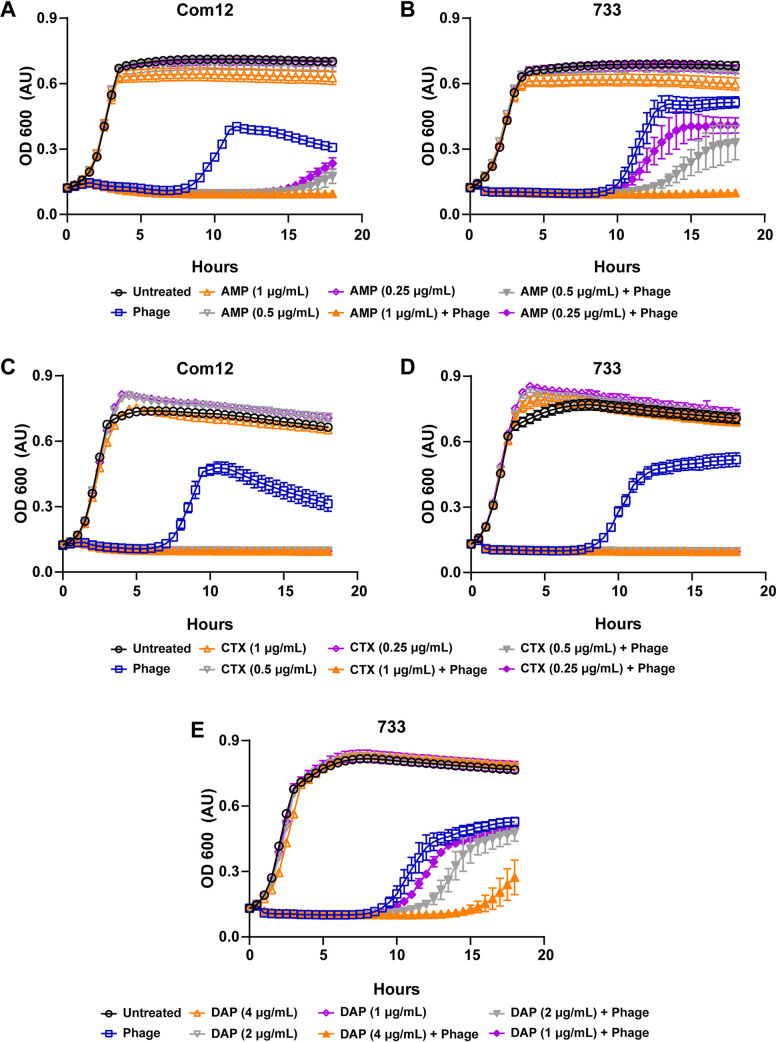
Enterococcus faecium, a commensal of the human intestine, has emerged as a hospital-adapted, multi-drug resistant (MDR) pathogen. Bacteriophages (phages), natural predators of bacteria, have regained attention as therapeutics to stem the rise of MDR bacteria. Despite their potential to curtail MDR E. faecium infections, the molecular events governing E. faecium-phage interactions remain largely unknown. Such interactions are important to delineate because phage selective pressure imposed on E. faecium will undoubtedly result in phage resistance phenotypes that could threaten the efficacy of phage therapy. In an effort to understand the emergence of phage resistance in E. faecium, three newly isolated lytic phages were used to demonstrate that E. faecium phage resistance is conferred through an array of cell wall-associated molecules, including secreted antigen A (SagA), enterococcal polysaccharide antigen (Epa), wall teichoic acids, capsule, and an arginine-aspartate-aspartate (RDD) protein of unknown function. We find that capsule and Epa are important for robust phage adsorption and that phage resistance mutations in sagA, epaR, and epaX enhance E. faecium susceptibility to ceftriaxone, an antibiotic normally ineffective due to its low affinity for enterococcal penicillin binding proteins. Consistent with these findings, we provide evidence that phages potently synergize with cell wall (ceftriaxone and ampicillin) and membrane-acting (daptomycin) antimicrobials to slow or completely inhibit the growth of E. faecium Our work demonstrates that the evolution of phage resistance comes with fitness defects resulting in drug sensitization and that lytic phages could serve as effective antimicrobials for the treatment of E. faecium infections.


Figures

FIG 1
FIG 1
Genome organization and morphogenesis of three previously uncharacterized E. faecium phages. Whole-genome sequencing reveals a modular functional organization of phage 9181, 9183, and 9184 genomes. Open reading frames for each phage were determined by RAST version 2.0 and by the Texas A&M Center for Phage Therapy structural analysis workflow version 2020.01. Colored open reading frames correspond to functional prediction. Beneath the phage genome maps, TEM shows phages 9181, 9183, and 9184 are noncontractile tailed Siphoviridae. The E. faecium host strain for phage 9181 is E. faecium Com12. The host strain for phages 9183 and 9184 is E. faecium 1,141,733.
FIG 2
FIG 2
Comparative genomic analysis identifies two novel enterococcal phage orthoclusters. A comparative genome analysis was performed using OrthoMCL as described previously by Bolocan et al. (16). A phylogenetic proteomic tree was constructed from the OrthoMCL matrix using the Manhattan distance metric and hierarchical clustering using an average linkage with 1,000 iterations. Ninety-nine enterococcal phage genomes available from NCBI were used for comparison to E. faecium phages 9181, 9183, and 9184 (highlighted in red, emphasized by red arrows). Distinct phage orthoclusters are represented by colored boxes. Roman numerals to the right of the shaded boxes signify the phage orthocluster number. Phage orthocluster morphology is indicated by calipers (if known) or an asterisk symbol (if unknown) to the right of the roman numerals.
FIG 3
FIG 3
E. faecium phages demonstrate broad and narrow host ranges and plaque most efficiently on their laboratory host strains. Host ranges of phages 9181, 9183, and 9184 are shown. Phages 9181 and 9183 have a narrow E. faecium host range, while phage 9184 shows a broader host range. Bacteria were susceptible if fewer than 1 × 105 CFU/ml of bacteria were recovered from a phage susceptibility assay. Bacteria were resistant if greater than 1 × 105 CFU/ml of bacteria were recovered from a phage susceptibility assay. (A) Host range for a collection of laboratory strains. (B) Host range for a collection of clinical isolates provided by the clinical microbiology laboratory at the University of Colorado, Anschutz Medical Campus. A white star signifies the E. faecium host strain utilized for phage propagation. Efficiency of plating assay shows that phages 9181 (C) and 9184 (D) plaque most efficiently on their laboratory host strains. Data represent the averages from three replicates ± standard deviations. *, P < 0.05; **, P < 0.01; by unpaired Student's t test.
FIG 4
FIG 4
E. faecium elicits a robust resistance phenotype to phages 9181 and 9183 but variable resistance to phage 9184. (A to C) Representative phage-resistant strains raised against phages 9181 (A), 9183 (B), and 9184 (C). Data show phage susceptibility assays and associated bacterial enumeration of wild-type and phage-resistant mutants in the presence (white bars) or absence (black bars) of phages from three independent experiments. Error bars indicate standard deviations. Phage 9181-resistant (A) and phage 9183-resistant (B) strains exhibit ≥4-log survival in the presence of phages compared to the parental E. faecium Com12 and 1,141,733 (733) strains, respectively. (C) Phage 9184-resistant strains exhibit diverse resistance strength characterized by weak (84R2) and strong (84R6) resistance phenotypes. The dotted line indicates the spontaneous mutation threshold of wild-type E. faecium, which is defined as the mean number of CFU per ml at which spontaneous phage resistance is observed for the wild-type host strain of each phage.
FIG 5
FIG 5
Diverse assortment of mutations confers phage resistance in E. faecium. (A) Protein secondary structure of E. faecium Com12 SagA, consisting of an N-terminal coiled-coil domain (residues 18 to 242) and C-terminal NlpC_P60 peptidoglycan hydrolase domain (residues 393 to 520). Displayed above the protein structure are colored lollipops denoting the site of mutations within NlpC_P60 domain of phage 9181-resistant mutants. Inside and below the protein structure are colored one-letter amino acid abbreviations and lines, respectively, corresponding to key active-site (red) and peptidoglycan clamp (teal) residues of the NlpC_P60 domain. Abbreviations: W, tryptophan; C, cysteine; H, histidine; G, glycine; D, aspartate; L, leucine; Y, tyrosine; V, valine. (B) Capsule locus mutations are detected in a tyrosine kinase (wze), aminotransferase (efsg_rs08090), wzy (efsg_rs08105), and nucleotide sugar dehydrogenase (efsg_rs08120) of phage 9184-resistant mutants. Arrows indicate open reading frames. Arrow colors correspond to colored boxes (bottom left) and indicate predicted open reading frame function (17). Colored lollipops above the arrows corresponding to colored dots (figure bottom right) indicate the mutation type. E. faecium 1,141,733 locus tags are angled below the arrows. (C) A missense mutation is found within a predicted arginine-aspartate-aspartate protein (rdd; black arrow) of one phage 9184-resistant mutant (84R6) of E. faecium 1,141,733. rdd is flanked upstream by a predicted hypothetical protein (white arrow) and signal sequence peptidase A (sspA; black arrow) and downstream by another hypothetical protein (white arrow). E. faecium 1,141,733 locus tags are angled below the arrows. (D) Mutations in predicted teichoic acid biosynthesis genes (epaR and epaX) are identified in phage 9183-resistant mutants of E. faecium 1,141,733 (25). Arrow colors correspond to colored boxes (bottom left) and indicate predicted open reading frame function. Colored lollipops above the arrows corresponding to colored dots (bottom right) indicate the mutation type. E. faecium 1,141,733 locus tags are angled below the arrows. The brackets above the locus correspond the conserved (left) and variable (right) portions of the epa locus proposed by Gueredal et al. to encode the machinery necessary for rhamnopolysaccharide synthesis and wall teichoic acid biosynthesis, respectively (25).
FIG 6
FIG 6
Mutation in the capsule and exopolysaccharide loci limits phage adsorption in E. faecium. Shown is the percent phage adsorption in phage 9181 (A), 9183 (B), and 9184 (C) compared to parental strains E. faecium Com12 and E. faecium 1,141,733. Results represent average percent adsorption and standard deviations from three independent experiments. ***, P < 0.001; ****, P < 0.0001; by unpaired Student's t test.
FIG 7
FIG 7
Phage 9181 and phage 9183 synergize with antibiotics to inhibit the growth of E. faecium. (A to E) E. faecium growth was monitored over 18 h in the presence of phage (open blue squares), subinhibitory concentrations of antibiotics (open orange, gray, and purple triangles or diamonds), both phage and subinhibitory concentrations of antibiotics (filled orange, gray, and purple triangles or diamonds), or medium alone (open black circles). Phage 9181 was used in experiments with E. faecium Com12, while phage 9183 was employed for experiments with 1,141,733. Phages 9181 (A) and 9183 (B) synergize with subinhibitory concentrations of ampicillin (AMP) in a dose-responsive manner to slow the growth of E. faecium Com12 and 1,141,733, respectively. Phages 9181 (C) and 9183 (D) synergize with subinhibitory concentrations of ceftriaxone (CTX) to inhibit the growth of E. faecium Com12 and 1,141,733, respectively. (E) Phage 9183 synergizes with subinhibitory concentrations of daptomycin (DAP) in a dose-responsive manner to inhibit E. faecium 1,141,733. Three technical replicates were performed for each condition tested and the averages plotted. Error bars indicate standard deviations. Shown are the results from one experiment that was replicated in triplicate.

Similar articles

Cited by

References

    1. Arias CA, Murray BE. 2012. The rise of the Enterococcus: beyond vancomycin resistance. Nat Rev Microbiol 10:266–278. 10.1038/nrmicro2761. - DOI - PMC - PubMed
    1. Kristich CJ, Rice LB, Arias CA. 2014. Enterococcal infection—treatment and antibiotic resistance, p 1–62. In Gilmore MS, Clewell DB, Ike Y, Shakar N (ed), Enterococci: from commensals to leading causes of drug resistant infection. Massachusetts Eye and Ear Infirmary, Boston, MA. - PubMed
    1. Beganovic M, Luther MK, Rice LB, Arias CA, Rybak MJ, LaPlante KL. 2018. A review of combination antimicrobial therapy for Enterococcus faecalis bloodstream infections and infective endocarditis. Clin Infect Dis 67:303–309. 10.1093/cid/ciy064. - DOI - PMC - PubMed
    1. Rybak MJ, McGrath BJ. 1996. Combination antimicrobial therapy for bacterial infections. Guidelines for the clinician. Drugs 52:390–405. 10.2165/00003495-199652030-00005. - DOI - PubMed
    1. Fish R, Kutter E, Bryan D, Wheat G, Kuhl S. 2018. Resolving digital staphylococcal osteomyelitis using bacteriophage-a case report. Antibiotics 7:87. 10.3390/antibiotics7040087. - DOI - PMC - PubMed

LinkOut - more resources