. 2021 Apr;31(4):576-591.
doi: 10.1101/gr.267013.120. Epub 2021 Mar 1.

Cellular plasticity balances the metabolic and proliferation dynamics of a regenerating liver

Affiliations

Cellular plasticity balances the metabolic and proliferation dynamics of a regenerating liver

Ullas V Chembazhi et al. Genome Res. 2021 Apr.

Abstract

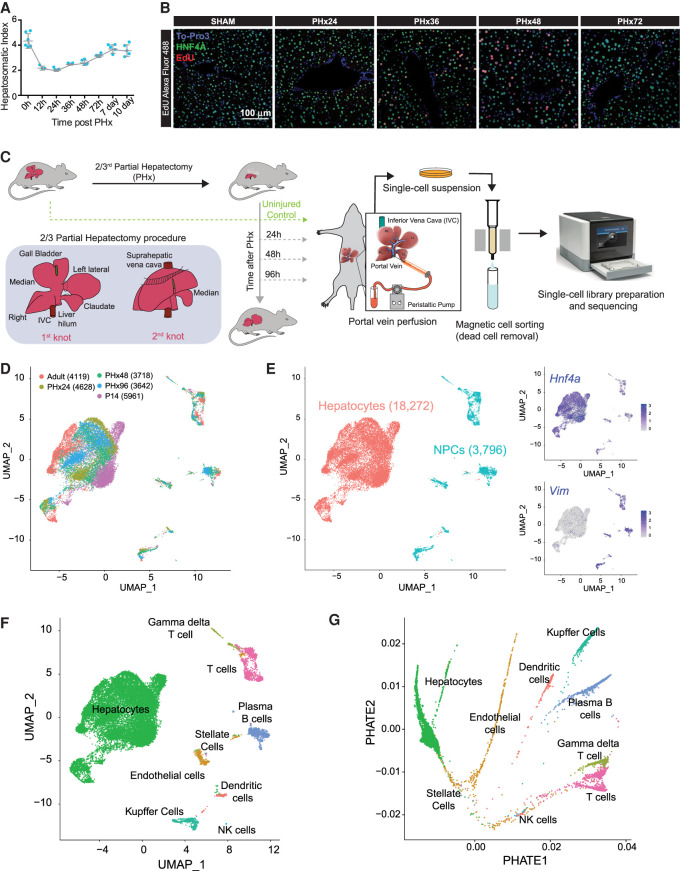
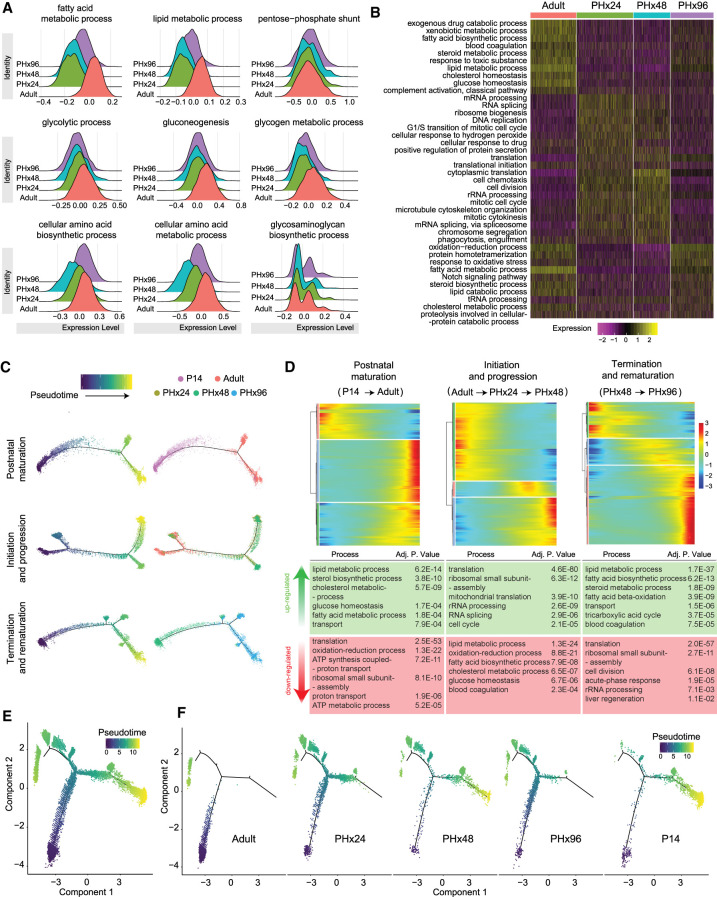
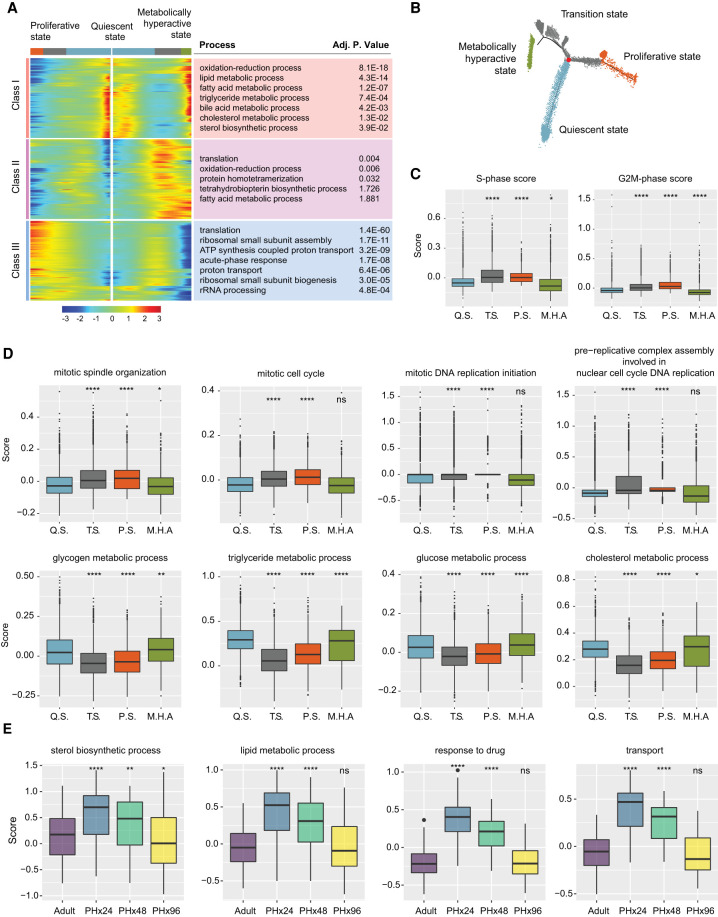
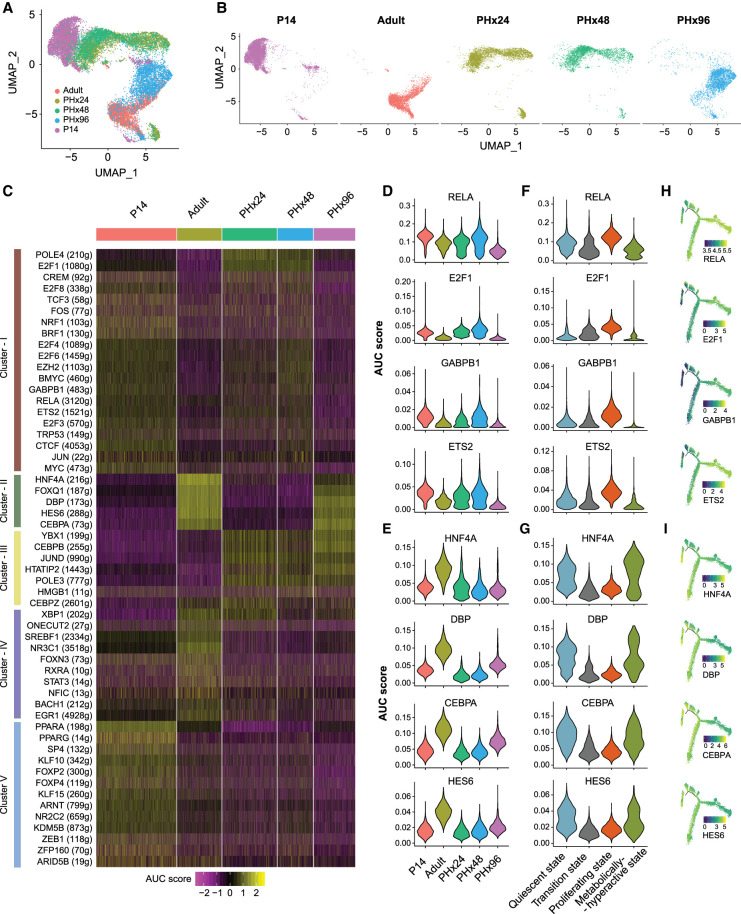
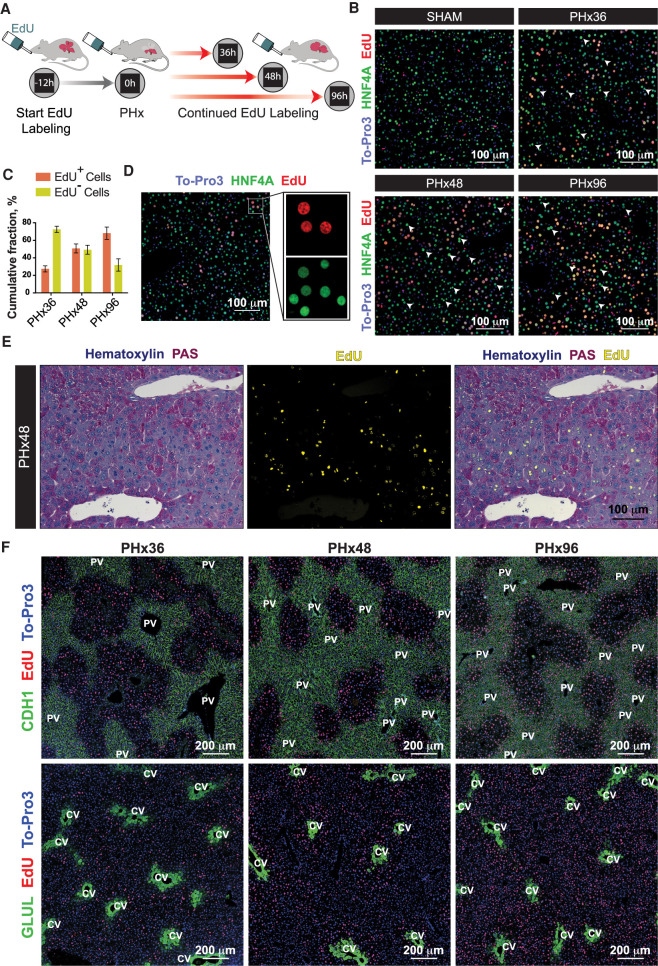
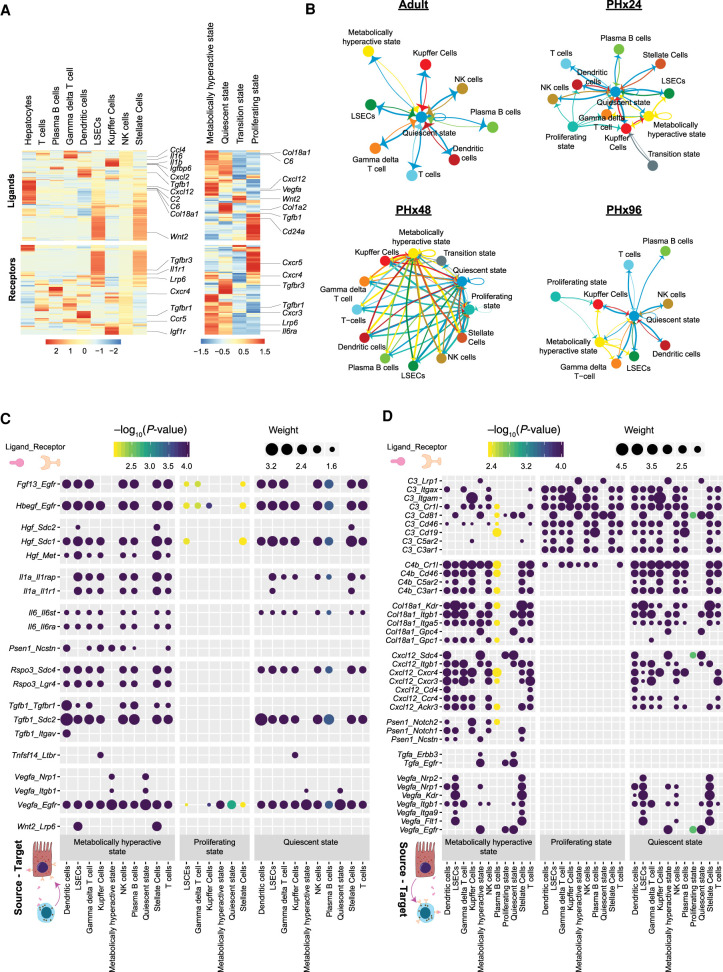
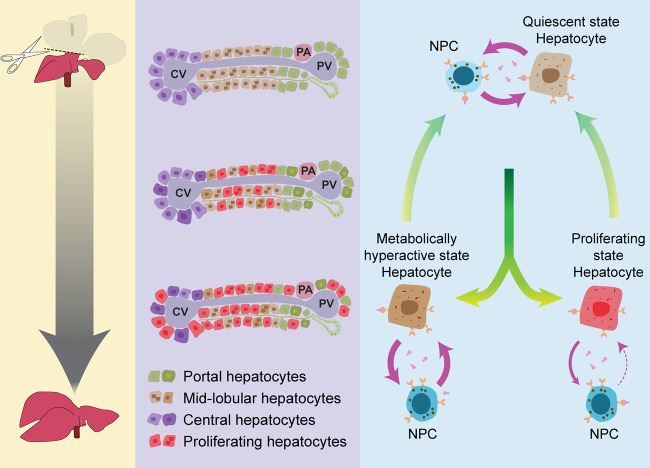
The adult liver has an exceptional ability to regenerate, but how it maintains its specialized functions during regeneration is unclear. Here, we used partial hepatectomy (PHx) in tandem with single-cell transcriptomics to track cellular transitions and heterogeneities of ∼22,000 liver cells through the initiation, progression, and termination phases of mouse liver regeneration. Our results uncovered that, following PHx, a subset of hepatocytes transiently reactivates an early-postnatal-like gene expression program to proliferate, while a distinct population of metabolically hyperactive cells appears to compensate for any temporary deficits in liver function. Cumulative EdU labeling and immunostaining of metabolic, portal, and central vein-specific markers revealed that hepatocyte proliferation after PHx initiates in the midlobular region before proceeding toward the periportal and pericentral areas. We further demonstrate that portal and central vein proximal hepatocytes retain their metabolically active state to preserve essential liver functions while midlobular cells proliferate nearby. Through combined analysis of gene regulatory networks and cell-cell interaction maps, we found that regenerating hepatocytes redeploy key developmental regulons, which are guided by extensive ligand-receptor-mediated signaling events between hepatocytes and nonparenchymal cells. Altogether, our study offers a detailed blueprint of the intercellular crosstalk and cellular reprogramming that balances the metabolic and proliferative requirements of a regenerating liver.


Figures

Figure 1.
Figure 1.
Single-cell analysis of resident hepatic cell populations from immature, adult, and regenerating mouse livers. (A) Time course plot showing the restoration of liver-to-body weight ratio after partial hepatectomy (PHx). The liver recovers its original mass within 7 d after PHx (n = 5). (B) Fluorescent imaging of hepatocyte proliferation measured by in vivo EdU incorporation in post-PHx and Sham livers. White arrows indicate proliferating hepatocytes (colabeled for HNF4A in green, incorporated EdU in red, and nuclei in blue). Images taken under 20× resolution are shown. (C) Overview schematic demonstrating workflow for isolation of mouse liver cells for single-cell RNA sequencing (scRNA-seq). Portal vein perfusion of collagenase containing buffer was used to isolate single liver cells from uninjured P14 pups and adults as well as mice at 24, 48, and 96 h after 2/3rd PHx (n = 1/time point). Single-cell library preparation was performed with whole-cell suspensions individually for each mouse using a 10x Genomics Chromium Single Cell 3′ Reagent Kit (V3 chemistry) after magnetic-activated cell sorting to remove dead cells. The inset details our PHx procedure, showing the position of two knots before excision of the respective liver lobes. (D) Combined UMAP projection of all 22,068 cells identified after QC cutoffs and batch correction. Cells are colored by the batch of origin, and the total number of cells identified from each batch is given in parentheses. (E) Identification of hepatocyte and nonparenchymal cell (NPC) subpopulations. Graph-based clustering in Seurat v3.1 followed by marker gene analysis revealed broad epithelial and nonepithelial cellular identities. Feature plots shown as insets show higher expression of expression of Hnf4a (a hepatocyte marker) and Vim (a nonepithelial marker) especially in populations identified as hepatocytes and NPCs, respectively. (F) Combined UMAP projection of all cells, colored by the annotated cell type. (G) PHATE projection of the ∼22,000 cells from different stages of liver development and regeneration. Cells are colored by annotated cell types from F.
Figure 2.
Figure 2.
Specific hepatocyte population reversibly reprograms to an immature postnatal-like state during regeneration. (A) Ridge plots showing relative scoring on hepatocyte subpopulation using Seurat3.1 demonstrate extensive rewiring of metabolic genes during regeneration. Relative scores were computed based on the lists of genes for each pathway obtained from the Rat Genome Database (RGD). (B) Heat map showing relative scores of the top differentially regulated metabolic pathways. (C) Pseudotime plots demonstrating cellular trajectories during postnatal maturation (including P14 and adult hepatocytes), initiation, and progression (including adult, PHx24 and PHx48 hepatocytes), and termination and rematuration (including PHx48 and PHx96 hepatocytes). Single-cell trajectories were constructed and pseudotime values calculated using Monocle 2. Trajectories are colored by pseudotime (left) and sample identity (right). (D) Heat maps representing modules of genes that co-vary along the pseudotime during postnatal maturation, initiation–progression, and termination–rematuration phases. DAVID-based Gene Ontology (GO) analysis revealed that reversible reprogramming of developmentally regulated gene expression programs essentially reverts postnatal maturation, and this is followed by transitions that reinstate mature hepatic program. The top up-regulated and down-regulated GO terms are described below the respective heat maps. (E) Pseudotime plot indicating cellular trajectories of hepatocytes from all samples. Single-cell trajectories were constructed and pseudotime values were calculated using Monocle 2. Trajectories are colored by pseudotime. (F) Pseudotime plots showing distribution of each sample along combined cellular trajectories shown in C. The adult and P14 hepatocytes present distinct distributions along the trajectory; however, the distribution shifts toward P14 at PHx24–48 and back toward the adult at PHx96.
Figure 3.
Figure 3.
Bifurcation of hepatocyte trajectory during regeneration produces hepatocytes enriched with complementary functions in proliferation and metabolism. (A) Heat map showing bifurcating of gene expression programs executed along the pseudotime after branching. The top GO terms enriched in each class of genes are listed with their corresponding adjusted P-values. (B) Trajectory demonstrating the three distinct states of hepatocytes. The branch point under evaluation is shown in red. (C) Box plots demonstrating cell cycle phase scores calculated from Seurat v3.1 for hepatocytes belonging to different cell states. Q.S., T.S., P.S., and M.H.A. denote quiescent, transition, proliferating, and metabolically hyperactive states, respectively. P-values were derived from a parametric t-test (unpaired). (*) P ≤ 0.05, (****) P ≤ 0.0001. (D) “Proliferating” and “metabolically hyperactive” states uniquely up-regulate proliferation- or metabolism-related functions, respectively. Box plots showing relative scoring of indicated pathways in hepatocytes belonging to different states. P-values were derived from a parametric t-test (unpaired). (*) P ≤ 0.05, (**) P ≤ 0.01, (****) P ≤ 0.0001, (ns) P > 0.05. (E) Metabolically hyperactive state transiently up-regulates metabolism-related functions during regeneration. Box plots showing time point-based scoring of hepatocytes from the metabolically hyperactive state for the indicated pathways. P-values were derived from a parametric t-test (unpaired). (*) P ≤ 0.05, (**) P ≤ 0.01, (****) P ≤ 0.0001, (ns) P > 0.05.
Figure 4.
Figure 4.
Gene regulatory networks are rewired to a postnatal-like state during regeneration. (A) UMAP projection of all hepatocytes based on the AUC scores for each regulon calculated with SCENIC. Cells are colored according to the sample of origin. (B) AUC score-based UMAP projection, grouped according to the sample of origin. Cells are colored according to sample of origin. Adult and PHx96 hepatocytes cluster together, whereas PHx24 and PHx48 hepatocytes cluster together with P14 hepatocytes. (C) Heat map depicting the activities of different regulons that show time point-dependent variations. (D) Violin plot showing distribution of AUC scores for RELA, E2F1, GABP1, and ETS2 regulons across hepatocytes from each time point demonstrating their high activity in PHx24, PHx48, and P14 hepatocytes. (E) Violin plots showing distribution of AUC scores for HNF4A, DBP, CBPA, and HES6 regulons across hepatocytes from each time point demonstrating their high activity in adult and PHx96 hepatocytes. (F) Violin plots showing distribution of AUC scores of representative regulons across hepatocytes showing their up-regulation in the proliferative state. (G) Violin plots showing distribution of AUC scores of representative regulons across hepatocytes showing their up-regulation in quiescent and metabolically active states. (H) Pseudotime plots of hepatocyte cellular trajectories colored by the AUC scores of representative regulons showing high activity in the proliferative state. (I) Pseudotime plots of hepatocyte cellular trajectories colored by the AUC scores of representative regulons showing high activity in quiescent and metabolically active states.
Figure 5.
Figure 5.
Proliferating and metabolically active hepatocytes are discretely localized within regenerating livers. (A) Schematic showing the experimental strategy for cumulative labeling of proliferating cells by continued feeding of EdU during liver regeneration. (B) Representative immunofluorescence images of proliferating hepatocytes measured by cumulative EdU incorporation after PHx or Sham surgeries (n = 4 mice/time point). Proliferating hepatocytes were colabeled for HNF4A (green) and EdU (red). White arrowheads point to the hepatocytes without any EdU incorporation at each time point, representing cells that had not proliferated. Nuclei were stained with To-Pro-3 dye (blue). (C) Percentages of proliferated (EdU+) and nonproliferated (EdU) hepatocytes in regenerating livers at PHx36, 48, and 96 h. Data are mean ± SD; n = 4 mice/time point. (D) Representative immunofluorescence image demonstrating down-regulation of HNF4A protein specifically in proliferating nuclei (EdU+) of a regenerating liver. Liver sections were colabeled for HNF4A in green, EdU in red, and nuclei in blue. (E) Representative images showing an overlay of hepatic glycogen content by PAS staining (purple) and fluorescently detected EdU incorporation (yellow) in PHx48 livers. Nonproliferating hepatocytes exhibited minimal glycogen depletion (n = 4 mice/time point). (F) Representative immunofluorescence images showing spatial segregation of metabolic and proliferating hepatocytes through different phases of liver regeneration. Periportal (CHD1+) or pericentral (GLUL+) hepatocytes were colabeled (green) along with EdU (red). Nuclei were stained with To-Pro-3 dye (blue) (n = 4 mice/time point).
Figure 6.
Figure 6.
Dynamics of cell–cell interactions during liver regeneration. (A) Heat map showing expression of various ligand molecules and cellular receptors from different liver cell types (left) and from hepatocytes belonging to different cell states (right). (B) Network diagrams showing cell–cell interactions indicated by arrows (edges) pointing in the source-to-target direction. Thickness indicates the sum of weighted paths between populations, and the color of arrows corresponds to the source. Network diagrams for Adult, PHx24, PHx48, and PHx96 are shown. (C) Dot plot of representative inbound signals to hepatocytes at PHx48. Size of each dot indicates the weight of the corresponding ligand–receptor interaction and the color indicates negative log10 P-value of the source-to-target interaction. Empirical P-values were calculated and Benjamini–Hochberg correction was performed. (D) Dot plot of representative outbound signals from hepatocytes to various liver cells at PHx48.
Figure 7.
Figure 7.
Division-of-labor model for liver regeneration. Following surgical resection (PHx), the remnant liver tissue regenerates quickly and restores its original size and function. Hepatocyte proliferation initiates in the midlobular region before proceeding toward the periportal and pericentral areas. We propose that a subset of residual hepatocytes in the midlobular area reversibly activate an early-postnatal-like gene program to enter a proliferative state. Simultaneously, a distinct population near the portal and central vein proximal regions up-regulates their metabolic gene program to offset any regeneration-induced deficits in liver function. These reversible cell state transitions are guided by distinct ligand-receptor-mediated signaling events between hepatocytes and nonparenchymal cells. Thus, the division of labor maximizes the benefit-cost ratio of regeneration for an organism, ensuring quick and robust replenishment of the hepatic parenchyma while sustaining adequate metabolic and detoxification activities. (NPCs) PA: portal artery; PV: portal vein; CV: central vein.

Comment in

References

    1. Aibar S, González-Blas CB, Moerman T, Huynh-Thu VA, Imrichova H, Hulselmans G, Rambow F, Marine J-C, Geurts P, Aerts J, et al. 2017. SCENIC: single-cell regulatory network inference and clustering. Nat Methods 14: 1083–1086. 10.1038/nmeth.4463 - DOI - PMC - PubMed
    1. Asrani SK, Devarbhavi H, Eaton J, Kamath PS. 2019. Burden of liver diseases in the world. J Hepatol 70: 151–171. 10.1016/j.jhep.2018.09.014 - DOI - PubMed
    1. Baena E, Gandarillas A, Vallespinós M, Zanet J, Bachs O, Redondo C, Fabregat I, Martinez-A C, de Alborán IM. 2005. c-Myc regulates cell size and ploidy but is not essential for postnatal proliferation in liver. Proc Natl Acad Sci 102: 7286–7291. 10.1073/pnas.0409260102 - DOI - PMC - PubMed
    1. Bangru S, Kalsotra A. 2020. Cellular and molecular basis of liver regeneration. Semin Cell Dev Biol 100: 74–87. 10.1016/j.semcdb.2019.12.004 - DOI - PMC - PubMed
    1. Bangru S, Arif W, Seimetz J, Bhate A, Chen J, Rashan EH, Carstens RP, Anakk S, Kalsotra A. 2018. Alternative splicing rewires Hippo signaling pathway in hepatocytes to promote liver regeneration. Nat Struct Mol Biol 25: 928–939. 10.1038/s41594-018-0129-2 - DOI - PMC - PubMed

Publication types