. 2021 Mar 5;371(6533):eabc8697.
doi: 10.1126/science.abc8697. Epub 2021 Mar 1.

Targeting a neoantigen derived from a common TP53 mutation

Affiliations

Targeting a neoantigen derived from a common TP53 mutation

Emily Han-Chung Hsiue et al. Science. .

Abstract

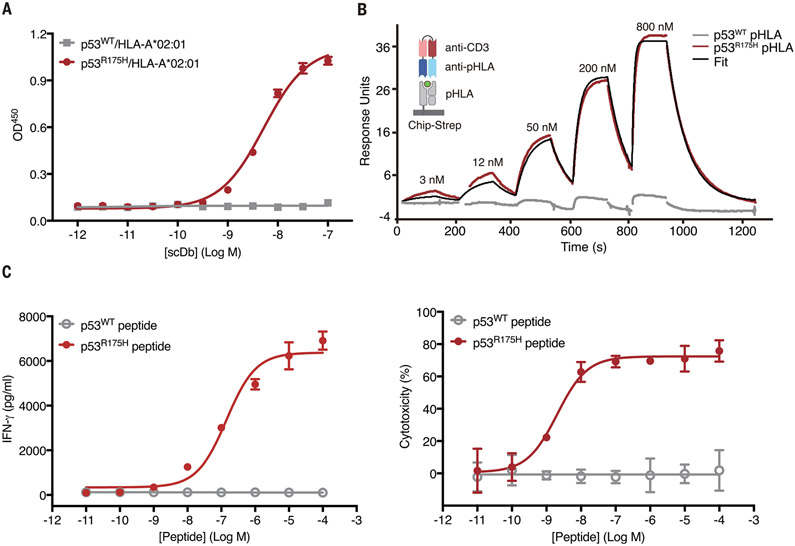
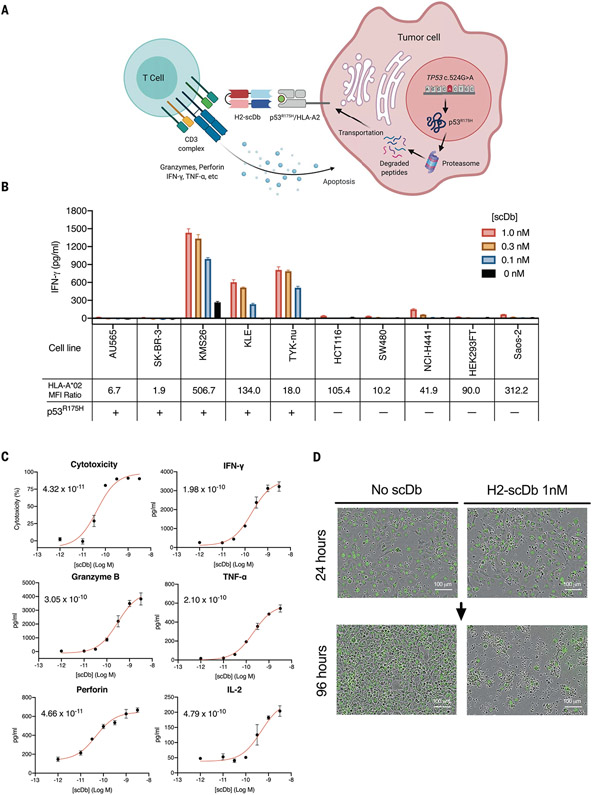
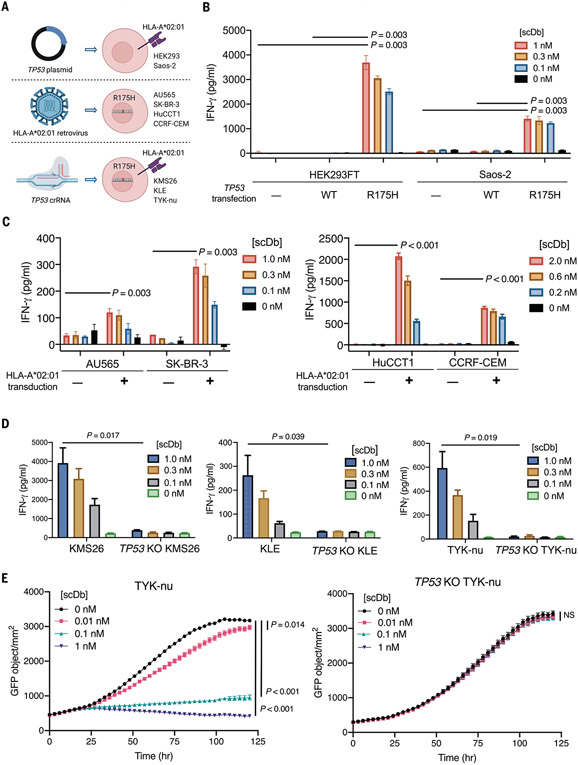
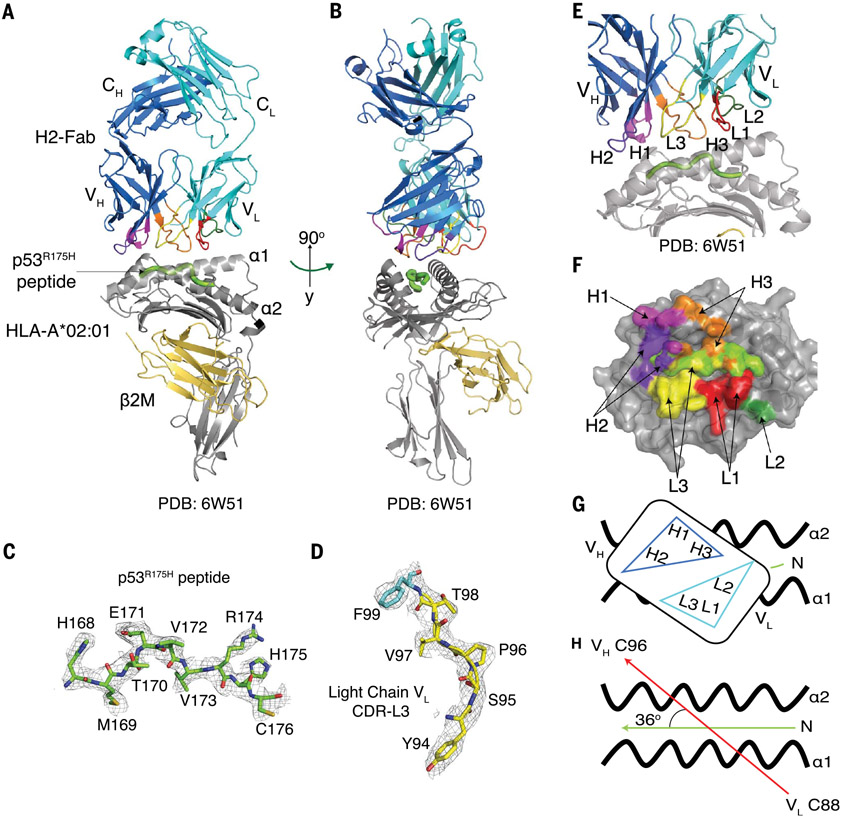
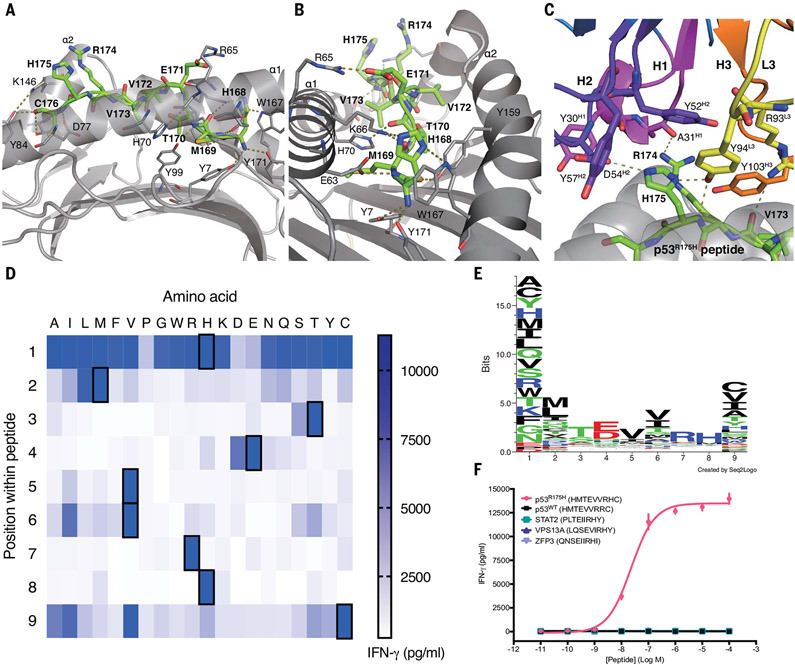
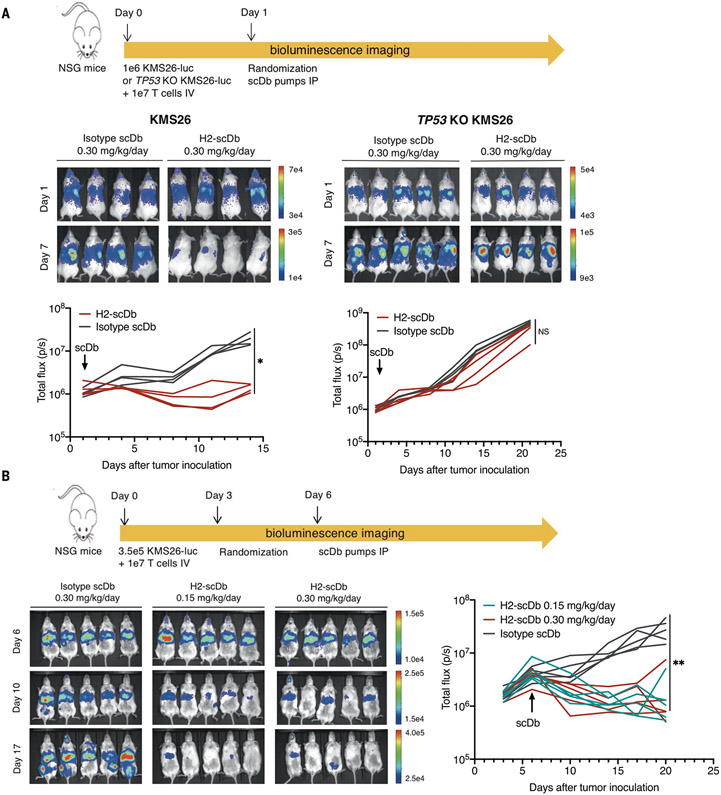
TP53 (tumor protein p53) is the most commonly mutated cancer driver gene, but drugs that target mutant tumor suppressor genes, such as TP53, are not yet available. Here, we describe the identification of an antibody highly specific to the most common TP53 mutation (R175H, in which arginine at position 175 is replaced with histidine) in complex with a common human leukocyte antigen-A (HLA-A) allele on the cell surface. We describe the structural basis of this specificity and its conversion into an immunotherapeutic agent: a bispecific single-chain diabody. Despite the extremely low p53 peptide-HLA complex density on the cancer cell surface, the bispecific antibody effectively activated T cells to lyse cancer cells that presented the neoantigen in vitro and in mice. This approach could in theory be used to target cancers containing mutations that are difficult to target in conventional ways.


Conflict of interest statement

Competing interests: The Johns Hopkins University has filed patent applications related to technologies described in this paper on which E.H.H., K.M.W., J.D., Q.W., M.S.H., B.J.M., A.H.P., A.D.S., N.P., K.W.K., B.V., S.B.G., and S.Z. are listed as inventors: HLA-restricted epitopes encoded by somatically mutated genes (US20180086832A1), MANAbodies and methods of using (US20200079854A1), MANAbodies targeting tumor antigens and methods of using (PCT/US2020/065617). B.V., K.W.K., and N.P. are founders of Thrive Earlier Detection. K.W.K. and N.P. are consultants to and were on the Board of Directors of Thrive Earlier Detection. B.V., K.W.K., N.P., and S.Z. own equity in Exact Sciences. B.V., K.W.K., N.P., S.Z., and D.M.P. are founders of, hold or may hold equity in, and serve or may serve as consultants to ManaT Bio. B.V., K.W.K., N.P., and S.Z. are founders of, hold equity in, and serve as consultants to Personal Genome Diagnostics. S.Z. has a research agreement with BioMed Valley Discoveries. S.B.G. is a founder and holds equity in AMS. K.W.K. and B.V. are consultants to Sysmex, Eisai, and CAGE Pharma and hold equity in CAGE Pharma. B.V. is also a consultant to Catalio. K.W.K., B.V., S.Z., and N.P. are consultants to and hold equity in NeoPhore. N.P. is an advisor to and holds equity in CAGE Pharma. C.B. is a consultant to Depuy-Synthes and Bionaut Pharmaceuticals. The companies named above, as well as other companies, have licensed previously described technologies related to this paper from Johns Hopkins University. B.V., K.W.K., S.Z., N.P., and C.B. are inventors on some of these technologies. Licenses to these technologies are or will be associated with equity or royalty payments to the inventors as well as to Johns Hopkins University. The terms of all these arrangements are being managed by Johns Hopkins University in accordance with its conflict of interest policies. Q.W. is the founder and CEO of Complete Omics. M.F.K. received personal fees from Bristol-Myers Squibb and Celltrion. D.M.P. reports grant and patent royalties through institution from BMS, a grant from Compugen, stock from Trieza Therapeutics and Dracen Pharmaceuticals, and founder equity from Potenza; being a consultant for Aduro Biotech, Amgen, Astra Zeneca (Medimmune/Amplimmune), Bayer, DNAtrix, Dynavax Technologies Corporation, Ervaxx, FLX Bio, Rock Springs Capital, Janssen, Merck, Tizona, and Immunomic-Therapeutics; being on the scientific advisory board of Five Prime Therapeutics, Camden Nexus II, WindMil; and being on the board of directors for Dracen Pharmaceuticals.

Figures

Fig. 1.
Fig. 1.. Biological and biophysical characteristics of scFv clone H2.
(A) H2-scDb binding to immobilized p53R175H/HLA-A*02:01 (red) or p53WT/HLA-A*02:01 (gray) pHLA monomers was assessed by means of ELISA. Data shown represent mean ± SD of three technical replicates. (B) H2-scDb binding to p53R175H/HLA-A*02:01 was measured with single-cycle kinetics by using SPR. H2-scDb was loaded at increasing concentrations. The blank- and reference-subtracted binding is shown for p53R175H/HLA-A*02:01 (red) and p53WT/HLA-A*02:01 (gray). H2-scDb binds to the p53R175H/HLA-A*02:01 pHLA with one-to-one binding kinetics at a Kd of 86 nM (fitted black line). There was negligible p53WT/HLA-A*02:01 binding. (C) T2 cells pulsed with p53WT or p53R175H peptide were co-incubated with 1 nM H2-scDb and T cells at an effector:target (E:T) ratio of 2:1. IFN-γ release was measured with ELISA (left), and cell lysis was evaluated by means of luminescent cytotoxicity assay (right). Data indicate mean ± SD of three technical replicates and are representative of three independent experiments.
Fig. 2.
Fig. 2.. H2-scDb activates T cells in the presence of tumor cells presenting p53R175H.
(A) Illustration depicting the mechanism of action of H2-scDb. (B) HLA-A*02:01-positive tumor cell lines with different HLA expression and p53R175H status were co-incubated with H2-scDb and T cells at an E:T ratio of 2:1. IFN-γ release was measured with ELISA. Data indicate mean ± SD of six technical replicates and are representative of two independent experiments. The HLA-A*02 MFI ratio is defined as MFI (anti-HLA-A*02)/MFI (isotype control). (C) Polyfunctional T cell activation mediated by H2-scDb in response to KMS26 at an E:T ratio of 2:1 was assessed from luminescent cytotoxicity and with antibody-based assays. Median effective concentration (EC50) (M) for each assay is shown in the corresponding graph. Data indicate mean ± SD of three technical replicates and are representative of two independent experiments. (D) Real-time live-cell imaging of T cells co-incubated with green fluorescent protein (GFP)–labeled TYK-nu at an E:T ratio of 5:1 with or without H2-scDb. Representative phase contrast and green fluorescence images taken at 24 hours (top) and 96 hours (bottom) after mixing cells are shown.
Fig. 3.
Fig. 3.. Determination of H2-scDb specificity by using isogenic target cell lines.
(A) Methods of generating isogenic cell line pairs in cells with different HLA and TP53 backgrounds. (B) HEK293FT and Saos-2 cell lines that were not transfected or were transfected with plasmids expressing either the full-length p53WT or full-length p53R175H were co-incubated with T cells at an E:T ratio of 1:1 (HEK293FT) or 2.5:1 (Saos-2) in the presence of increasing amounts of H2-scDb. IFN-γ release was measured with ELISA. Data indicate mean ± SD of three technical replicates and are representative of two independent experiments, analyzed by means of one-way analysis of variance (ANOVA) with Games-Howell multiple comparisons. (C) Cell lines expressing p53R175H and transduced or not transduced with a retrovirus expressing HLA-A*02:01 were co-incubated with H2-scDb and T cells at an E:T of 2:1. IFN-γ release was measured with ELISA. Data indicate mean ± SD of three technical replicates, analyzed by means of two-tailed t test. (D) H2-scDb-mediated IFN-γ release from T cells in response to parental tumor cell lines or their TP53 KO counterparts at an E:T ratio of 2:1 was measured with ELISA. Data indicate mean ± SD of three technical replicates and are representative of two independent experiments, analyzed by means of two-tailed t test. (E) Parental (left) or TP53 KO (right) TYK-nu cells labeled with nuclear GFP were co-incubated with H2-scDb and T cells at an E:T ratio of 2:1. Growth of TYK-nu cells was measured with real-time live-cell imaging. Data indicate mean ± SEM of 12 technical replicates, analyzed by means of two-tailed t test at the last time point, NS indicates no statistical significance comparing 0 nM scDb with each of the three scDb concentrations.
Fig. 4.
Fig. 4.. H2-Fab binds to the HLA-A*02:01 and the C terminus of the p53R175H peptide.
(A) Overall structure of p53R175H/HLA-A*02:01 bound to the H2-Fab fragment (PDB ID 6W51). HLA-A*02:01 and β2 microglobulin (β2M) are colored in gray and gold, respectively. The H2-Fab is colored according to the heavy (blue) and light (cyan) chains of the Fab fragment. The p53R175H nine–amino acid peptide is shown in light green between helices α1 and α2 of the HLA. (B) Structure of H2-Fab–p53R175H/HLA-A*02:01 at 90° to that shown in (A). (C) Composite omit electron density map of the p53R175H peptide contour at 1σ. (D) Composite omit electron density map of a selected area of the H2-Fab at CDR-L3 from residues 95 to 99 contoured at 1σ. (E) Zoomed-in view of the interaction of H2-Fab to p53R175H/HLA-A*02:01 with CDRs colored as in (A). The CDRs are labeled and colored in order from left to right: H2 (purple), H1 (magenta), L3 (yellow), H3 (orange), L1 (red), L2 (dark green). (F) Bird’s-eye view of surface representation of the HLA-A*02:01 shown in gray, p53R175H peptide shown in light green, and the contacting residues colored according to CDRs of the H2-Fab as in (E). (G) Schematic representation of (F). (H) Diagram of the docking angle of the H2-Fab to p53R175H/HLA-A*02:01. The docking angle is defined by two vectors: one from N to C termini of the peptide (green), and the other between the Cα of Cys88 of the disulfide bond of the VL domain and the Cα of Cys96 of the disulfide bond of the VH domain of the H2-Fab (red). The arrowed lines indicate the direction of each vector. The docking angle was calculated by using the web server TCR3d (75, 76). Single-letter abbreviations for the amino acid residues are as follows: A, Ala; C, Cys; D, Asp; E, Glu; F, Phe; G, Gly; H, His; I, Ile; K, Lys; L, Leu; M, Met; N, Asn; P, Pro; Q, Gln; R, Arg; S, Ser; T, Thr; V, Val; W, Trp; and Y, Tyr.
Fig. 5.
Fig. 5.. Structural basis of H2 specificity and identification of putative cross-reactive peptides.
(A) Detailed interactions of the p53R175H peptide with HLA-A*02:01. The peptide (green) and the side chains (gray) of interacting residues of HLA-A*02:01 are represented as sticks. Hydrogen bonds are shown as dashed lines. (B) Perpendicular view of the p53R175H peptide binding cleft. (C) C terminus of the peptide (amino acids Val173 to Cys176) with Arg174 and His175 surrounded by the interacting residues of CDR-H1 (magenta), -H2 (purple), -H3 (orange), and -L3 (yellow) shown as sticks. Hydrogen bonds are shown as dashed lines. (D) T2 cells were loaded with 10 μM HMTEVVRHC peptide variants from the positional scanning library and co-incubated with 1 nM H2-scDb and T cells at an E:T ratio of 2:1. IFN-γ release was measured with cytometric bead array, and the mean of duplicate wells was used to plot the heatmap. Black boxes indicate the amino acids in the parental p53R175H peptide. (E) Illustration of the binding pattern of H2-scDb as Seq2Logo graph, calculated by dividing the IFN-γ value by 104 and using the PSSM-Logo algorithm. (F) T2 cells were loaded with 10 μM p53R175H, p53WT, STAT2, VPS13A, or ZFP3 peptide and co-incubated with 1 nM H2-scDb and T cells at an E:T ratio of 2:1. IFN-γ secretion was measured with ELISA. Data indicate mean ± SD of three technical replicates.
Fig. 6.
Fig. 6.. In vivo antitumor efficacy of H2-scDb.
(A) In the early treatment model, NSG mice were engrafted through intravenous (IV) injection with 1 × 10⁷ human T cells and either 1 × 10⁶ parental KMS26 (left) or 1 × 10⁶ TP53 KO KMS26 (right) on day 0. On day 1, mice were randomized into treatment and control groups, and intraperitoneal (IP) infusion pumps were placed to administer H2-scDb or isotype control scDb at the specified infusion rate. *P = 0.002 and 0.012, NS P = 0.084 and 0.139 by means of two-tailed t test at the last time point with and without assuming equal variance, respectively. (B) In the established tumor model, NSG mice were engrafted with 1 × 10⁷ human T cells and 3.5 × 10⁵ parental KMS26 on day 0, followed by randomization on day 3 and IP placement of infusion pumps on day 6 to deliver H2-scDb or isotype scDb at the specified infusion rates. Tumor growth was monitored by means of bioluminescence imaging. n = 4 or 5 mice per group. Color bars denote the radiance (photons/s/cm2/sr) scale at each time point. Plotted data indicate mean ± SD. **H2-scDb 0.15 mg/kg/day versus isotype scDb P = 0.002 and 0.009, H2-scDb 0.30 mg/kg/day versus Isotype scDb P = 0.002 and 0.009 by means of two-tailed t test at the last time point with and without assuming equal variance, respectively.

Comment in

References

    1. Alexandrov LB et al., Signatures of mutational processes in human cancer. Nature 500, 415–421 (2013). doi: 10.1038/nature12477; pmid: 23945592 - DOI - PMC - PubMed
    1. Vogelstein B et al., Cancer genome landscapes. Science 339, 1546–1558 (2013). doi: 10.1126/science.1235122; pmid: 23539594 - DOI - PMC - PubMed
    1. Garraway LA, Lander ES, Lessons from the cancer genome. Cell 153, 17–37 (2013). doi: 10.1016/j.cell.2013.03.002; pmid: 23540688 - DOI - PubMed
    1. Gerstung M et al., The evolutionary history of 2,658 cancers. Nature 578, 122–128 (2020). doi: 10.1038/s41586-019-1907-7; pmid: 32025013 - DOI - PMC - PubMed
    1. Bouaoun L et al., TP53 Variations in Human Cancers: New Lessons from the IARC TP53 Database and Genomics Data. Hum. Mutat 37, 865–876 (2016). doi: 10.1002/humu.23035; pmid: 27328919 - DOI - PubMed

Publication types

MeSH terms