. 2021 Mar 9;118(10):e2018362118.
doi: 10.1073/pnas.2018362118.

Lipid droplets in mammalian eggs are utilized during embryonic diapause

Affiliations

Lipid droplets in mammalian eggs are utilized during embryonic diapause

Roberta Arena et al. Proc Natl Acad Sci U S A. .

Abstract

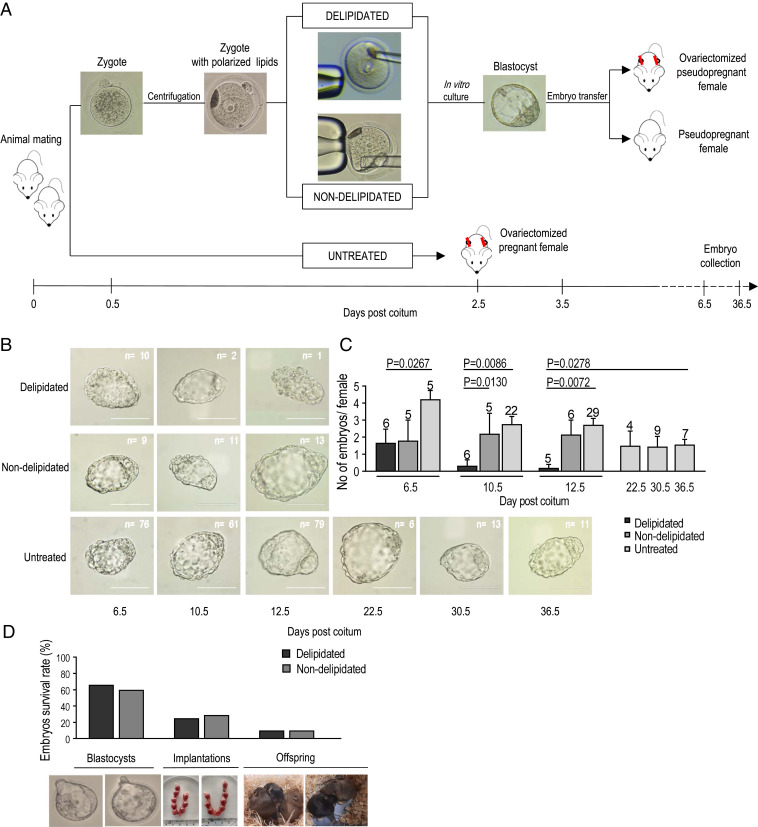
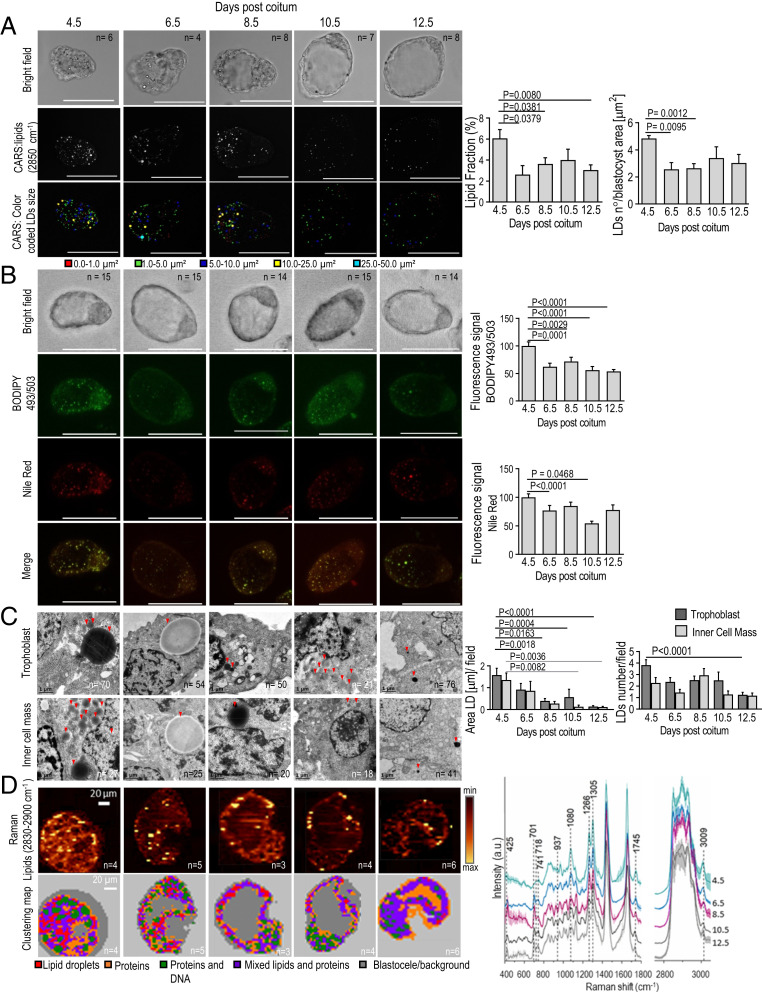
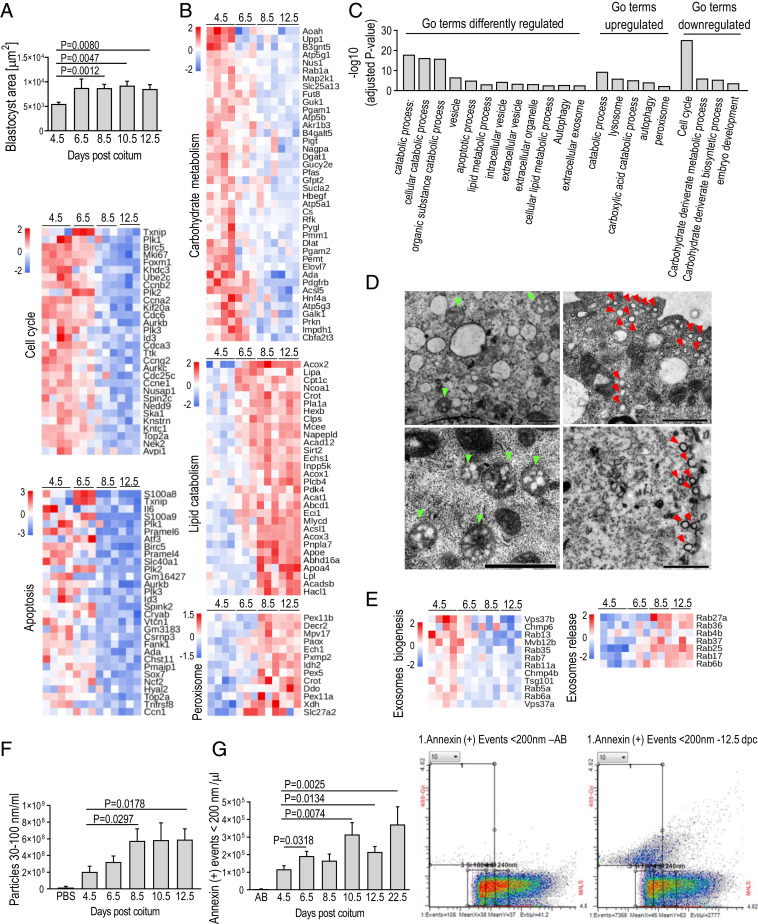
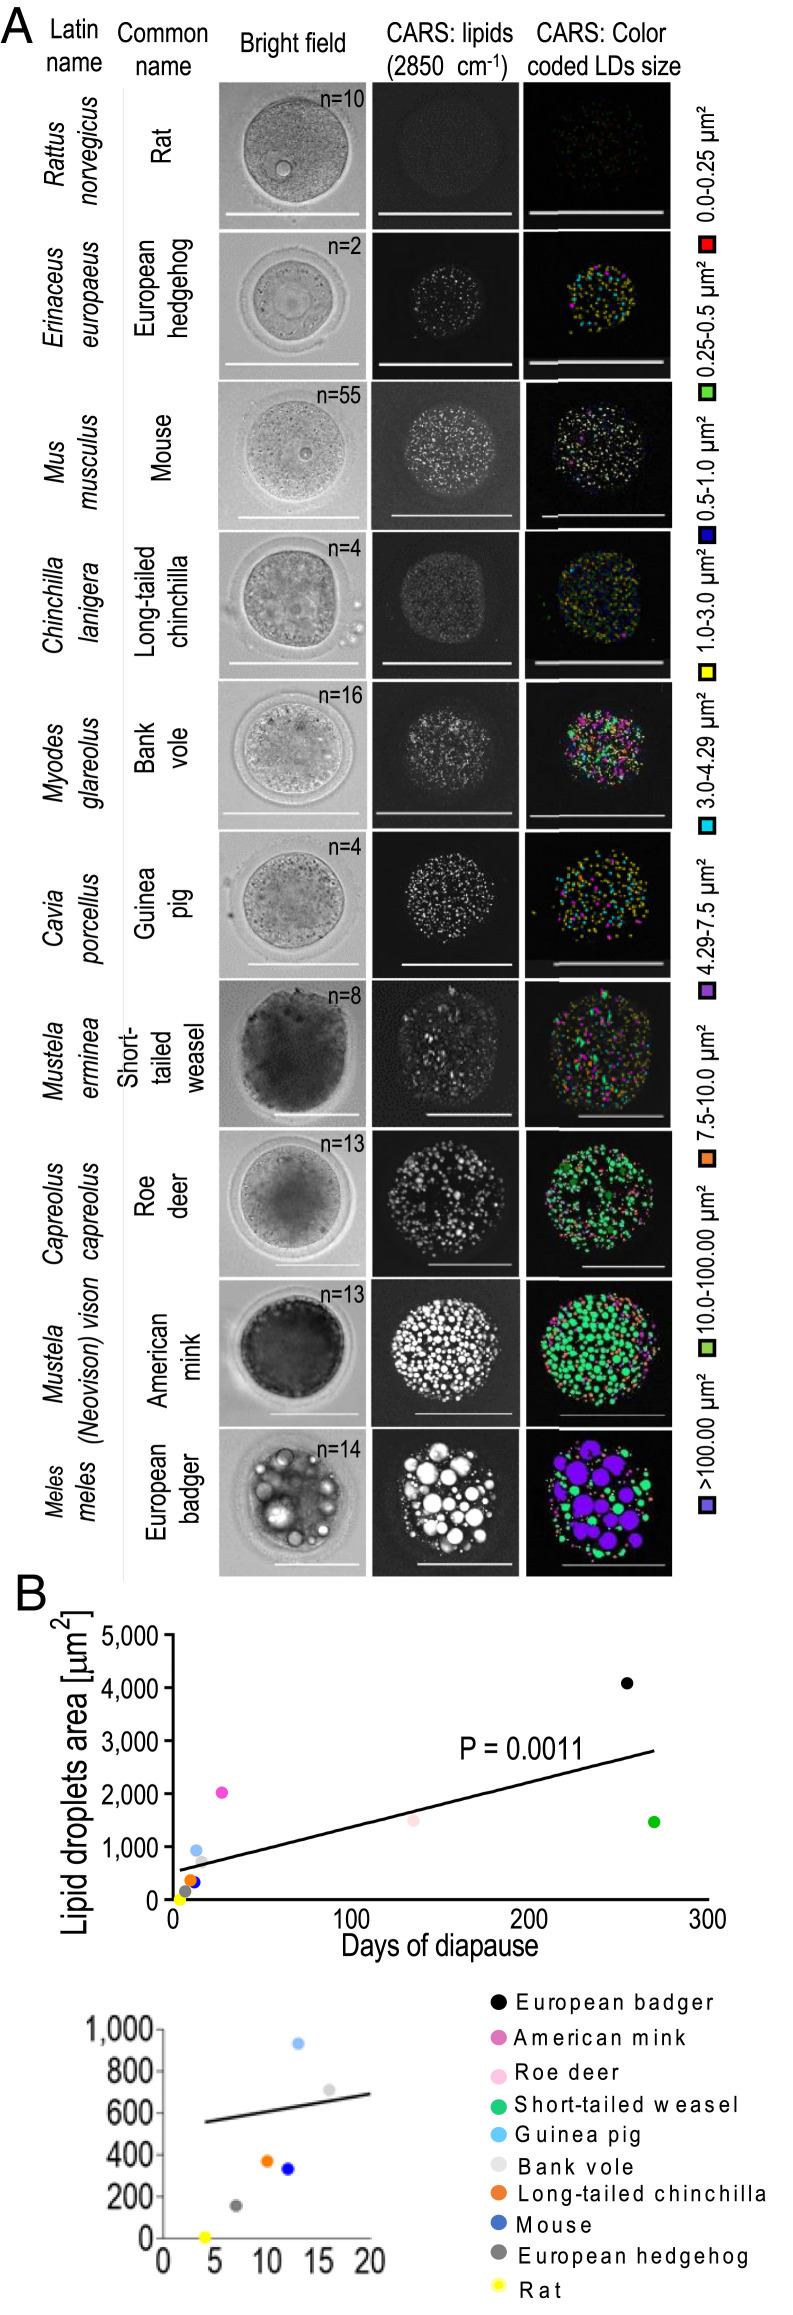
Embryonic diapause (ED) is a temporary arrest of an embryo at the blastocyst stage when it waits for the uterine receptivity signal to implant. ED used by over 100 species may also occur in normally "nondiapausing" mammals when the uterine receptivity signal is blocked or delayed. A large number of lipid droplets (LDs) are stored throughout the preimplantation embryo development, but the amount of lipids varies greatly across different mammalian species. Yet, the role of LDs in the mammalian egg and embryo remains unknown. Here, using a mouse model, we provide evidence that LDs play a crucial role in maintaining ED. By mechanical removal of LDs from zygotes, we demonstrated that delipidated embryos are unable to survive during ED. LDs are not essential for normal prompt implantation, without ED. We further demonstrated that with the progression of ED, the amount of intracellular lipid reduces, and composition changes. This decrease in lipid is caused by a switch from carbohydrate metabolism to lipid catabolism in diapausing blastocysts, which also exhibit increased release of exosomes reflecting elevated embryonic signaling to the mother. We have also shown that presence of LDs in the oocytes of various mammals positively corelates with their species-specific length of diapause. Our results reveal the functional role of LDs in embryonic development. These results can help to develop diagnostic techniques and treatment of recurrent implantation failure and will likely ignite further studies in developmental biology and reproductive medicine fields.

Keywords: blastocyst; embryonic diapause; lipid droplets.


Conflict of interest statement

The authors declare no competing interest.

Figures

Fig. 1.
Fig. 1.
Delipidated embryos are unable to survive during the progression of ED. (A) Workflow of the generation of delipidated and nondelipidated embryos (control manipulation—removal of cytoplasm instead of lipids), their transfer to pseudopregnant ovariectomized females (number of transferred embryos per female = 16), and subsequent collection. Untreated embryos were developed entirely in vivo in ovariectomized females. (B) Representative images of blastocysts collected at progressive days of ED show temporal survival of delipidated and control (nondelipidated, untreated) embryos during ED. The proportions of collected delipidated and nondelipidated embryos were similar: 10 of 96 (10.42%) vs. 9 of 80 (11.25%) at 6.5 dpc. Then, they reduced drastically for delipidated embryos: 2 of 96 (2.08%) vs. 11 of 80 (13.75%) at 10.5 dpc and 1 of 80 (1.25%) vs. 13 of 96 (13.54%) at 12.5 dpc. (Scale bars, 100 μm.) (C) Histogram shows that only 3 (1.7%) delipidated embryos of 176 transferred were still present in the uterus of ovariectomized females at 10.5 and 12.5 dpc. At the same time, untreated embryos were collected from the uteri of ovariectomized mice without any significant decline in their survival until 36.5 dpc, which implies a crucial role of the lipid fraction in ED extension (demonstrated in the last part of this study) (Fig. 4). Numbers above the columns indicate the numbers of females carrying diapausing embryos. Values represent mean ± SEM; Mann–Whitney test. (D) Graph and representative images (Lower) demonstrate similar survival of delipidated and nondelipidated embryos at blastocyst stage (123 of 206 vs. 85 of 128) and following implantation (21 of 72 vs. 14 of 57) and delivery (3 of 30 vs. 2 of 20; χ2 test, no significant differences).
Fig. 2.
Fig. 2.
LDs diminish as ED progresses. (A) Reduction of LDs in the diapausing blastocyst demonstrated by CARS: the legend below the images indicates the color associated with each of the five LDs range/size. n = number of blastocysts. (Scale bars, 100 μm.) Values represent mean ± SEM; two-tailed unpaired Student’s t test performed after data normalization by arcsine transformation. (B) Blastocysts stained by BODIPY and Nile Red analyzed by confocal fluorescence microscopy. (Scale bars, 100 μm.) Histograms show the reduction of LDs. Values represent mean ± SEM; one-way ANOVA after Shapiro–Wilk normality test. (C) TEM analysis of blastocysts’ cells (i.e., trophoblast and inner cells mass). Red arrowheads indicate LDs. n = number of fields counted. (Scale bars, 1 μm.) Histograms show the progressive reduction of LDs area and number in diapaused blastocysts. Values represent mean ± SEM; Kruskal–Wallis test. (D) Confocal Raman imaging. Upper row: Integration Raman maps for lipid bands (range 2,830–2,900 cm−1). Lower row: KMC maps of blastocyst showing spectra grouping into five classes color coded as indicated by the legend below. (Scale bars, 20 μm.) Graph shows average LDs spectra of blastocysts obtained by KMC analysis. Bands at 425 cm−1, 701 cm−1, and 741 cm−1 relative to cholesterol were present at 6.5, 8.5, 10.5, and 12.5 dpc, but not at 4.5 dpc. Band at 1,745 cm−1, indicative for esterified form of the fatty acids, was temporally reduced in the diapausing blastocyst. Band at 3,009 cm−1 and the I1266/I1305 ratio, relative to unsaturated fatty acids, indicates that unsaturated lipids were temporally decreasing in the diapausing blastocyst. Band at 718 cm−1, present in blastocysts at 10.5 and 12.5 dpc, suggests increase in phospholipids.
Fig. 3.
Fig. 3.
Lipids are catabolized and exosomes are intensively produced during ED. (A, Top) Histogram shows the cessation of diapausing blastocyst growth at 8.5 dpc. Mean ± SEM; two-tailed unpaired Student’s t test. (A, Middle and Bottom) The heat maps demonstrate down-regulation of genes controlling cell cycle and apoptosis activity in diapausing blastocysts at 8.5 and 12.5 dpc. (B) The heat maps indicate that diapausing blastocyst down-regulates carbohydrate metabolism while up-regulates lipid catabolism and peroxisomal activity. (C) Selected GO of differently regulated pathways in diapausing blastocysts at 12.5 vs. 4.5 dpc. (D) Representative TEM images show accumulation of spheroidal multivesicular bodies (green arrowheads) from 400 to 600 nm, containing numerous vesicles in the trophoblasts at 4.5 and 6.5 dpc, while the accumulation of numerous cup-shaped spherical vesicles sized <200 nm (red arrowheads) is present at 12.5 dpc. (Scale bars, Top Left, 0.5 µm; Top Right and Bottom, 1 µm.) (E) Sequential down- and up-regulation of genes involved in exosomes biogenesis, multivesicular bodies transport, and exosomes release. (F) Histogram shows an increased concentration of exosomes detected by NTA of embryo collection media. Mean ± SEM; two-tailed unpaired Student’s t test. (G) Histogram and representative cytograms of annexin-positive particles (<200 nm; exosomes marker) in embryo collection media at 12.5 dpc. Histogram shows an increased concentration of annexin-positive particles (<200 nm/μL) in uterine fluid collected at 6.5, 10.5, 12.5, and 22.5 dpc vs. 4.5 dpc. n samples/dpc ≥ 14. Mean ± SEM; two-tailed unpaired Student’s t test. AB, annexin in buffer.
Fig. 4.
Fig. 4.
Storage of lipids in oocytes from various mammals is positively correlated with the duration of ED in a given species. (A) LD quantity and size vary in mammalian oocytes, as imaged by CARS microscopy. Columns from left to right are Latin names of species, common name of species, bright field, maximum intensity projection of CARS signal at 2,850 cm−1, LDs color-coded size mask, and relative legend. Legends indicate the color associated with each of the nine LDs range sizes. n = number of oocytes. (Scale bars, 100 µm.) (B, Upper) Graph shows a positive correlation between LDs amount and the length of ED as documented for the examined species (–43). (B, Lower) The expansion of the graph is presented as the smaller graph evidencing an increased separation of the individual species. Spearman correlation coefficient.

References

    1. Rambold A. S., Cohen S., Lippincott-Schwartz J., Fatty acid trafficking in starved cells: Regulation by lipid droplet lipolysis, autophagy, and mitochondrial fusion dynamics. Dev. Cell 32, 678–692 (2015). - PMC - PubMed
    1. Barbosa A. D., Savage D. B., Siniossoglou S., Lipid droplet-organelle interactions: Emerging roles in lipid metabolism. Curr. Opin. Cell Biol. 35, 91–97 (2015). - PubMed
    1. Nagashima H., Kashiwazaki N., Ashman R. J., Grupen C. G., Nottle M. B., Cryopreservation of porcine embryos. Nature 374, 416 (1995). - PubMed
    1. Renfree M. B., Fenelon J. C., The enigma of embryonic diapause. Development 144, 3199–3210 (2017). - PubMed
    1. Chang M. C., Reciprocal insemination and egg transfer between ferrets and mink. J. Exp. Zool. 168, 49–59 (1968). - PubMed

Publication types

LinkOut - more resources