. 2021 Mar 9;118(10):e2019467118.
doi: 10.1073/pnas.2019467118.

HIV-1 cores retain their integrity until minutes before uncoating in the nucleus

Affiliations

HIV-1 cores retain their integrity until minutes before uncoating in the nucleus

Chenglei Li et al. Proc Natl Acad Sci U S A. .

Abstract

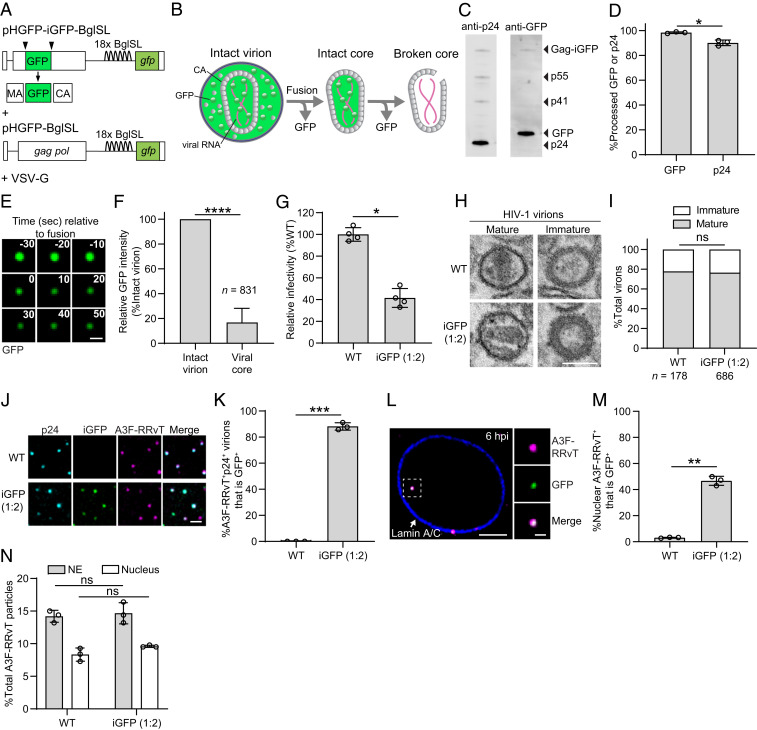
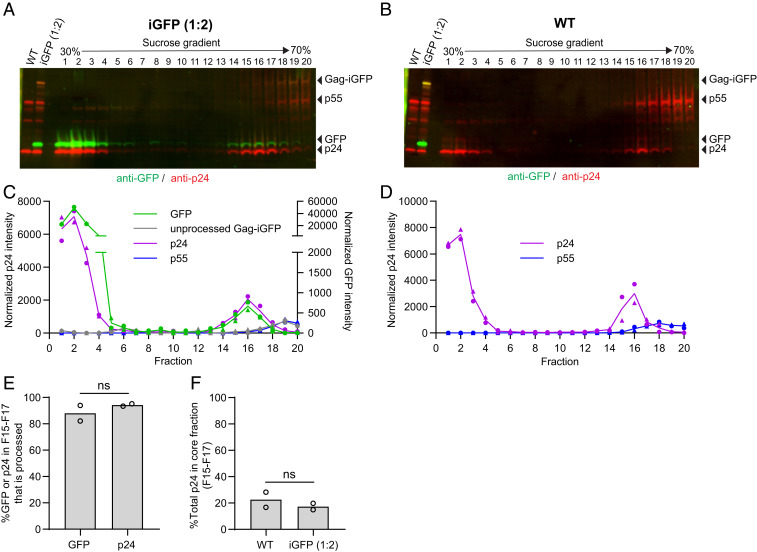
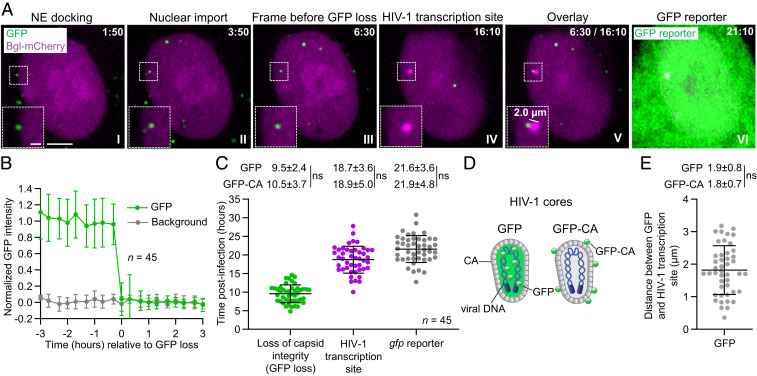
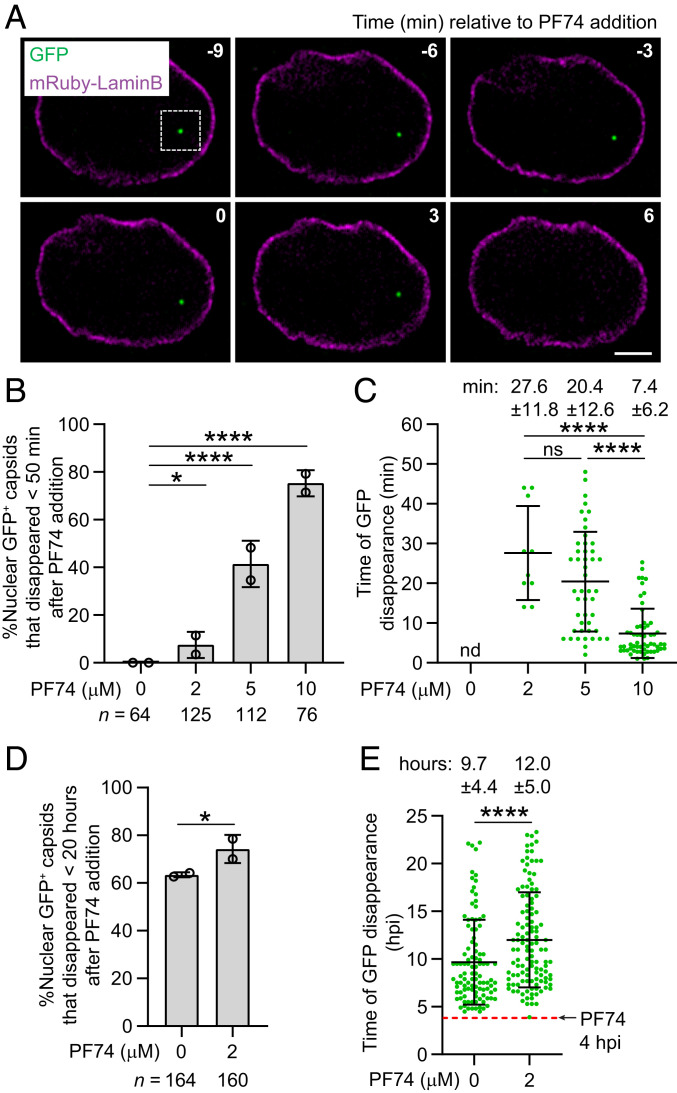
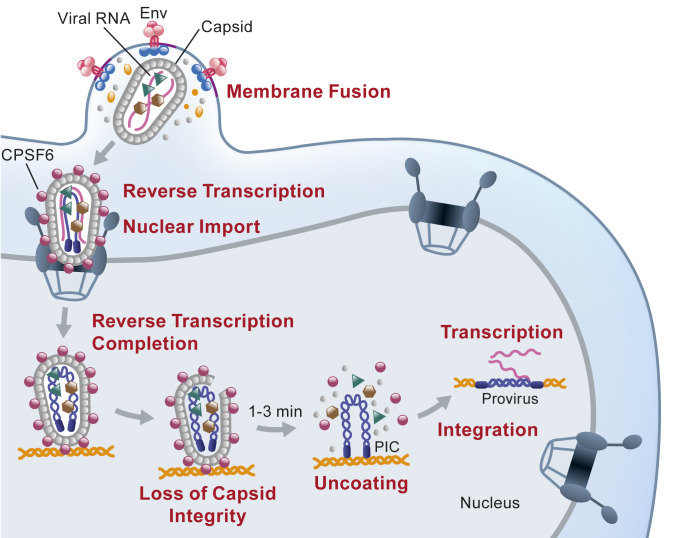
We recently reported that HIV-1 cores that retained >94% of their capsid (CA) protein entered the nucleus and disassembled (uncoated) near their integration site <1.5 h before integration. However, whether the nuclear capsids lost their integrity by rupturing or a small loss of CA before capsid disassembly was unclear. Here, we utilized a previously reported vector in which green fluorescent protein is inserted in HIV-1 Gag (iGFP); proteolytic processing efficiently releases GFP, some of which remains trapped inside capsids and serves as a fluid phase content marker that is released when the capsids lose their integrity. We found that nuclear capsids retained their integrity until shortly before integration and lost their GFP content marker ∼1 to 3 min before loss of capsid-associated mRuby-tagged cleavage and polyadenylation specificity factor 6 (mRuby-CPSF6). In contrast, loss of GFP fused to CA and mRuby-CPSF6 occurred simultaneously, indicating that viral cores retain their integrity until just minutes before uncoating. Our results indicate that HIV-1 evolved to retain its capsid integrity and maintain a separation between macromolecules in the viral core and the nuclear environment until uncoating occurs just before integration. These observations imply that intact HIV-1 capsids are imported through nuclear pores; that reverse transcription occurs in an intact capsid; and that interactions between the preintegration complex and LEDGF/p75, and possibly other host factors that facilitate integration, must occur during the short time period between loss of capsid integrity and integration.

Keywords: HIV-1; capsid; core integrity; nuclear import; uncoating.


Conflict of interest statement

The authors declare no competing interest.

Figures

Fig. 1.
Fig. 1.
Characterization of GFP content marker-labeled virions and detection of GFP-labeled capsids in nuclei of infected HeLa cells. (A) GFP content marker-labeled virions were produced by cotransfection of HIV-1 vectors pHGFP-iGFP-BglSL and pHGFP-BglSL at a 1:2 ratio. (B) Schematic of a GFP content marker-labeled HIV-1 virion and a postfusion capsid. GFP is fluid phase marker distributed throughout the virion upon virus maturation. Fusion of viral and host cell membranes releases GFP that is outside of the core, while some GFP is retained in an intact capsid until a rupture in the core or loss of CA molecules results in loss of core integrity (broken core). (C) GFP content marker-labeled virus purified through a 20% sucrose cushion was analyzed by Western blotting with anti-HIV p24 (Left lane) and anti-GFP (Right lane) antibodies. (D) Quantitation of the proportion of processed GFP or p24 CA relative to the total GFP (98%) or CA (90%) in the virions, respectively. High time-resolution images (1 frame/10 s) (E) and analyses (F) of iGFP-labeled virions upon treatment with saponin detergent. Scale bar for E, 1 μm. (G) HIV-1 virions produced by cotransfection of 293T cells with pHGFP-iGFP-BglSL and pHGFP-BglSL at a 1:2 ratio retain 40% of the infectivity in HeLa cells compared to unlabeled wild-type (WT) virions (set to 100%). (H and I) Quantitative electron microscopy to determine the proportion of HIV-1 virions containing mature capsids labeled with (77%) and without iGFP (78%). (Scale bar, 100 nm.) Statistical significance was determined using Fisher’s exact test. (J) Analysis of HIV-1 virions labeled with A3F-RRvT and iGFP or A3F-RRvT alone. The virions were centrifuged onto a slide and immunostained with α-p24 CA antibody. Scale bar, 2 μm. (K) The percentage of A3F-RRvT+p24-CA+ virions that are iGFP+. (L) Nucleus of a HeLa cell infected with virions colabeled with GFP and A3F-RRvT. The cells were fixed at 6 hpi and immunostained with anti-Lamin A/C antibody to visualize the NE. Scale bar, 5 μm; Inset, 1 μm. (M) The percentage of A3F-RRvT-labeled virus without (WT) and with GFP associated with the NE or inside the nucleus. (N) Similar proportions of viral complexes labeled with A3F-RRvT without (WT) and with GFP (1:2 ratio) that stably associated with the NE and entered the nucleus at 6 hpi. Average of three independent experiments is shown. For D, F, G, K, M, and N, error bars indicate ±SD; P values are from Welch’s t tests. ****P < 0.0001; ***P < 0.001; **P < 0.01; *P < 0.05; ns, not significant (P > 0.05).
Fig. 2.
Fig. 2.
Intact capsids contain processed GFP. (A and B) Western blots of 20 fractions obtained from detergent treatment and sucrose-gradient fractionation (30 to 70% sucrose) of HIV-1 virions labeled with (A) and without (B) GFP. GFP was detected using anti-GFP antibody followed by IRDye 800CW-labeled secondary antibody (green) and gag was detected using anti-p24 antibody followed by IRDye 680-labeled secondary antibody (red). Capsid-associated GFP and p24 sediment to fractions 15 through 17, whereas GFP and p24 between the viral membrane and capsid remains at the top of the gradient (fractions 1 through 4). Most of the unprocessed Gag-iGFP and p55 Gag sediment to the bottom of the gradient (fractions 18 through 20). (C and D) Quantitation of processed GFP, p24, unprocessed Gag-iGFP, and p55 for virions labeled with (C) and without (D) iGFP from two independent experiments, indicated by circles and triangles. (E) The percentage of processed GFP (88%) or p24 CA (94%) relative to unprocessed Gag-iGFP and p55, respectively, in the core fractions (15 through 17) for virions labeled with GFP. (F) The percentage of total p24 CA signal in the gradient (fractions 1 through 20) that is in the core fractions (15 through 17) for HIV-1 virions labeled with (17%) and without (23%) GFP. P values are from Welch’s t tests. ns, not significant (P > 0.05).
Fig. 3.
Fig. 3.
Postfusion capsids in the cytoplasm and capsids in the nucleus retain similar levels of GFP. (A) Representative live-cell microscopy images showing the fusion of GFP-labeled virions and release of the capsid in the cytoplasm of a HeLa cell expressing Bgl-mCherry, which was used to visualize the nucleus. (B) The GFP intensities of 43 GFP-labeled virions before and after fusion. Intensities were normalized to the average intensities from the three frames before fusion (set to 100). (C) Representative images of a GFP-labeled capsid in the nucleus of a HeLa cell (Left) and a CEM-SS T cell (Upper Right) expressing mRuby-Lamin B at 6 hpi, and a primary CD4+ T cell (Lower Right) stained with DAPI (blue) and anti-CD4 antibody (red) at 5 hpi. (D) Comparison of the GFP intensities of intact virions and postfusion capsids in the cytoplasm of HeLa cells, and capsids in the nucleus of HeLa, CEM-SS, and primary CD4+ T cells. Lines are mean ± SD; P values are from Welch’s t tests; ns, not significant (P > 0.05). (Scale bars for A and C, 5 µm; for Inset, 1 µm.)
Fig. 4.
Fig. 4.
GFP-labeled capsids lose their integrity in the nucleus prior to detection of HIV-1 transcription site. (A) Representative live-cell microscopy images of a HeLa:Bgl-mCherry cell infected with GFP-labeled virions. An GFP-labeled nuclear viral core docked at NE 1:50 h:min postinfection (I), entered the nucleus at 3:50 h:min postinfection (II), and lost the GFP signal between 6:30 h:min postinfection and 6:50 h:min postinfection, indicative of loss of core integrity (III); HIV-1 transcription site appeared at 16:10 h:min postinfection (IV). Overlay of last frame in which iGFP signal was detectable and first frame of HIV-1 transcription site appearance (after correcting for cell movement) indicates that the HIV-1 transcription site appeared ∼2.0 µm from the site of GFP disappearance (V). GFP reporter expression was detected 21:10 h:min postinfection (VI). (Scale bar, 5 µm; Inset, 2 µm.) (B) Average normalized GFP intensities of 45 infectious capsids were stable in the nucleus for several hours before abrupt GFP signal loss within a single frame (<20 min). (C) The time of GFP loss, HIV-1 transcription site detection, and gfp reporter detection for 45 infectious RTCs/PICs. (D) Illustrations of GFP- and GFP-CA-labeled capsids. (Left) A capsid labeled with GFP, which is not covalently attached to any viral protein and is expected to behave as a fluid phase marker. (Right) A capsid that is labeled with a small amount of CA protein fused to GFP. (E) The distance between GFP signal detected in the frame prior to loss and associated HIV-1 transcription site (after correcting for cell movement). For C and E, values were compared to those previously determined for 59 infectious GFP-CA-labeled viruses (25). Lines are mean ± SD; P values are from Welch’s t tests; ns, not significant (P > 0.05).
Fig. 5.
Fig. 5.
Disruption of nuclear capsids labeled with GFP with CA-binding inhibitor PF74. (A) Representative live-cell microscopy images of a nuclear GFP-labeled capsid in a HeLa cell expressing mRuby-Lamin B before and after addition of 10 µM PF74. Numbers in white indicate time (minutes) relative to the time of PF74 addition. (Scale bar, 5 µm.) (B and C) The percentage of nuclear capsids labeled with GFP content marker that disappeared within <50 min of treatment with different concentrations of PF74 (B) and the time of GFP disappearance relative to the time of PF74 addition (C). (D and E) The percentage of nuclear capsids labeled with GFP content marker that disappeared within 20 h of treatment with 2 µM PF74 at 4 hpi or mock treatment at 4 hpi (D) and the time of GFP disappearance relative to the time of infection (E). For B and D, P values are from Fisher’s exact tests; ****P < 0.0001; *P < 0.05. For C and E, lines are mean ± SD; P values are from Mann–Whitney test; ****P < 0.0001; ns, not significant (P > 0.05).
Fig. 6.
Fig. 6.
High time-resolution analysis of the loss of GFP, GFP-CA, and capsid-associated mRuby-CPSF6. (A) Representative live-cell microscopy images (1 frame/5 min) of infected HeLa:mRuby-CPSF6 cells showing disappearance of both GFP and mRuby-CPSF6 signals in the same frame. Scale bar, 5 μm; Inset, 1 μm. (BD) The GFP and mRuby-CPSF6 intensities for 16 viral cores dual-labeled with GFP and mRuby-CPSF6 from which both signals disappear in the same 5-min period between consecutive frames (B); 9 viral cores dual-labeled with GFP and mRuby-CPSF6 from which GFP disappears one frame before mRuby-CSPF6 disappearance (C); and 26 viral cores dual-labeled with GFP-CA and mRuby-CPSF6 from which both signals disappear in the same 5-min period between consecutive frames (D). (E) The percentage of GFP-labeled (Left) or GFP-CA-labeled (Right) viral cores in the nucleus from which the GFP signal and the mRuby-CPSF6 signal disappeared in the same frame or the GFP signal was lost one frame before mRuby-CPSF6. (F) Comparison of the observed values with the expected values derived by modeling the probability of capturing GFP and mRuby-CPSF6 signals disappearing in the same 5-min period between consecutive frames or the GFP signal disappearing 1 to 4 min before mRuby-CPSF6 disappearance. P values are from Fisher’s exact tests. ****P < 0.0001; ***P < 0.001; **P < 0.01; *P < 0.05; ns, not significant (P > 0.05).
Fig. 7.
Fig. 7.
Model for nuclear import and HIV-1 uncoating. Intact viral cores are released in cytoplasm upon fusion and transported to the nuclear envelope. Reverse transcription is initiated in the cytoplasm. After docking to the nuclear pore complex, the viral cores recruit CPSF6, which facilitates their entry into the nucleus. Reverse transcription is completed inside the intact viral core. Loss of capsid integrity occurs ∼10 h after infection, followed ∼1 to 3 min later by rapid (<1 min) disassembly of the viral core. This results in the release of the preintegration complex (PIC) and the viral DNA integrates into the host chromatin near the site of uncoating to form a provirus.

References

    1. Gres A. T., et al. ., Structural virology. X-ray crystal structures of native HIV-1 capsid protein reveal conformational variability. Science 349, 99–103 (2015). - PMC - PubMed
    1. Mattei S., Glass B., Hagen W. J., Kräusslich H. G., Briggs J. A., The structure and flexibility of conical HIV-1 capsids determined within intact virions. Science 354, 1434–1437 (2016). - PubMed
    1. Zhao G., et al. ., Mature HIV-1 capsid structure by cryo-electron microscopy and all-atom molecular dynamics. Nature 497, 643–646 (2013). - PMC - PubMed
    1. Campbell E. M., Hope T. J., HIV-1 capsid: The multifaceted key player in HIV-1 infection. Nat. Rev. Microbiol. 13, 471–483 (2015). - PMC - PubMed
    1. Arhel N., Revisiting HIV-1 uncoating. Retrovirology 7, 96 (2010). - PMC - PubMed

Publication types

MeSH terms

Substances