

In vivo chemical reprogramming of astrocytes into neurons
- PMID: 33649311
- PMCID: PMC7921425
- DOI: 10.1038/s41421-021-00243-8
In vivo chemical reprogramming of astrocytes into neurons
Abstract
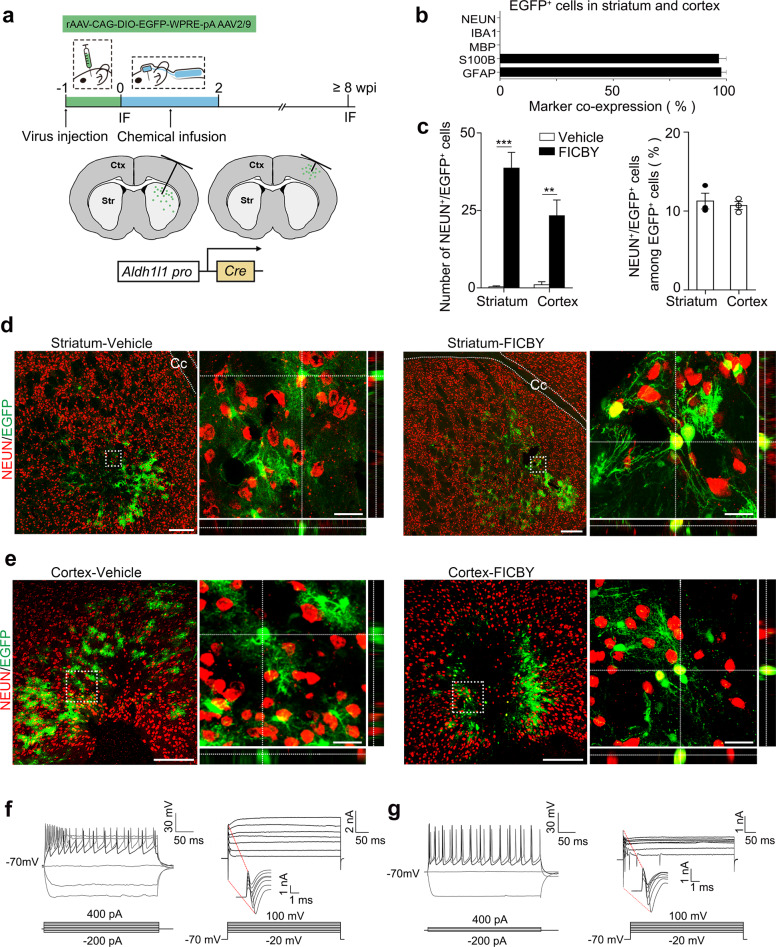
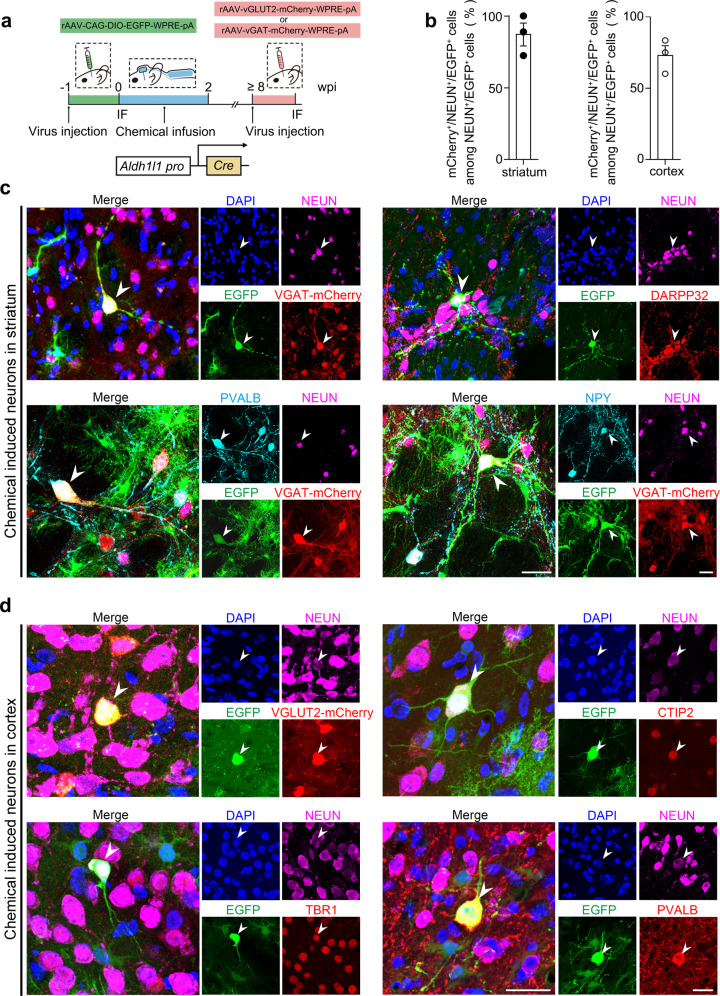
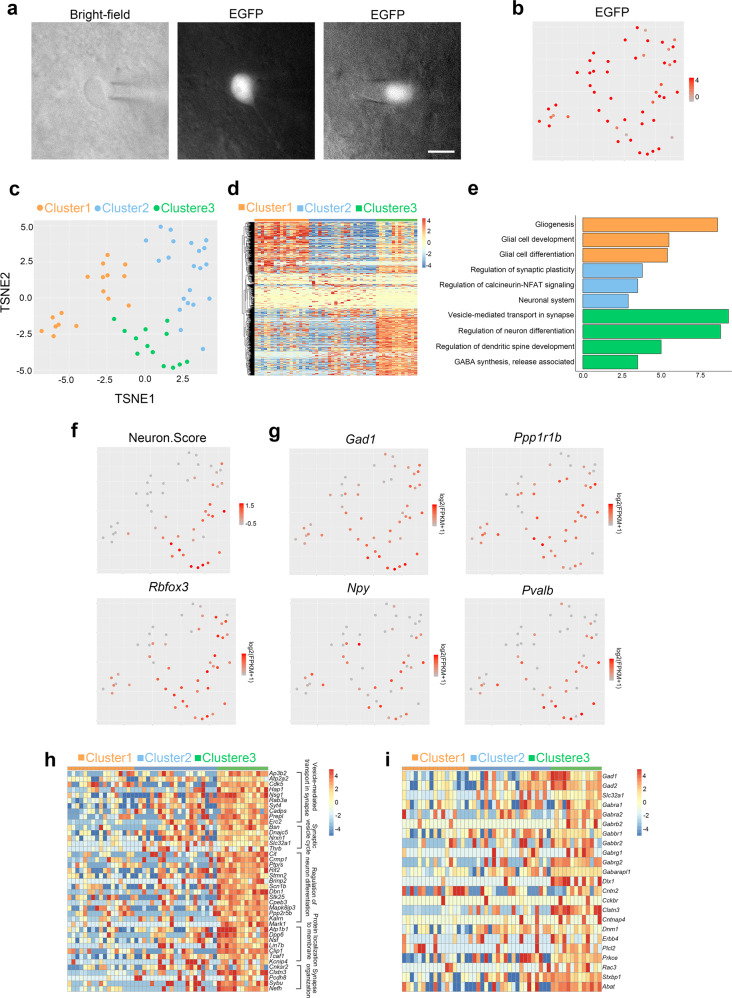
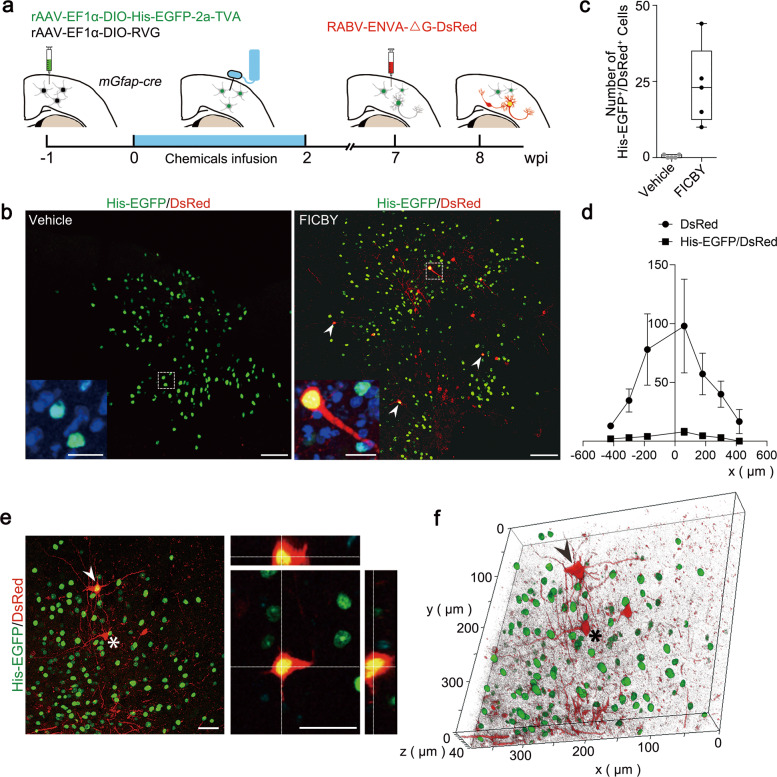
In mammals, many organs lack robust regenerative abilities. Lost cells in impaired tissue could potentially be compensated by converting nearby cells in situ through in vivo reprogramming. Small molecule-induced cell reprogramming offers a temporally flexible and non-integrative strategy for altering cell fate, which is, in principle, favorable for in vivo reprogramming in organs with notoriously poor regenerative abilities, such as the brain. Here, we demonstrate that in the adult mouse brain, small molecules can reprogram astrocytes into neurons. The in situ chemically induced neurons resemble endogenous neurons in terms of neuron-specific marker expression, electrophysiological properties, and synaptic connectivity. Our study demonstrates the feasibility of in vivo chemical reprogramming in the adult mouse brain and provides a potential approach for developing neuronal replacement therapies.
Conflict of interest statement
The authors declare that they have no conflict of interest.
Figures
Similar articles
-
Small molecules reprogram reactive astrocytes into neuronal cells in the injured adult spinal cord.J Adv Res. 2024 May;59:111-127. doi: 10.1016/j.jare.2023.06.013. Epub 2023 Jun 26. J Adv Res. 2024. PMID: 37380102 Free PMC article.
-
Differential neuronal reprogramming induced by NeuroD1 from astrocytes in grey matter versus white matter.Neural Regen Res. 2020 Feb;15(2):342-351. doi: 10.4103/1673-5374.265185. Neural Regen Res. 2020. PMID: 31552908 Free PMC article.
-
Small Molecules Efficiently Reprogram Human Astroglial Cells into Functional Neurons.Cell Stem Cell. 2015 Dec 3;17(6):735-747. doi: 10.1016/j.stem.2015.09.012. Epub 2015 Oct 17. Cell Stem Cell. 2015. PMID: 26481520 Free PMC article.
-
Neuronal Reprogramming for Brain Repair: Challenges and Perspectives.Trends Mol Med. 2020 Oct;26(10):890-892. doi: 10.1016/j.molmed.2020.08.006. Epub 2020 Sep 14. Trends Mol Med. 2020. PMID: 32943322 Review.
-
In Vivo Cellular Reprogramming: The Next Generation.Cell. 2016 Sep 8;166(6):1386-1396. doi: 10.1016/j.cell.2016.08.055. Cell. 2016. PMID: 27610565 Free PMC article. Review.
Cited by
-
In vivo neural regeneration via AAV-NeuroD1 gene delivery to astrocytes in neonatal hypoxic-ischemic brain injury.Inflamm Regen. 2024 Jul 16;44(1):33. doi: 10.1186/s41232-024-00349-y. Inflamm Regen. 2024. PMID: 39014391 Free PMC article.
-
Generation of a Pure Culture of Neuron-like Cells with a Glutamatergic Phenotype from Mouse Astrocytes.Biomedicines. 2022 Apr 18;10(4):928. doi: 10.3390/biomedicines10040928. Biomedicines. 2022. PMID: 35453678 Free PMC article.
-
Cell-based regenerative and rejuvenation strategies for treating neurodegenerative diseases.Stem Cell Res Ther. 2025 Apr 6;16(1):167. doi: 10.1186/s13287-025-04285-7. Stem Cell Res Ther. 2025. PMID: 40189500 Free PMC article. Review.
-
Characterization and neurogenic responses of primary and immortalized Müller glia.Front Cell Dev Biol. 2025 May 9;13:1513163. doi: 10.3389/fcell.2025.1513163. eCollection 2025. Front Cell Dev Biol. 2025. PMID: 40417181 Free PMC article.
-
The Combination of Two Small Molecules Improves Neurological Parameters and Extends the Lifespan of C3H Strain Female Mice.Brain Behav. 2025 Jun;15(6):e70573. doi: 10.1002/brb3.70573. Brain Behav. 2025. PMID: 40444523 Free PMC article.
References
LinkOut - more resources
Full Text Sources
Other Literature Sources
Molecular Biology Databases
