. 2021 Mar 1;12(1):1451.
doi: 10.1038/s41467-021-21880-3.

Molecular correlates of muscle spindle and Golgi tendon organ afferents

Affiliations

Molecular correlates of muscle spindle and Golgi tendon organ afferents

Katherine M Oliver et al. Nat Commun. .

Abstract

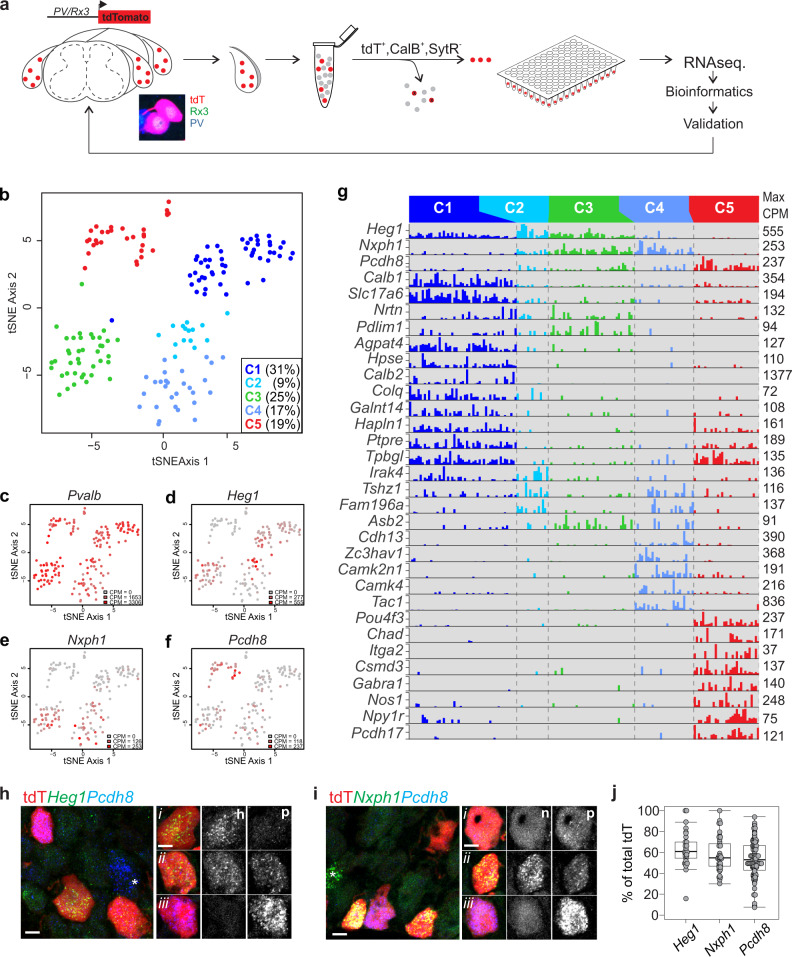
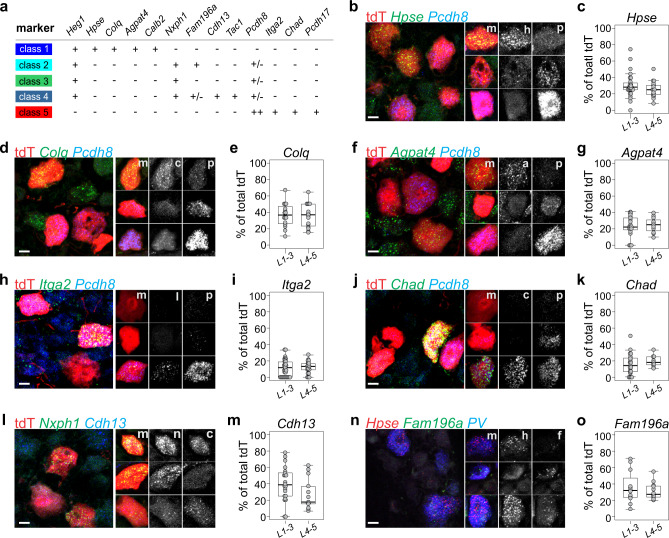
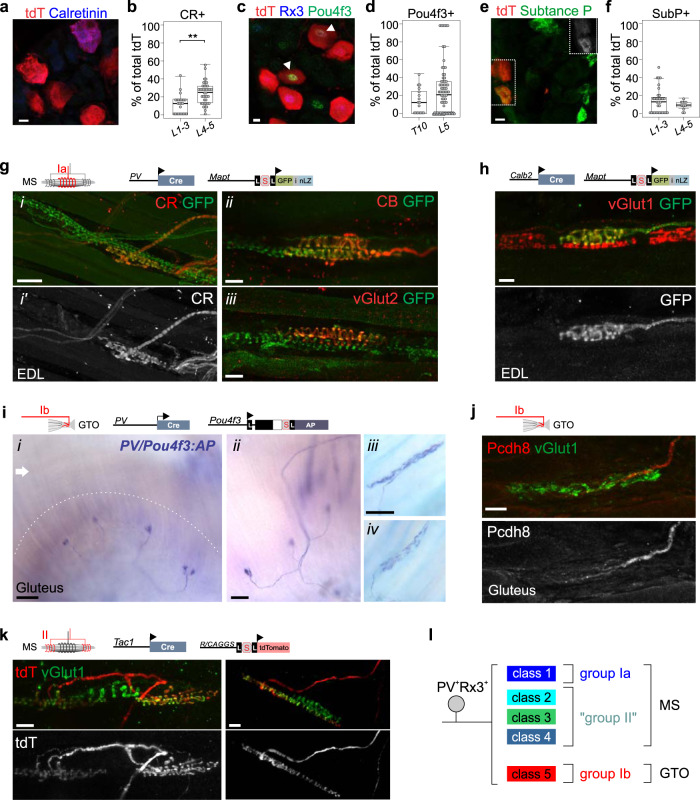
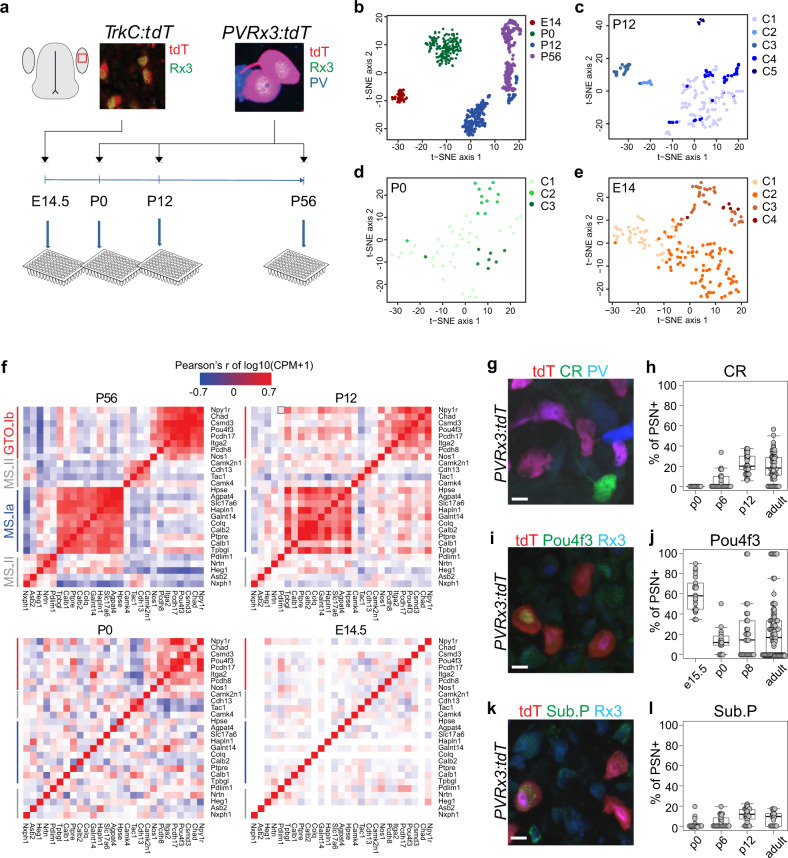
Proprioceptive feedback mainly derives from groups Ia and II muscle spindle (MS) afferents and group Ib Golgi tendon organ (GTO) afferents, but the molecular correlates of these three afferent subtypes remain unknown. We performed single cell RNA sequencing of genetically identified adult proprioceptors and uncovered five molecularly distinct neuronal clusters. Validation of cluster-specific transcripts in dorsal root ganglia and skeletal muscle demonstrates that two of these clusters correspond to group Ia MS afferents and group Ib GTO afferent proprioceptors, respectively, and suggest that the remaining clusters could represent group II MS afferents. Lineage analysis between proprioceptor transcriptomes at different developmental stages provides evidence that proprioceptor subtype identities emerge late in development. Together, our data provide comprehensive molecular signatures for groups Ia and II MS afferents and group Ib GTO afferents, enabling genetic interrogation of the role of individual proprioceptor subtypes in regulating motor output.


Conflict of interest statement

The authors declare no competing interests.

Figures

Fig. 1
Fig. 1. An intersectional genetic labeling strategy for proprioceptive muscle afferents.
a Schematic rendering of the groups Ia, II and Ib proprioceptor subtypes labeled in mice carrying a PV:Cre, Rx3:FlpO, and the double stop Ai65:tdTomato allele (PVRx3:tdT). In sensory neurons that co-express PV and Rx3, the dual activity of Cre and FlpO recombinases will allow expression of the tdTomato reporter. b Expression of Runx3, PV, and tdTomato in DRG at p2 indicates efficient induction of the tdTomato reporter in PV+Rx3+ sensory neurons, but not in PV+Rx3off (arrowhead in ii) or PVoffRx3+ (arrow in ii) neurons (i and ii are independent images). c Efficiency of tdTomato reporter induction in T10, L2, and L5 DRG in p2 PVRx3:tdT mice. Mean percentage ± S.E.M. of tdT+PV+Rx3+ neurons (of all PV+Rx3+) per ganglia for T10: 98.0 ± 1.3%, for L2: 94.4 ± 2.5%, for L5: 94.8 ± 1.9%; n = 6 DRG per segmental level. Number of sections per T10 DRG: 7, 6, 6, 7, 7, 8; Number of sections per L2 DRG: 7, 3, 6, 5, 8, 7; Number of sections per L5 DRG: 9, 8, 10, 6, 7, 10. d tdTomato expression in vGlut1+ muscle spindle (MS) and Golgi tendon organ (GTO) afferent terminals in p10 EDL muscle of PVRx3:tdT animals. Diagram depicts muscle with red boxes showing areas in images below. Expression of tdTomato in Merkel cell afferents present in hind paw glabrous skin (e) and in SubstanceP(SubP)off sensory neurons that appear to innervate the nail of forepaw digits (f) of adult (≥p56) PVRx3:tdT mice. Diagram depicts foot paw with red boxes showing areas in images below. In e, Merkel cells are indicated by expression of Troma1. i, ii show higher magnifications of boxed areas in e, f; ii shows tdTomato expression. Similar data obtained from at least three (b, d, e) biological replicates. In boxplot (c), boxes indicate medians and 25th/75th percentiles, and whiskers extend to the furthest point <1.5 standard deviations from the mean. Scale 20 (b) or 50 (df) μm.
Fig. 2
Fig. 2. Single cell transcriptome analysis of PV+Rx3+ neurons.
a Schematic of single cell RNA sequencing strategy employed in experiments. DRG from adult (≥p56) PVRx3:tdT mice were collected and dissociated into single cell suspensions. tdT+ SNs were isolated using FACS. To ensure cell viability, neurons were also assessed for the presence of high Calcein Blue (CalB) and absence of Sytox red (SytR) labeling while sorting individual neurons into a single well of a 96-well plate containing lysis buffer (see “Methods” for details). b t-stochastic neighbor embedding (tSNE) plot of adult cells, colored by cluster membership. Clustering was done using a gene module and bootstrapping approach (with the hicat package—see “Methods”). cf tSNE plots of cells colored by expression of four genes. In each plot, the color represents no expression (grey) to maximum counts per million (CPM) value over all the cells (red). g Barplots showing a subset of differentially expressed genes across the five main clusters. For each gene, the maximum CPM value over all cells is shown on the right side of the corresponding bar plot. Genes were selected for differential expression across multiple pairs of clusters with the added restriction of binary (on-off) expression, as far as possible, in at least two of the clusters. h Expression of Heg1 and Pcdh8 in tdT+ pSNs in lumbar DRG of adult (≥p56) PVRx3:tdT mice. Single neuron analysis (i–iii) of Heg1 (h) and Pcdh8 (p) expression exhibits three expression patterns across the five molecular identified clusters: cluster 1 tdT+ neurons expressing high transcript levels of Heg1 but little Pcdh8 (i), cluster 2-4 tdT+ neurons with comparable levels of Heg1 and Pcdh8 (ii), and cluster 5 tdT+ neurons with high Pcdh8 but no Heg1 (iii). Some Pcdh8 expressing neurons fall outside of the tdT+ pSN population (marked by asterisk). i Expression of Nxph1 and Pcdh8 in tdT+ pSNs in lumbar DRG of adult PVRx3:tdT mice. Single neuron analysis (i–iii) of Nxph1 (n) and Pcdh8 (p) expression shows presumed (i) cluster 1 tdT+ neurons expressing no Nxph1 but low levels of Pcdh8 transcript, (ii) cluster 2–4 tdT+ neurons coexpressing Nxph1 and Pcdh8 (with variable levels of Pcdh8), and (iii) cluster 5 tdT+ neurons with no Nxph1 but high Pcdh8 transcript levels. Similar to Pcdh8, Nxph1 is also expressed in a few non-tdT+ neurons (marked by asterisk). j Percentage of Heg1+, Nxph1+, and Pcdh8+ tdT+ SNs in ≥p56 lumbar DRG of PVRx3:tdT animals. Data points indicate counts for a single DRG section and include both low and high expressing neurons. Mean percentage ± S.E.M. for Heg1: 63.5 ± 3.2%, n = 29 sections; for Nxph1: 57.8 ± 2.7%, n = 39 sections; for Pcdh8: 53.9 ± 1.9%, n = 94 sections. Similar data obtained from at least three (h, i) biological replicates. In boxplot (j), boxes indicate medians and 25th/75th percentiles, and whiskers extend to the furthest point less than 1.5 standard deviations from the mean. Scale 10 μm.
Fig. 3
Fig. 3. Validation of molecularly distinct proprioceptor subtypes.
a Summary of transcripts examined in validation assays. Transcript expression levels are indicated by “++” (high expression levels in most neurons), “+” (intermediate expression level in most neurons), “+/−“ (lower expression levels in all or a subset of neurons), or “–“ (no or nearly no expression). bg Expression of cluster I transcripts Hpse, Colq, and Agpat4 in relation to expression of the cluster 5 transcript Pcdh8 in ≥p56 lumbar DRG of PVRx3:tdT mice. In b, d, f, images of individual neurons represent examples of observed transcript combinations other than those observed in the main image. High levels of Hpse (h) (in b), Colq (c) (in d), or Agpat4 (a) (in f) transcript generally are mutually exclusive with high levels of Pcdh8 (p) transcript (m indicates merged image). Percentage of Hpse+tdT+ neurons (c), Colq+tdT+ neurons (e), or Agpat4+tdT+ neurons (g) (of total tdT+) in ≥p56 rostral (L1-3) or caudal (L4-5) lumbar DRG of PVRx3:tdT animals. Mean percentage ± S.E.M. Hpse (L1-3): 30.1 ± 2.8%, n = 28 sections; Hpse (L4-5): 25.4 ± 2.2%, n = 19 sections; Colq(L1-3): 36.7 ± 3.5%, n = 16 sections; Colq(L4-5): 36.1 ± 3.6%, n = 16 sections; Agpat4(L1-3): 23.2 ± 2.8%, n = 21 sections; Agpat4(L4-5): 24.7 ± 2.8%, n = 11 sections. hk Expression of the cluster 5 transcripts Itga2, Chad, and Pcdh8 in ≥p56 lumbar DRG of PVRx3:tdT mice. In h, j, images of individual neurons represent examples of observed transcript combinations other than those observed in the main image. High transcript levels of Itga2 (i) (in h) or Chad (c) (in j) generally overlap with high levels of Pcdh8 (p) transcript expression (m indicates merged image). i, k Percentage of Itga2+tdT+ neurons (i) or Chad+tdT+ neurons (j) (of total tdT+) in ≥p56 rostral (L1-3) or caudal (L4-5) lumbar DRG of PVRx3:tdT animals. Mean percentage ± S.E.M. Itga2(L1-3): 11.5 ± 1.7%, n = 34 sections; Itga2(L4-5): 12.4 ± 1.6%, n = 21 sections; Chad(L1-3): 15.9 ± 2.6%, n = 23 sections; Chad(L4-5): 19.5 ± 2.4%, n = 9 sections. l Expression of cluster 2–4 transcript Nxph1 and cluster 4 transcript Cdh13 in ≥p56 PVRx3:tdT DRG. Images of individual neurons represent examples of observed transcript combinations other than those observed in the main image. Single neuron analysis confirms that a subset of Nxph1 (n) neurons co-express Cdh13 (c; m indicates merged image). m Percentage of Cdh13+tdT+ neurons (of total tdT+) in adult PVRx3:tdT DRG. Mean percentage ± S.E.M. Cdh13(L1-3): 39.6 ± 4.5%, n = 22 sections; Cdh13(L4-5): 27.3 ± 5.3%, n = 13 sections. n Expression analysis of Hpse (cluster 1), Fam196a (cluster 2 and 4), and PV in adult wild type DRG indicates the presence of cluster 1 Hspe+Fam196aoff, and cluster 2 or 4 HspeoffFam196a+ PV neurons. Images of individual neurons represent examples of observed transcript combinations other than those observed in the main image. A few cluster 1 neurons coexpress Hspe and Fam196a (see also Fig. 2g). o Percentage of Fam196a+tdT+ neurons (of total tdT+) in adult PVRx3:tdT DRG. Mean percentage ± S.E.M. Fam196a(L1-3): 35.9 ± 5.7%, n = 12 sections; Fam196a(L4-5): 31.4 ± 3.0%, n = 12 sections. Similar data obtained from at least three (b, d, f, h, j, l, n) biological replicates. In boxplots (c, e, g, I, k, m, o), boxes indicate medians and 25th/75th percentiles, and whiskers extend to the furthest point <1.5 standard deviations from the mean. Scale 10 μm.
Fig. 4
Fig. 4. Molecular distinct pSN clusters segregate with MS or GTO afferents.
a Expression of Calretinin and tdT in ≥p56 lumbar DRG of PVRx3:tdT mice. b Percentage of CR+tdT+ neurons (of total tdT+) in adult PVRx3:tdT DRG. Mean percentage ± S.E.M. CR(L1-3): 11.6 ± 2.3%, n = 24 sections; CR(L4-5): 23.9 ± 1.9%, n = 40 sections, p < 0.001 (two-sided Mann–Whitney U test). c Expression of Pou4f3, Runx3, and tdT in ≥p56 lumbar DRG of PVRx3:tdT mice. Arrowheads indicate Pou4f3+Rx3+tdT+ neurons. d Percentage of Pou4f3+tdT+ neurons (of total tdT+) in adult PVRx3:tdT DRG. Mean percentage ± S.E.M. Pou4f3(T10): 13.9 ± 3.6%, n = 17 sections; Pou4f3(L5): 25 ± 3.2%, n = 78 sections. e Expression of Substance P and tdT in ≥p56 lumbar DRG of PVRx3:tdT mice. Boxed area is also shown in top right corner to illustrate expression of Substance P. f Percentage of Sub. P+tdT+ neurons (of total tdT+) in adult PVRx3:tdT DRG. Mean percentage ± S.E.M. SubP(L1-3): 13.8 ± 2.5%, n = 33 sections; SubP(L4-5): 9.0 ± 1.6%, n = 11 sections. g Expression of Calretinin (CR) (i, i′), Calbindin 1 (CB) (ii), and vGlut2 (iii) in GFP+ muscle spindle (MS) afferents of p12 (i, i′) or adult (≥p56) (ii, iii) muscle of PV:Cre; Mapt:lxp-STOP-lxp:mGFP-iNLZ (PV:GFP) mice. CR, CB, and vGlut2 expression is observed in GFP+ MS afferents that innervate the equatorial region of the muscle spindle. h Expression of vGlut1 and GFP in a muscle spindle (MS) of p18 EDL muscle of Calb2:Cre; Mapt:lxp-STOP-lxp:mGFP-iNLZ (Calb2:GFP) mice. Similarly as observed for Calretinin protein, in Calb2:GFP mice, expression of GFP labels MS afferents that innervate the equatorial region of the spindle. i Alkaline phosphatase (AP) labeling of GTO afferents in gluteus muscle of PV:Cre; Pou4f3:lxp-STOP-lxp:AP (PV/Pou4f3:AP) at p2 (i, ii), and at ≥p56 (iii, iv) mice. Dashed line in (i) indicates area of the myotentinous junction where GTOs reside. Arrow indicates muscle area where MSs are generally located. j Pcdh8 expression localizes to vGlut1+ GTO afferents in p12 gluteus muscle of wild type mice. k tdT+ MS afferents in EDL muscle of p20 Tac1:Cre; Ai14:tdTomato (Tac1:tdT) animals. l Summary of molecularly distinct pSN subclasses and their association with either MS (group Ia, putative group II) or GTO (group Ib) muscle receptors. In gl, schematics indicate pSN subtype highlighted, and alleles used, in images below. Similar data obtained from at least three (a, c, e, gi), two (k), or one (j) biological replicates. In boxplots (b, d, f), boxes indicate medians and 25th/75th percentiles, and whiskers extend to the furthest point <1.5 standard deviations from the mean. Scale 10 (a, c, e) 20 (g(ii), g(iii), h, j) or 50 (g(i)) μm.
Fig. 5
Fig. 5. Circuit features of MS and GTO afferent sensory subtypes.
Bar graphs showing expression (in CPM) of annotated Kv channel and auxiliary subunit genes (a), and GABAA receptor subunits (b) across the five putative cell types identified from the clustering of single-cell RNAseq data. ch Distribution patterns of the GABAA receptor units Gabra1 (c), Gabra3 (e), and Gabra5 (g) in tdT+ neurons in adult (≥p56) PVRx3:tdT mice. Images of individual neurons represent examples of observed Gabra+tdT+ neurons other than those observed in the main image. Percentage of Gabra1+tdT+ (d), Gabra3+tdT+ (f), and Gabra5+tdT+ (h) (of all tdT+ neurons) in p56 mice, at rostral (L1-3) and caudal (L4-5) lumbar levels. Mean percentage ± S.E.M. Gabra1(L1-3): 30.6 ± 3.8%, n = 37 sections, Gabra1(L4-5): 34.2 ± 4.8%, n = 18 sections; Gabra3(L1-3): 73.1 ± 3.7%, n = 63 sections, Gabra3(L4-5): 61.4 ± 4.9%, n = 31 sections; Gabra5(L1-3): 19.3 ± 2.4%, n = 19 sections, Gabra5(L4-5): 20.5 ± 2.7%, n = 10 sections. i Grin3a receptor expression in lumbar DRG of ≥p56 PVRx3:tdT mice. Grin3a transcript is detected in a subset of tdT+ neurons. Images of individual neurons represent examples of observed Grin3a+tdT+ neurons other than those observed in the main image. j Percentage of Grin3a+tdT+ neurons (of all tdT+ neurons) in lumbar DRG of ≥p56 PVRX3:tdT mice. Mean percentage ± S.E.M. Grin3a(L1-3): 45.9 ± 8.4%, n = 19 sections, Grin3a(L4-5): 33.3 ± 6.4%, n = 9 sections. k Expression of Npy1r transcript in tdT+ neurons in lumbar DRG of ≥p56 PVRx3:tdT mice. Images of individual neurons represent examples of observed Npy1r+tdT+ neurons other than those observed in the main image. l Percentage of Npy1r+tdT+ neurons (of all tdT+) in lumbar ganglia. Mean percentage ± S.E.M. Npy1r(L1-3): 49.9 ± 5.4%, n = 19 sections, Npy1r(L4-5): 49.3 ± 6.7%, n = 5 sections. Similar data obtained from at least three (c, e, g, i, k) biological replicates. In boxplots (d, f, h, j, l), boxes indicate medians and 25th/75th percentiles, and whiskers extend to the furthest point less than 1.5 standard deviations from the mean. Scale 10 μm.
Fig. 6
Fig. 6. Electrophysiological properties of muscle proprioceptors.
aj Physiological properties of adult (>p28) dissociated tdT+ neurons as assessed through in vitro patchclamp recordings. a Phase contrast images of adult DRG neurons in culture. A patch electrode is shown (left) on a PV+ neuron expressing tdTomato (red; right). Scale 100 μm. b The firing patterns for DRG PV+ neuron expressing tdTomato displayed in percentages. c The frequency response for the three different firing patterns in proprioceptive neurons (n = 22); color scheme as in b. Tonic firing proprioceptors exhibited significantly higher frequencies compared to proprioceptors in which injected current (200–400 pA supra-threshold current steps for 2.5 s) evoked a single AP or burst firing. Each dot represents a single neuron, bars represent mean ± S.D. (p < 0.001; One-way ANOVA; Tukey’s post hoc test). n.s. not significant. d Superimposed traces of voltage (top) following current injection (bottom) for proprioceptors exhibiting a single action potential (AP) irrespective of the current injected. e Similar to d, for a proprioceptor exhibiting a short duration burst of action potentials. f Traces from a tonic firing proprioceptor. Bar graphs showing differences in soma size (g), resting membrane potential (h), Rheobase (i), and Capacitance (j) across proprioceptor neurons (n = 43). Data expressed as mean ± S.D.; p values for size p = 0.0112; resting membrane potential (Vm) p = 0.0065; rheobase p = 0.0046; capacitance p = 0.0117 (one-way ANOVA; Tukey’s post hoc test). n.s. not significant. kp Superimposed traces of voltage responses (top) following current injection (bottom) for proprioceptors exhibiting a single action potential (AP; irrespective of the current injected) (k) (n = 12), burst firing (m) (n = 5), or tonic firing (o) (n = 4), before, during, and after wash-out of 20 nM DTXα. Frequency-current plots for Single AP (l), burst (n), or tonic (p) neurons in response to current steps (relative to rheobase) before or during application of DTXα. Data expressed as mean ± S.E.M.; p values. l Single AP, current −50 pA (p > 0.999), rheobase (p = 0.6007), +50 pA (p = 0.1404), +100 (p = 0.0526), +150 pA (p = 0.0006), +200 pA (p < 0.0001), +250 pA (p < 0.0001), +300 pA (p < 0.0001). n Burst, current −50 pA (p > 0.999), rheobase (p > 0.999), +50 pA (p = 0.9579), +100 (p = 0.8329), +150 pA (p = 0.1746), +200 pA (p = 0.0057), +250 pA (p = 0.0005), +300 pA (p < 0.0001). p Tonic, current −50 pA (p > 0.999), rheobase (p = 0.9624), +50 pA (p = 0.7957), +100 (p = 0.1611), +150 pA (p = 0.9812), +200 pA (p = 0.7776), +250 pA (p = 0.1904), +300 pA (p = 0.3005) (two-tailed paired t-test).
Fig. 7
Fig. 7. Proprioceptor transcriptome profiling shows dynamic transcriptional changes across development.
a Experimental paradigm for proprioceptor transcriptome analysis across different developmental stages. Developmental stages include e14.5, p0, p12, and adult (≥p56). p0 and p12 neurons were isolated as described for the adult dataset. Due to the inefficient PV:Cre-mediated recombination at early developmental stages, e14.5 neurons were isolated using a TrkC:tdTomato reporter. As described for adult pSNs, viable tdT+ pSNs neurons were isolated by FACS and directly deposited into 96-well plates. be tSNE plots at each time point profiled, with cells colored by cluster identity, using the same clustering technique (see “Methods”) used to identify putative cell types in the adult in Fig. 2. f Coexpression patterns of genes with observed coexpression in the adult. For each time point, the heatmap represents pairwise gene–gene correlation values (Pearson’s r using log-transformed CPM data). Because genes were selected based on co-expression in the adult (a subset of cluster-specific genes shown in Fig. 2g), the correlations are strongest in the adult. At p12, only the putative group Ib genes show strong correlations, whereas by p0 and e14, the overall correlations are substantially weaker. This suggests that general cell type-specific gene coexpression patterns in the adult differ from those in development. gl Developmental expression patterns of Calretinin (CR), Pou4f3 and Substance P (Sub.P). Expression of CR (g), Pou4f3 (i), and Substance P (k) in p0 lumbar DRG of PVRx3:tdT mice. Percentage of CR+ (h), Pou4f3+ (j), or Sub. P+ (l) pSNs (defined by PVRx3:tdT+ or PV+Rx3+ neurons) at different developmental stages. Mean percentage ± S.E.M. for CR at p0: 0 ± 0%, n = 10 sections; at p6: 4.8 ± 1.6%, n = 26 sections; at p12: 22.5 ± 1.8%, n = 29 sections; at ≥p56: 19.4 ± 1.6%, n = 65 sections. Mean percentage ± S.E.M. for Pou4f3 at e15.5: 59.6 ± 3.5%, n = 22 sections; at p0: 13.5 ± 3.0%, n = 17 sections; at p6: 21.4 ± 5.2%, n = 28 sections; at ≥p56: 23.1 ± 2.8%, n = 95 sections. Mean percentage ± S.E.M. for Sub. P at p0: 2.0 ± 1.1%, n = 20 sections; at p6: 4.5 ± 1.2%, n = 25 sections; at p12: 11.3 ± 1.2%, n = 30 sections; at ≥p56: 8.8 ± 1.3%, n = 22 sections. Similar data obtained from at least three (g, i, k) biological replicates. In boxplots (h, j, l), boxes indicate medians and 25th/75th percentiles, and whiskers extend to the furthest point <1.5 standard deviations from the mean. Scale 10 μm.

References

    1. Sherrington C. On the proprio-ceptive system, especially in its reflex aspects. Brain. 1907;29:467–482. doi: 10.1093/brain/29.4.467. - DOI
    1. Proske U, Gandevia SC. The proprioceptive senses: their roles in signaling body shape, body position and movement, and muscle force. Physiol. Rev. 2012;92:1651–1697. doi: 10.1152/physrev.00048.2011. - DOI - PubMed
    1. Tuthill JC, Azim E. Proprioception. Curr. Biol. 2018;28:R194–R203. doi: 10.1016/j.cub.2018.01.064. - DOI - PubMed
    1. Pearson KG. Generating the walking gait: role of sensory feedback. Prog. Brain Res. 2004;143:123–129. doi: 10.1016/S0079-6123(03)43012-4. - DOI - PubMed
    1. Windhorst U. Muscle proprioceptive feedback and spinal networks. Brain Res. Bull. 2007;73:155–202. doi: 10.1016/j.brainresbull.2007.03.010. - DOI - PubMed

Publication types