. 2021 Mar 1;12(1):1357.
doi: 10.1038/s41467-021-21256-7.

Cavity-enhanced microwave readout of a solid-state spin sensor

Affiliations

Cavity-enhanced microwave readout of a solid-state spin sensor

Erik R Eisenach et al. Nat Commun. .

Abstract

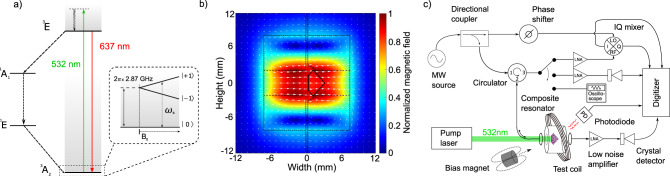
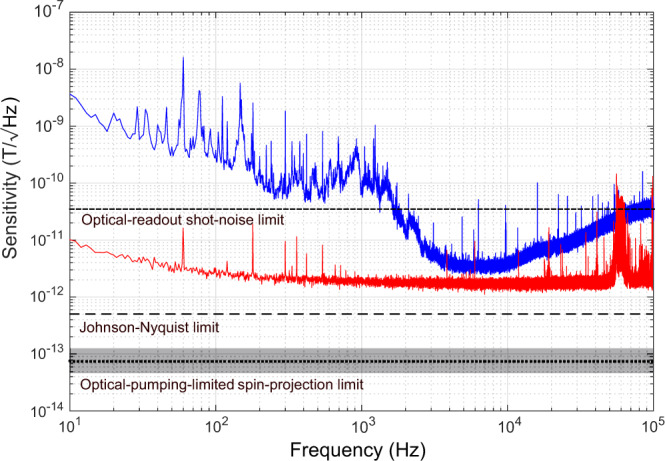
Overcoming poor readout is an increasingly urgent challenge for devices based on solid-state spin defects, particularly given their rapid adoption in quantum sensing, quantum information, and tests of fundamental physics. However, in spite of experimental progress in specific systems, solid-state spin sensors still lack a universal, high-fidelity readout technique. Here we demonstrate high-fidelity, room-temperature readout of an ensemble of nitrogen-vacancy centers via strong coupling to a dielectric microwave cavity, building on similar techniques commonly applied in cryogenic circuit cavity quantum electrodynamics. This strong collective interaction allows the spin ensemble's microwave transition to be probed directly, thereby overcoming the optical photon shot noise limitations of conventional fluorescence readout. Applying this technique to magnetometry, we show magnetic sensitivity approaching the Johnson-Nyquist noise limit of the system. Our results pave a clear path to achieve unity readout fidelity of solid-state spin sensors through increased ensemble size, reduced spin-resonance linewidth, or improved cavity quality factor.


Conflict of interest statement

The authors declare no competing interests.

Figures

Fig. 1
Fig. 1. Experimental setup for MW cavity readout of NV- centers in diamond.
a Level diagram. The NV- ground-state spin triplet (3A2) exhibits a 2.87 GHz zero-field splitting between the ms=0 and degenerate ms=±1 states. This degeneracy may be lifted by application of a bias magnetic field B0, allowing individual addressing of either the ms=0ms=1 or ms=0ms=+1 transitions. Optical pumping with 532 nm light initializes spins to the ms=0 state via a non-radiative decay path (1A1 → 1E). b Microwave cavity magnetic field. Interactions between the interrogation photons and the NV- ensemble can be enhanced by placing the diamond inside a cavity resonant with the applied photons. As illustrated in the axial cut of the composite cavity, the diamond (solid black line) is placed near the antinode of the magnetic field (white arrows) created by the two dielectric resonators (black dashed lines). c Device schematic. Applied MWs near-resonant with both the cavity and spin transitions are split into a signal component which interrogates the composite cavity through a circulator (lower branch) and a reference component (upper branch). Microwaves reflected from the composite cavity are amplified before being mixed with the reference component by an IQ mixer whose dual outputs are digitized. Alternatively, reflected MWs can be read out via a MW crystal detector or measured directly using an oscilloscope with a sufficiently high sampling rate. Transmission measurements employ only an amplifier and a crystal detector. A photodiode monitoring red fluorescence allows simultaneous optical readout.
Fig. 2
Fig. 2. Strong ensemble-cavity coupling under ambient conditions.
The spin resonance frequency is swept relative to the bare cavity resonance (horizontal axis) by varying the applied magnetic field; simultaneously varying the MW drive frequency (vertical axis) reveals the spin-ensemble-modified composite cavity resonance. Data are recorded both in reflection (a) and transmission (b). The data are fit (c, d) to (2) and (4) using a 2D nonlinear least-squares solver. The fit gives geff = 2π × 0.70 MHz; see Methods for additional fit parameters. Each plot is normalized to unity, and recorded data are taken with −56 dBm of MW drive power.
Fig. 3
Fig. 3. Comparison of contrast and linewidth in MW cavity readout magnetic resonance and ODMR.
The signal associated with the NV ms=0ms=+1 magnetic resonance is recorded simultaneously using MW cavity readout (blue solid line) and conventional optical readout (red solid line). The MW cavity readout realizes contrast C = 0.97, limited by imperfect circulator isolation, while conventional optical readout realizes contrast C = 0.05 (see Methods). For ease of comparison with the ODMR lineshape, MW cavity readout is performed here using a phase-insensitive measurement of reflected MW power, rather than the phase-sensitive technique; see Methods. Fits from the inhomogeneously-broadened numerical model (blue dashed line) and a Lorentzian model of ODMR (red dashed line) are also shown; see Supplementary Note 5. All 14N hyperfine transitions are included in both models, but the hyperfine structure is not resolved due to the substantial inhomogeneous broadening. The inset shows both readout signals scaled to the same peak-to-peak values, highlighting the ≈2 × narrowing of the magnetic resonance feature observed with MW cavity readout. The left-right asymmetry in the MW cavity readout signal is attributed to ≈−20 kHz detuning of the applied microwaves from the bare cavity resonance. The applied MW power is 10 dBm.
Fig. 4
Fig. 4. MW cavity readout magnetometer sensitivity.
Based on noise spectral density measured during magnetometer operation (blue solid line), we project a sensitivity of ≈ 3 pT/Hz in the band from 5 kHz to 10 kHz, where sensitivity approaches the limit set by the measured noise floor of the amplifier and digitizer electronics (red solid line). Also depicted are the optical-readout shot-noise limit (black short dashed line) of the experimental setup, the calculated Johnson-Nyquist noise limit (black long dashed line) of 0.5 pT/Hz and the optical-pumping-limited spin-projection limit (black dotted line). The optical-pumping-limited spin-projection limit is bounded above and below (gray shaded box) to illustrate uncertainty arising from estimating the optical pumping relaxation time T1op (see Methods). Magnetometry is performed using the phase-sensitive technique of recording reflected MW voltage through the IQ mixer; IQ traces are shown in Supplementary Note 5.

References

    1. Taylor JM, et al. High-sensitivity diamond magnetometer with nanoscale resolution. Nat. Phys. 2008;4:810–816. doi: 10.1038/nphys1075. - DOI
    1. Chen EH, et al. High-sensitivity spin-based electrometry with an ensemble of nitrogen-vacancy centers in diamond. Phys. Rev. A. 2017;95:053417. doi: 10.1103/PhysRevA.95.053417. - DOI
    1. Hodges JS, et al. Timekeeping with electron spin states in diamond. Phys. Rev. A. 2013;87:032118. doi: 10.1103/PhysRevA.87.032118. - DOI
    1. Neumann P, et al. High-precision nanoscale temperature sensing using single defects in diamond. Nano Lett. 2013;13:2738–2742. doi: 10.1021/nl401216y. - DOI - PubMed
    1. Degen CL, Reinhard F, Cappellaro P. Quantum sensing. Rev. Mod. Phys. 2017;89:035002. doi: 10.1103/RevModPhys.89.035002. - DOI