. 2021 Mar 1;7(1):19.
doi: 10.1038/s41523-020-00205-5.

Unmasking the immune microecology of ductal carcinoma in situ with deep learning

Affiliations

Unmasking the immune microecology of ductal carcinoma in situ with deep learning

Priya Lakshmi Narayanan et al. NPJ Breast Cancer. .

Abstract

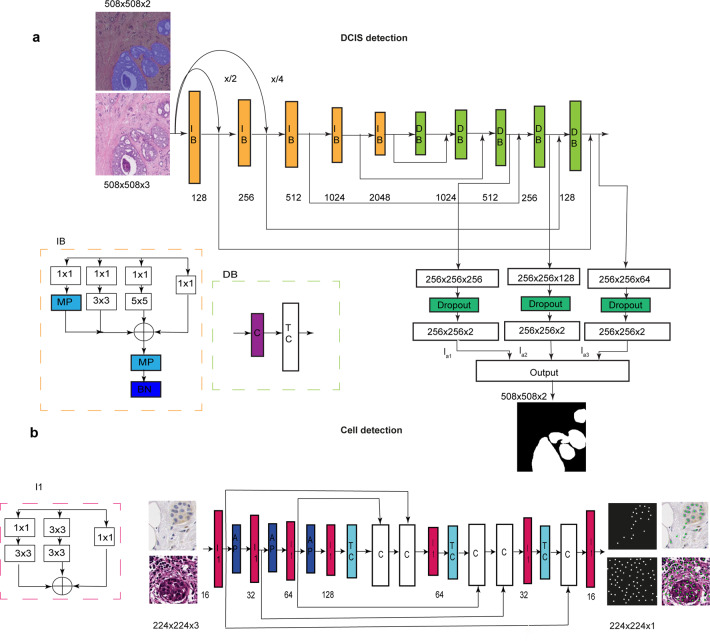
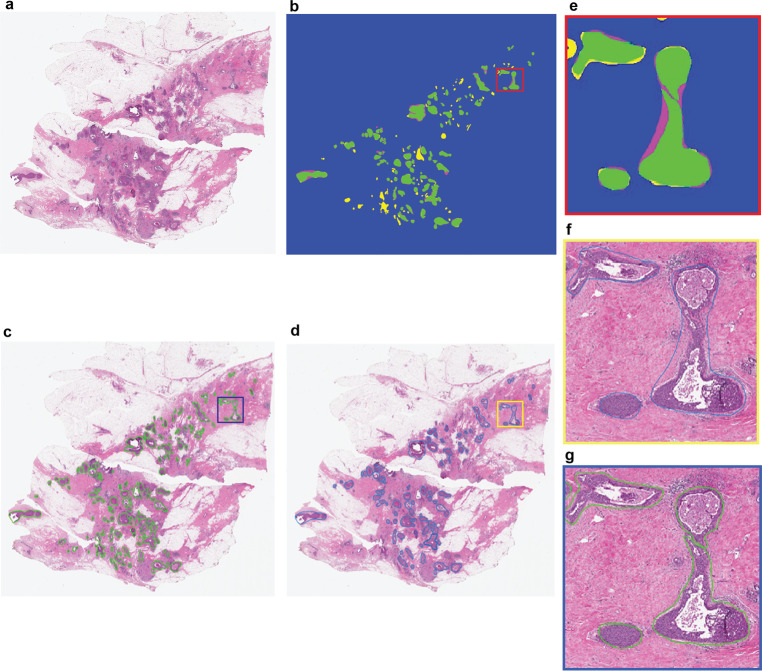
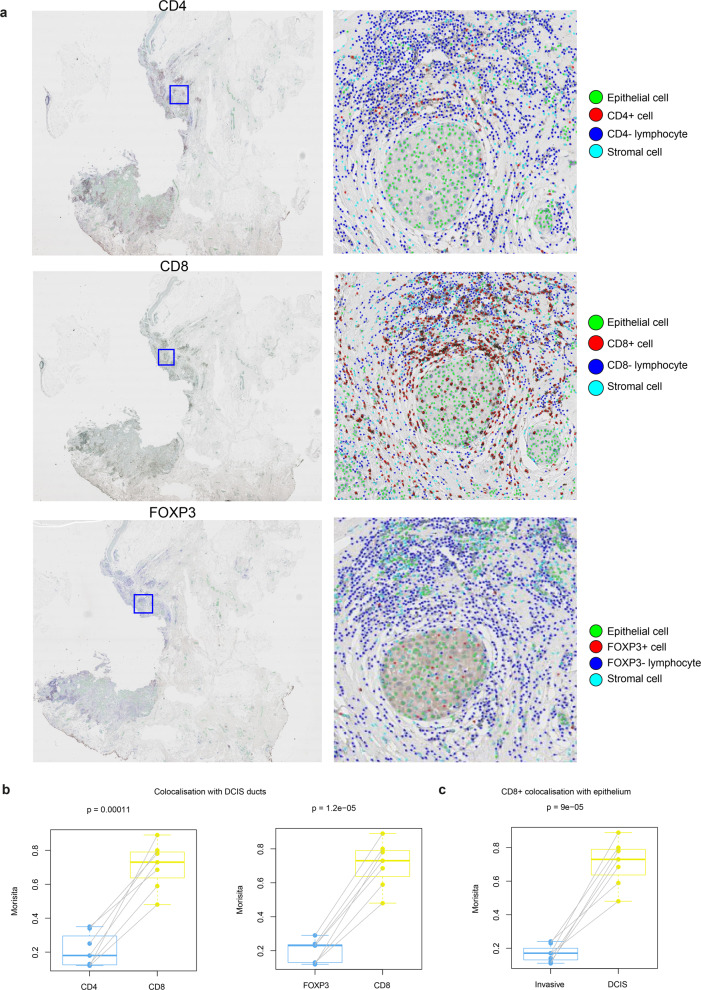
Despite increasing evidence supporting the clinical relevance of tumour infiltrating lymphocytes (TILs) in invasive breast cancer, TIL spatial variability within ductal carcinoma in situ (DCIS) samples and its association with progression are not well understood. To characterise tissue spatial architecture and the microenvironment of DCIS, we designed and validated a new deep learning pipeline, UNMaSk. Following automated detection of individual DCIS ducts using a new method IM-Net, we applied spatial tessellation to create virtual boundaries for each duct. To study local TIL infiltration for each duct, DRDIN was developed for mapping the distribution of TILs. In a dataset comprising grade 2-3 pure DCIS and DCIS adjacent to invasive cancer (adjacent DCIS), we found that pure DCIS cases had more TILs compared to adjacent DCIS. However, the colocalisation of TILs with DCIS ducts was significantly lower in pure DCIS compared to adjacent DCIS, which may suggest a more inflamed tissue ecology local to DCIS ducts in adjacent DCIS cases. Our study demonstrates that technological developments in deep convolutional neural networks and digital pathology can enable an automated morphological and microenvironmental analysis of DCIS, providing a new way to study differential immune ecology for individual ducts and identify new markers of progression.


Conflict of interest statement

The funders had no role in the design of the study; the collection, analysis, or interpretation of the data; the writing of the manuscript; or the decision to submit the manuscript for publication. Y.Y. has received speakers bureau honoraria from Roche and consulted for Merck and Co Inc. M.D. declares advisory fees from Radius, G1-Therapeutics, AbbVie, H3Biomedicine, Zentalis and Lilly, lecture fees from Nanostring and BCN Science and institutional grants from Pfizer and Lilly. All other authors declare that there are no competing interests.

Figures

Fig. 1
Fig. 1. Overview of proposed UNMaSk pipeline for DCIS detection and segmentation.
a UNet architecture for tissue segmentation and one of the existing deep learning methods, single-shot detector (SSD) architecture, used for DCIS detection. b Spatial Voronoi tessellation to examine local tissue ecology for each DCIS duct, based on deep learning results on DCIS segmentation and single-cell classification. Examples shown are immune depleted and immune predominant/inflamed ecology local to individual DCIS ducts and spatial analysis using DCIS immune colocalisation/Morisita Score (MS).
Fig. 2
Fig. 2. Schematic of IM-Net architecture for detection and segmentation of DCIS and schematic of DRDIN cell detection network.
a IM-Net architecture. Five inception blocks (IB) in the contracting path and five decoder blocks (DB) in the expanding path used to encode features along with spatial context with multiple inputs applied to the respective first three blocks. Inception blocks with batch normalisation performed on resized images generate feature maps from the convolution blocks (IB1, IB2 and IB3). Resized image by a factor of 2 and 4 are represented as x/2 and x/4, respectively. Features from the convolution blocks were preserved and passed to the expanding path comprising decoder block with concatenate (C) and transpose convolution block (TC) as the basic units that aid to preserve crucial low-level information for DCIS boundary localisation. b DRDIN architecture has a dense cross-connection from the inception blocks (I1) in the encoder and the decoder path. Components of I1 comprises 3 × 3 and 1 × 1 kernel convolutional filters. In the encoder path, average pooling (AP) is used and the decoder path consisted of transpose convolution (TC), concatenate (C) layers.
Fig. 3
Fig. 3. Representative H&E image with DCIS segmentation output from IM-Net.
a H&E image. b Spatial overlap between the pathologist annotation and DCIS detection using IM-Net. Visual representation of DICE overlap image map in terms of estimated DICE coefficient. True positive (TP) in green represent the expert annotations overlap with the segmented region of DCIS; false-negative (FN) in magenta represent DCIS regions in annotation and not in DCIS segmentation. False-positive (FP) in yellow represent pixels falsely segmented as DCIS and not in expert annotation. True negative (TN) represented in blue are pixels were correctly detected as background in both expert and DCIS detection. Inspection of the false-positive regions indicated that some of these were DCIS but contained tissue artefacts or tears, which prevented pathologist from annotating them. c DCIS segmentation based on IM-Net. d Pathologist annotation of DCIS on H&E image. e Region of interest depicting the DICE overlap image map. f, g Region of interest depicted from pathologist and IM-Net approach, respectively.
Fig. 4
Fig. 4. Biological validation of automated DCIS detection using CK5 immunohistochemistry.
a An example showing CK5 IHC image where DCIS regions were annotated by hand following the CK5 expression pattern, indicated by green contour. b Segmented H&E image with DCIS regions marked in blue contour by IM-Net for the same sample. c Quantitative assessment of the IHC-H&E correlation between H&E-based automated DCIS detection result and hand annotations on IHC using an estimated number of DCIS. d Quantitative assessment of the IHC-H&E correlation between H&E-based automated DCIS detection result and hand annotations on IHC using an estimated area of DCIS.
Fig. 5
Fig. 5. UNMaSk results with single-cell classification and Voronoi tessellation.
a A representative example of an adjacent DCIS case illustrating single-cell classification results in two DCIS regions. Scale bar represents 100 µm. b High-resolution images of areas within the two DCIS regions, showing single-cell classification using unified segmentation and classification pipeline based on DRDIN and SCCNN, classifying cells into the epithelial cell (green), stromal cell (yellow) and lymphocyte (blue). Scale bar represents 50 µm. c Heatmap showing lymphocyte cell density based on single-cell classification results. d Voronoi tessellation using the centres of DCIS ducts as seeds, performed over tissue region excluding epithelial cells identified by single-cell classification that was not DCIS. Because of the mathematical principles underlying Voronoi tessellations, lymphocytes within a polygon will be closer to its seed than any other seeds. This means that each lymphocyte can now be assigned to its closest DCIS duct within the tessellation space, thereby quantifying lymphocyte abundance for each DCIS duct locally. Note that because convex polygon was used, some of the DCIS ducts closer to the invasive region were omitted from the analysis. Scale bar represents 100 µm.
Fig. 6
Fig. 6. Comparison of TIL distribution pattern local to DCIS ducts in adjacent versus pure DCIS cases.
a Voronoi tessellation of adjacent DCIS excluding invasive components. b Voronoi tessellation of pure DCIS. Scale bar represents 100 µm. c Representative DCIS region enclosed within the Voronoi of adjacent DCIS. d Representative DCIS region enclosed within the Voronoi of pure DCIS. e Boxplots illustrating the difference in DCIS immune colocalisation score calculated using the Morisita index. It was computed by associating individual DCIS duct with the surrounding lymphocytes within the Voronoi region; a high score indicates the spatial colocalisation of lymphocytes and DCIS ducts. Each point corresponds to a WSI image, 52 WSI from n = 40 patients in the pure DCIS and 40 WSI from n = 25 patients in the adjacent DCIS group. f Boxplots illustrating the difference in overall lymphocyte percentage in all cells for WSIs of pure DCIS and adjacent DCIS cases (after exclusion of invasive tumour regions), using only single-cell classifications.
Fig. 7
Fig. 7. Spatial colocalisation patterns of TIL subset in adjacent DCIS samples in the IHC dataset.
a Low power CD4, CD8, FOXP3 IHC images of a sample and high-resolution images of a region of DCIS showing single-cell detection and classification using DRDIN and SCCNN. b Boxplots showing differences in DCIS immune colocalisation score between CD8+, CD4+ and FOXP3+ cells using paired tests. c Boxplots showing the difference in CD8+ cell colocalisation between DCIS and invasive epithelium indicating differential immune response within the same sample in different compartments. DCIS immune colocalisation score is referred to as Morisita to conserve space in the representation.
Fig. 8
Fig. 8
Representative examples of DCIS from the Duke and TransATAC cohorts with different growth patterns.

References

    1. Allred DC, et al. Ductal carcinoma in situ: terminology, classification, and natural history. J. Natl Cancer Inst. Monogr. 2010;2010:134–138. doi: 10.1093/jncimonographs/lgq035. - DOI - PMC - PubMed
    1. Leonard GD, Swain SM. Ductal carcinoma in situ, complexities and challenges. J. Natl Cancer Inst. 2004;96:906–920. doi: 10.1093/jnci/djh164. - DOI - PubMed
    1. Cowell CF, et al. Progression from ductal carcinoma in situ to invasive breast cancer: revisited. Mol. Oncol. 2013;7:859–869. doi: 10.1016/j.molonc.2013.07.005. - DOI - PMC - PubMed
    1. van Seijen, M. et al. Ductal carcinoma in situ: to treat or not to treat, that is the question. Br. J. Cancer. 121, 285–292 (2019). - PMC - PubMed
    1. Casasent AK, Edgerton M, Navin NE. Genome evolution in ductal carcinoma in situ: invasion of the clones. J. Pathol. 2017;241:208–218. doi: 10.1002/path.4840. - DOI - PMC - PubMed

LinkOut - more resources