. 2021 Mar 1;11(1):4905.
doi: 10.1038/s41598-021-84417-0.

Cerebral functional networks during sleep in young and older individuals

Affiliations

Cerebral functional networks during sleep in young and older individuals

Véronique Daneault et al. Sci Rep. .

Abstract

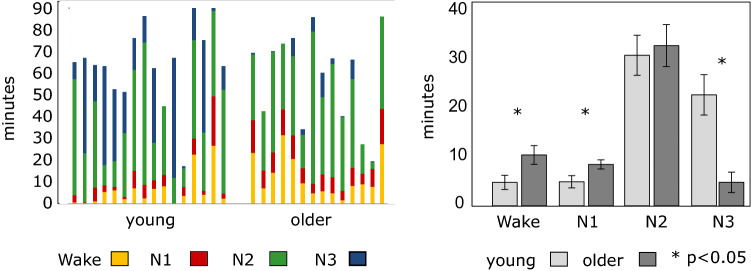
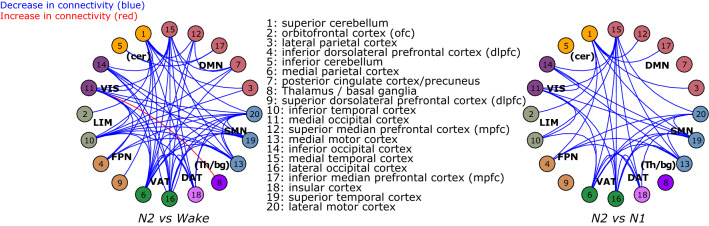
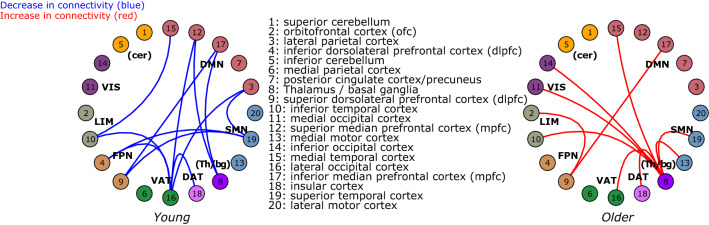
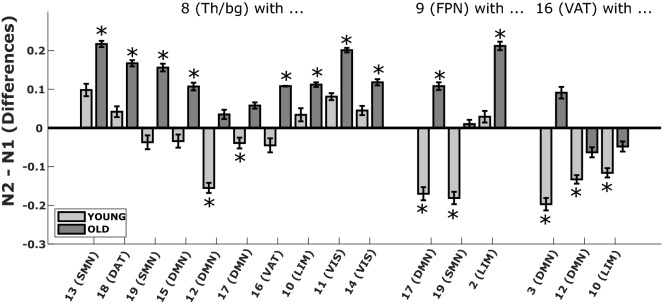
Even though sleep modification is a hallmark of the aging process, age-related changes in functional connectivity using functional Magnetic Resonance Imaging (fMRI) during sleep, remain unknown. Here, we combined electroencephalography and fMRI to examine functional connectivity differences between wakefulness and light sleep stages (N1 and N2 stages) in 16 young (23.1 ± 3.3y; 7 women), and 14 older individuals (59.6 ± 5.7y; 8 women). Results revealed extended, distributed (inter-between) and local (intra-within) decreases in network connectivity during sleep both in young and older individuals. However, compared to the young participants, older individuals showed lower decreases in connectivity or even increases in connectivity between thalamus/basal ganglia and several cerebral regions as well as between frontal regions of various networks. These findings reflect a reduced ability of the older brain to disconnect during sleep that may impede optimal disengagement for loss of responsiveness, enhanced lighter and fragmented sleep, and contribute to age effects on sleep-dependent brain plasticity.


Conflict of interest statement

The authors declare no competing interests.

Figures

Figure 1
Figure 1
Duration of wakefulness and sleep stages recorded in the scanner. Left panel represents individuals’ times in wakefulness and each sleep stage (duration in min). Right panel represents group values in wakefulness and each sleep stage. Young participants are presented in light grey, older participants in darker grey. Duration of wakefulness, N1, N2, and N3 (mean ± SEM) were recorded in the scanner (after exclusion of EEG epochs associated with high motion in the fMRI series; see “Materials and methods” section).
Figure 2
Figure 2
Brain parcellation into 20 clusters. This figure represents each of the 20 functional brain clusters in white on a select brain plane (see “Materials and methods” section). Names and numbers of clusters are as follows: 1—superior cerebellum; 2—orbitofrontal cortex (ofc); 3—lateral parietal cortex; 4—inferior dorsolateral prefrontal cortex (dlpfc); 5—inferior cerebellum; 6—median parietal cortex; 7—posterior cingulate cortex (pcc) and precuneus; 8—thalamus/basal ganglia; 9—superior dorsolateral prefrontal cortex (dlpfc); 10—inferior temporal cortex; 11—median occipital cortex; 12—superior median prefrontal cortex; 13—median motor cortex; 14—inferior occipital cortex; 15—median temporal cortex; 16—lateral occipital cortex; 17—inferior median prefrontal cortex (mpfc); 18—insular cortex; 19—superior temporal cortex; 20—lateral motor cortex.
Figure 3
Figure 3
Similar age-group connectivity changes between N2 and wakefulness and between N2 and N1 sleep stage transition. This graph represents changes in functional connectivity between the clusters (two-way directionality) obtained from the data-driven parcellation (circles with numbers) shared by young and older individuals between N2 and wake (left side) and N2 and N1 (right side). Significant connectivity decreases (blue lines) were mostly observed whereas one connectivity increase (red line) was significant between N2 and wake. The seven Yeo’s large-scale networks partitioning the brain are presented with different colors: the default-mode network (DMN); the sensorimotor network (SMN); the dorsal attentional network (DAT); the ventral attentional network (VAT); the frontoparietal network (FPN); the limbic network (LIM) and the visual network (VIS). Clusters of the inferior and superior cerebellum (cer) and the thalamus/basal ganglia (Th/bg) were also added (see Fig. 2 for details on the subdivision of clusters).
Figure 4
Figure 4
Significant age-group differences in connectivity for the N1 to N2 sleep stage transition. This graph represents significant interaction changes in functional connectivity between the clusters (two-way directionality) obtained from the data driven parcellation (circles with numbers) for the N2 to N1 sleep stage transition. Blue lines (left panel) indicate stronger decreases in connectivity in younger as compared to older individuals. Red lines (right panel) indicate significant connectivity increases in the older groups only. The seven Yeo’s large-scale networks partitioning the brain are presented with different colors: The default-mode network (DMN); the sensorimotor network (SMN); the dorsal attentional network (DAT); the ventral attentional network (VAT); the l frontoparietal network (FPN); the limbic network (LIM) in green and the visual network (VIS). We added the inferior and superior cerebellum (cer) and thalamus/basal ganglia (Th/bg) clusters (see supplementary material for more details on clusters’ subdivision).
Figure 5
Figure 5
Examples of functional connectivity differences in young and older individuals for N2 vs. N1. This graph is a sample of the connectivity values (R-value; Pearson correlation coefficient) associated with the N2 and N1 comparison between specific clusters and networks that behave differently in young (light grey) and in older individuals (darker grey). Asterisks indicate a significant decrease or increase in functional connectivity for young or/and older groups. Examples of the between-inter networks’ interactions are presented for the default-mode network (DMN), the sensorimotor network (SMN), the dorsal attentional network (DAT), the ventral attentional network (VAT), the frontoparietal network (FPN), the limbic network (LIM) and the visual network (VIS) and thalamus/basal ganglia (Th/bg) clusters (see Fig. 2 and this figure for more details on the subdivision of clusters and for an exhaustive description of functional connectivity differences).

References

    1. Tagliazucchi E, van Someren EJW. The large-scale functional connectivity correlates of consciousness and arousal during the healthy and pathological human sleep cycle. Neuroimage. 2017;160:55–72. doi: 10.1016/j.neuroimage.2017.06.026. - DOI - PubMed
    1. Andrade KC, et al. Sleep spindles and hippocampal functional connectivity in human NREM sleep. J. Neurosci. 2011;31:10331–10339. doi: 10.1523/JNEUROSCI.5660-10.2011. - DOI - PMC - PubMed
    1. Boly M, et al. Hierarchical clustering of brain activity during human nonrapid eye movement sleep. Proc. Natl. Acad. Sci. U.S.A. 2012;109:5856–5861. doi: 10.1073/pnas.1111133109. - DOI - PMC - PubMed
    1. Hale JR, et al. Altered thalamocortical and intra-thalamic functional connectivity during light sleep compared with wake. Neuroimage. 2016;125:657–667. doi: 10.1016/j.neuroimage.2015.10.041. - DOI - PubMed
    1. Larson-Prior LJ, et al. Modulation of the brain's functional network architecture in the transition from wake to sleep. Prog. Brain Res. 2011;193:277–294. doi: 10.1016/B978-0-444-53839-0.00018-1. - DOI - PMC - PubMed

Publication types

Grants and funding