. 2021 Aug;28(8):2315-2332.
doi: 10.1038/s41418-021-00754-7. Epub 2021 Mar 1.

Deubiquitinase USP39 and E3 ligase TRIM26 balance the level of ZEB1 ubiquitination and thereby determine the progression of hepatocellular carcinoma

Affiliations

Deubiquitinase USP39 and E3 ligase TRIM26 balance the level of ZEB1 ubiquitination and thereby determine the progression of hepatocellular carcinoma

Xiaomei Li et al. Cell Death Differ. 2021 Aug.

Abstract

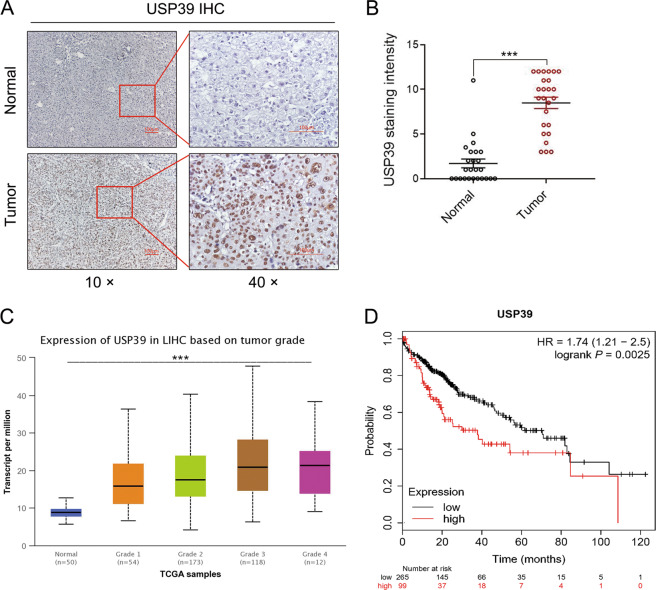
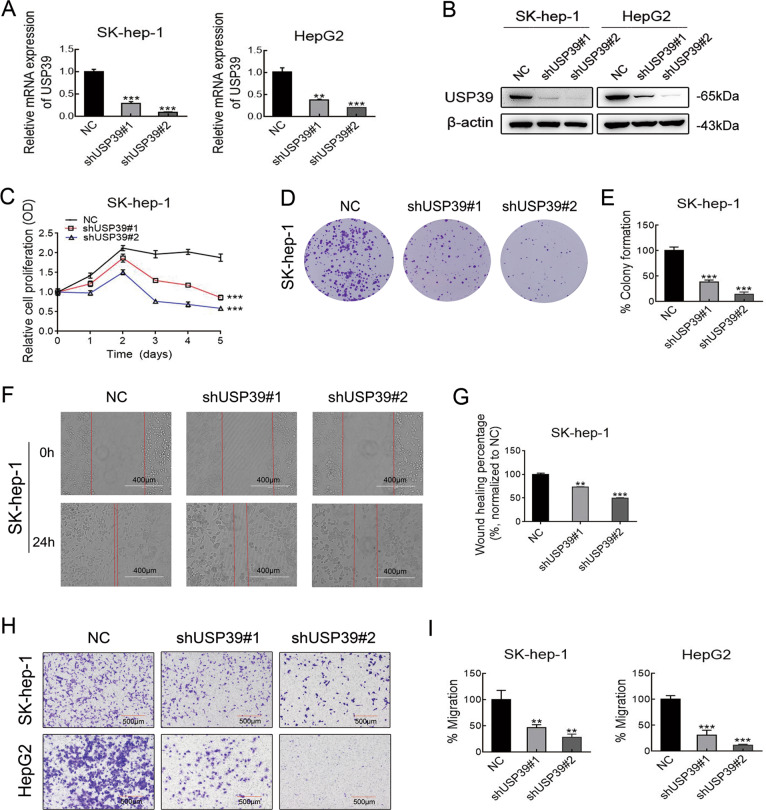
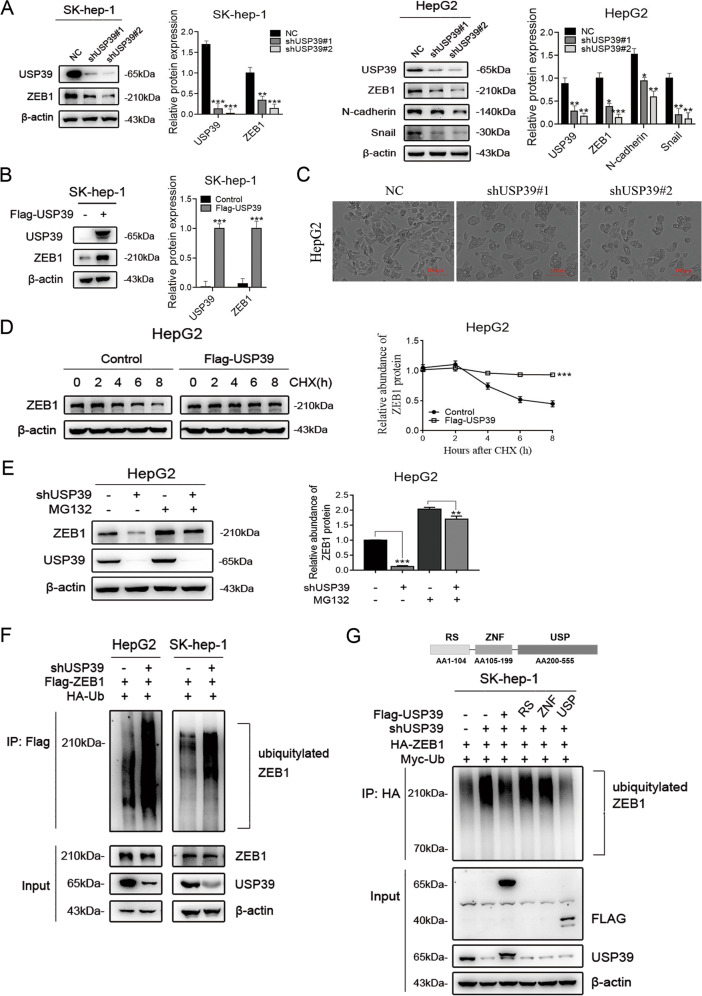
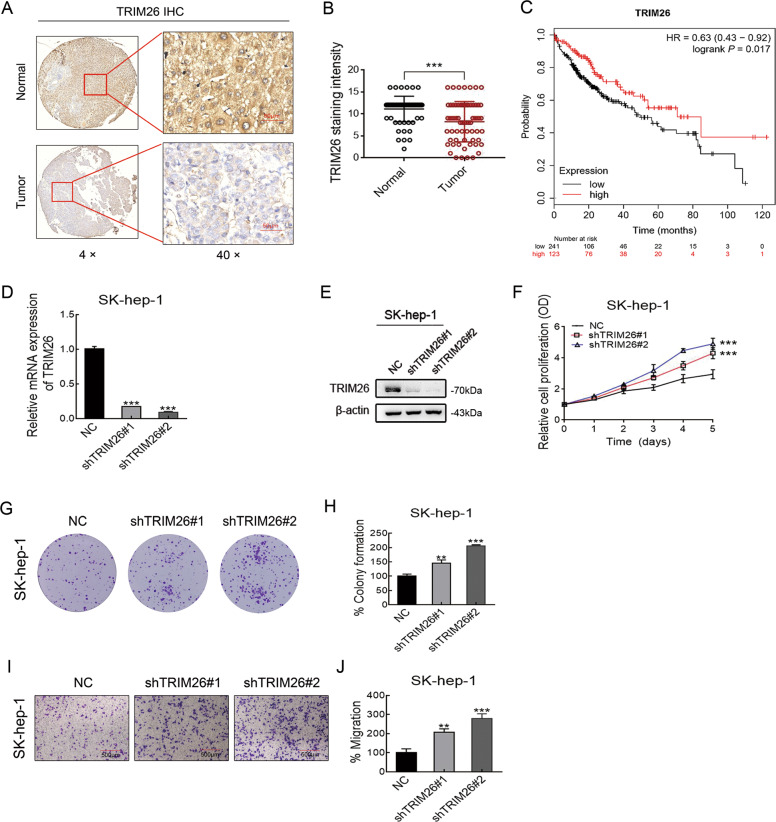
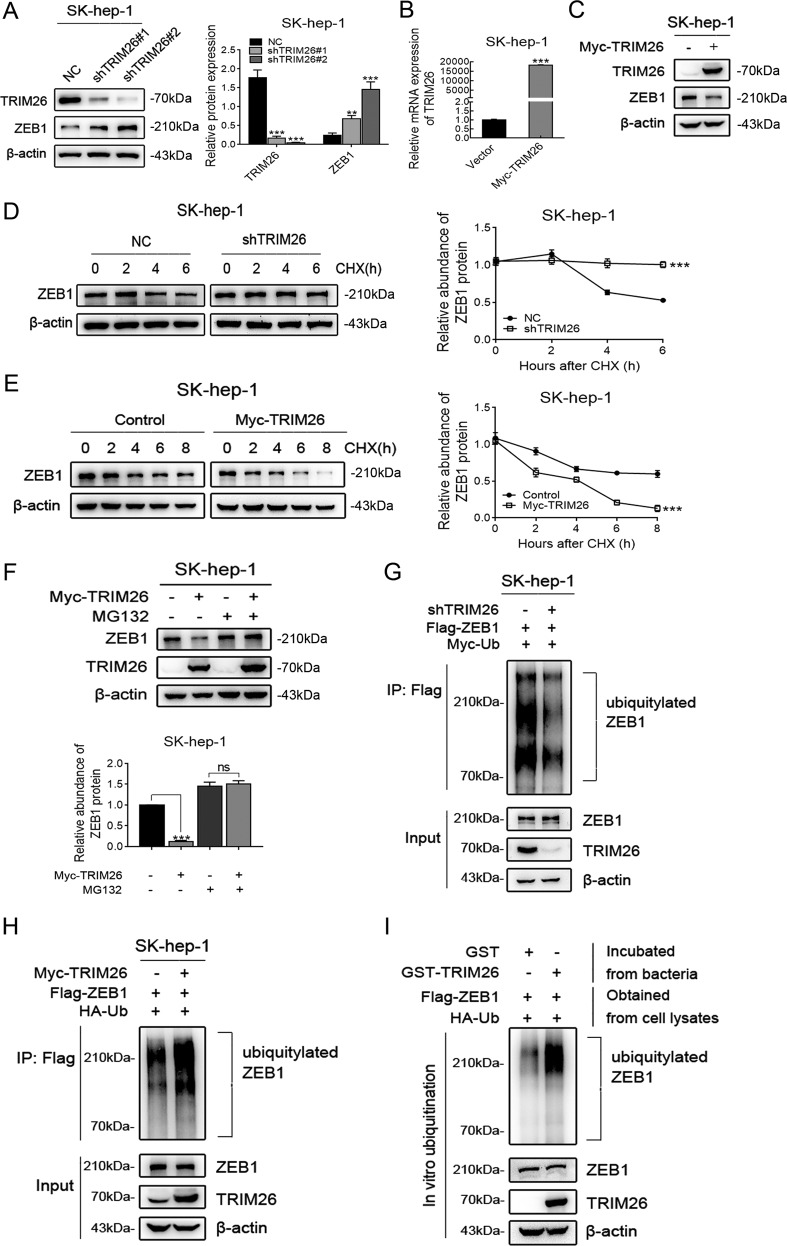
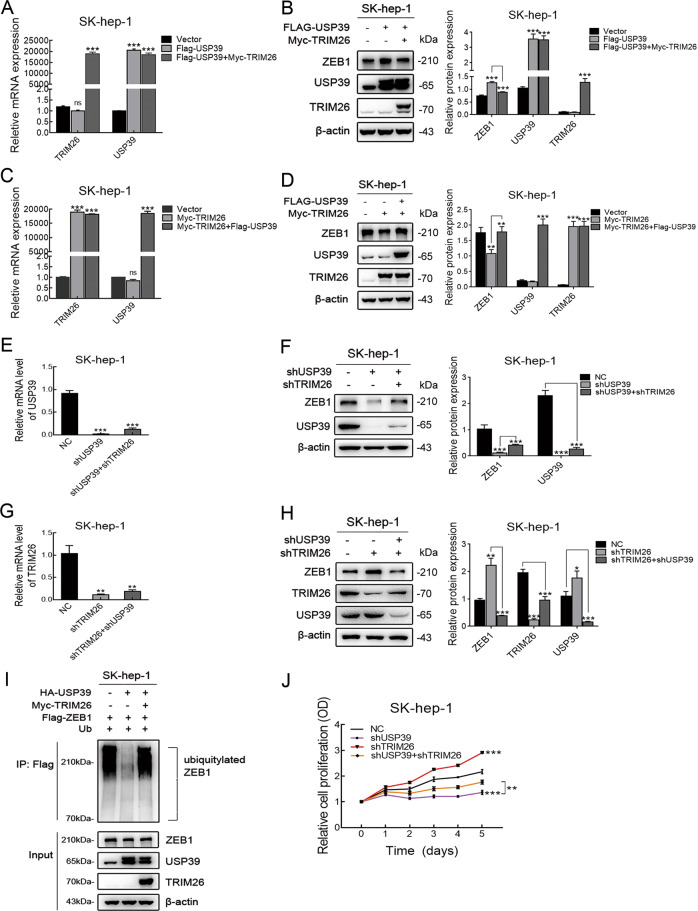
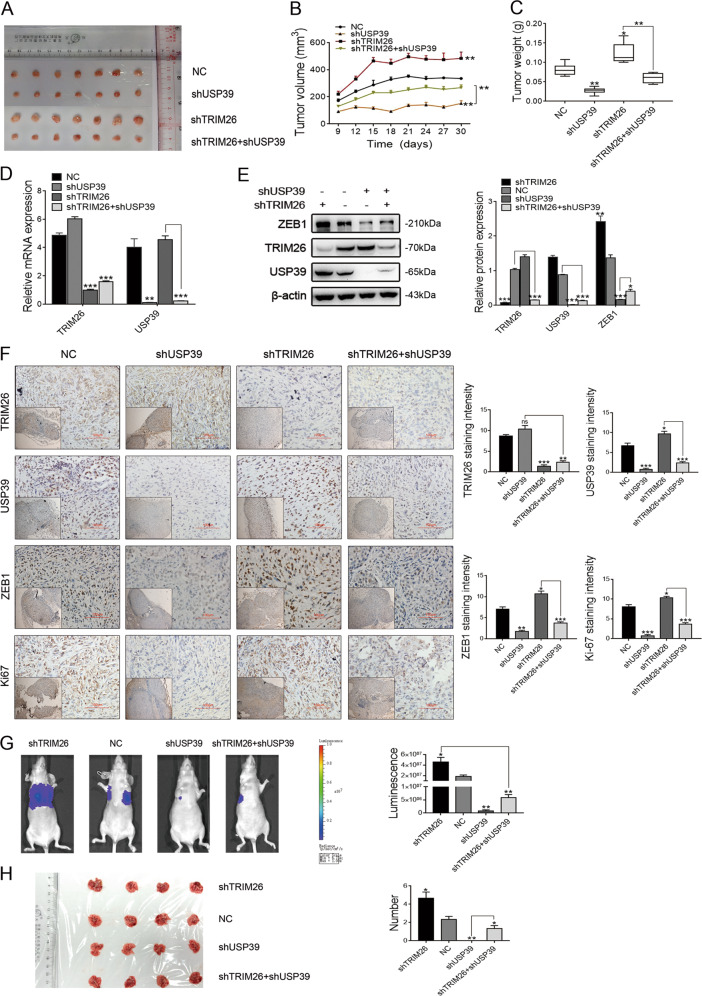
Emerging evidence suggests that USP39 plays an important role in the development of hepatocellular carcinoma (HCC). However, the molecular mechanism by which USP39 promotes HCC progression has not been well defined, especially regarding its putative ubiquitination function. Zinc-finger E-box-binding homeobox 1 (ZEB1) is a crucial inducer of epithelial-to-mesenchymal transition (EMT) to promote tumor proliferation and metastasis, but the regulatory mechanism of ZEB1 stability in HCC remains enigmatic. Here, we reveal that USP39 is highly expressed in human HCC tissues and correlated with poor prognosis. Moreover, USP39 depletion inhibits HCC cell proliferation and metastasis by promoting ZEB1 degradation. Intriguingly, deubiquitinase USP39 has a direct interaction with the E3 ligase TRIM26 identified by co-immunoprecipitation assays and immunofluorescence staining assays. We further demonstrate that TRIM26 is lowly expressed in human HCC tissues and inhibits HCC cell proliferation and migration. TRIM26 promotes the degradation of ZEB1 protein by ubiquitination in HCC. Deubiquitinase USP39 and E3 ligase TRIM26 function in an antagonistic pattern, but not a competitive pattern, and play key roles in controlling ZEB1 stability to determine the HCC progression. In summary, our data reveal a previously unknown mechanism that USP39 and TRIM26 balance the level of ZEB1 ubiquitination and thereby determine HCC cell proliferation and migration. This novel mechanism may provide new approaches to target treatment for inhibiting HCC development by restoring TRIM26 or suppressing USP39 expression in HCC cases with high ZEB1 protein levels.


Conflict of interest statement

The authors declare no competing interests.

Figures

Fig. 1
Fig. 1. USP39 is highly expressed in human HCC tissues and correlated with poor prognosis.
A Representative images (magnification, ×10 and ×40) of IHC staining for USP39 in HCC tissues and normal adjacent tissues from 25 patients. B Relative IHC staining for USP39 in HCC tissues and normal adjacent tissues (n = 25; ***P < 0.001). C Expression of USP39 is associated with tumor stage in HCC patients (***P < 0.001). D USP39 mRNA expression correlated with overall survival (OS) of HCC patients.
Fig. 2
Fig. 2. USP39 promotes HCC proliferation and migration in vitro.
A The expression of USP39 mRNA was analyzed by RT-PCR in SK-hep-1 and HepG2 HCC cells infected with shRNAs. B Western blotting analysis of USP39 protein level in SK-hep-1 and HepG2 cells infected with shRNAs. CE The effect of USP39 on HCC cells (SK-hep-1) proliferation was determined by MTT assays (C) at different time points and colony formation (D). The colony counts were normalized to the control and expressed as a percentage, and results are represented in the bar graph (E). FI Representative images of HCC cell migration ability as shown by wound-healing assays (FG) and migration assay (HI). Student’s t test: *P < 0.05; **P < 0.01; ***P < 0.001. All the data are representative of at least three independent experiments and presented as the means ± SD.
Fig. 3
Fig. 3. USP39 promotes EMT and inhibits ZEB1 ubiquitination in HCC.
A The levels of USP39, ZEB1, N-cadherin and snail in HCC cells (SK-hep-1 and HepG2) with stable USP39 downregulation were analyzed by western blotting. B Effect of USP39 overexpression on the expression level of ZEB1 was confirmed by western blotting in SK-hep-1 cell. C Representative cellular morphology change of HepG2 cell after USP39 downregulation. D Quantitation of ZEB1 in HepG2 cells transfected with USP39 expressing plasmid was monitored by western blotting at the indicated times after cyclohexamide (CHX, 0.2 mg/ml) addition. Signal for ZEB1 was quantified densitometrically and relative aboundance of ZEB1 protein at the time of CHX addition (0 h) was set to 1. E The protein level of ZEB1 in HepG2 cell transfected with shUSP39 and treated with MG132 as indicated. F ZEB1 ubiquitination in USP39-knockdown HepG2 and SK-hep-1 cells co-transfected with Flag-ZEB1 and HA-Ub. G ZEB1 ubiquitination in USP39-knockdown HepG2 cells co-transfected with different domains of USP39 and the indicated plasmids. The transfected cells were treated with MG132 (20 μM for 4 h) prior to harvest. Student’s t test: *P < 0.05; **P < 0.01; ***P < 0.001. All the data are representative of at least three independent experiments and presented as the means ± SD.
Fig. 4
Fig. 4. Deubiquitinase USP39 interacts with the E3 ligase TRIM26.
A Co-immunoprecipitation assays showed an interaction between endogenous USP39 and TRIM26 in SK-hep-1 cell. Immunoglobulin (Ig) G was used for comparison as a negative control. Whole cell lysates for input were directly subjected to IB using antibodies. B Interaction of exogenous USP39 and TRIM26 in SK-hep-1 cell. HA-flag antibody was immunoprecipitated, and USP39 bound to TRIM26 was determined using immunoblotting (IB) with an anti-TRIM26 antibody. C Immunofluorescence staining assays (magnification, ×80) of USP39 and TRIM26 in cells (SK-hep-1 and HepG2) observed by confocal microscopy.
Fig. 5
Fig. 5. TRIM26 is lowly expressed in human HCC tissues and inhibits HCC cells proliferation and migration.
A Representative images (magnification, ×40) of IHC staining for TRIM26 in HCC tissues and normal adjacent tissues. B Relative IHC staining for TRIM26 in HCC tissues and normal adjacent tissues. C TRIM26 mRNA expression correlated with overall survival (OS) of HCC patients. D The expression of TRIM26 mRNA was analyzed by RT-PCR in SK-hep-1 infected with shRNAs. E Western blotting analysis of TRIM26 protein level in SK-hep-1 cells infected with shRNAs. F MTT assay in SK-hep-1 cells transfected with shTRIM26. G, H Colony formation of SK-hep-1 HCC cells transfected with shTRIM26 (G). The colony counts were normalized to the control and expressed as a percentage, and results are represented in the bar graph (H). I, J Representative images (I) and Graphic representation (J) of the migration capacities in the TRIM26 knockdown SK-hep-1. Data are shown as the mean ± SD of three independent experiments. Student’s t test: *P < 0.05; **P < 0.01; ***P < 0.001.
Fig. 6
Fig. 6. TRIM26 promotes the degradation of ZEB1 protein by ubiquitination in HCC.
A Effect of TRIM26 knockdown on the expression of ZEB1 in SK-hep-1 cells as detected by western blot. B The mRNA expression of TRIM26 in TRIM26-transfected SK-hep-1 cell was determined by RT-PCR. C Effect of TRIM26 overexpression on the protein level of ZEB1 in SK-hep-1 cell as detected by western blot. D ZEB1 protein level in SK-hep-1 cells by downregulating TRIM26 at the indicated times after CHX (0.2 mg/ml) addition. E The amount of ZEB1 in SK-hep-1 cells transfected with TRIM26 expressing plasmid were monitored by western blotting at the indicated times after CHX (0.2 mg/ml) addition. F Levels of ZEB1 in TRIM26 over-regulated SK-hep-1 cells treated with MG132 (20 μM). G The ubiquitination of ZEB1 in TRIM26 knockdown SK-hep-1 cells co-transfected with expression plasmids encoding Flag-ZEB1 and HA-Ub. The transfected cells were treated with MG132 (20 μM for 4 h) prior to harvest. H The ubiquitination of ZEB1 by TRIM26 overexpression in SK-hep-1 cells. I ZEB1 ubiquitination by TRIM26 in vitro using purified proteins. Whole cell lysates (containing HA-Ub and Flag-ZEB1 proteins) was incubated with purified GST-TRIM26 or GST-Vector in vitro and blotted with TRIM26 or ZEB1 antibodies. Student’s t test: *P < 0.05; **P < 0.01; ***P < 0.001. All the data are representative of at least three independent experiments and presented as the means ± SD.
Fig. 7
Fig. 7. Deubiquitinase USP39 and E3 ligase TRIM26 balance the level of ZEB1 protein.
AD RT-PCR and western blotting indicated that the mRNA expression levels of USP39 and TRIM26 (A, C) and the protein level of ZEB1 (B, D) in SK-hep-1 cells co-translated with USP39 and TRIM26 expressing plasmids. (E, G) The mRNA levels of USP39 and TRIM26 were analyzed by RT-PCR in SK-hep-1 HCC cells. F, H Effect of USP39-knockdown and TRIM26 silencing on the protein level of ZEB1 in SK-hep-1 HCC cell determined by western blotting. I Effect of overexpression of USP39 and TRIM26 on the ZEB1 ubiquitination in SK-hep-1 cells. J Effect of USP39-knockdown and TRIM26 silencing on the cell proliferation of SK-hep-1 assessed by MTT assay. Student’s t test: *P < 0.05; **P < 0.01; ***P < 0.001. All the data are representative of at least three independent experiments and presented as the means ± SD.
Fig. 8
Fig. 8. USP39 and TRIM26 function in an antagonistic pattern contributing to the progression of HCC in vivo.
A The effect of USP39 and TRIM26 in HCC cell proliferation in vivo was determined by xenograft assays. USP39 and TRIM26 knockdown SK-hep-1 cells were respectively injected into flanks of BALB/c nude mice. After 30 days, tumors were isolated and photographed. B Tumor volumes were calculated. C Tumor weight. D, E Levels of USP39, TRIM26, and ZEB1 were analyzed by RT-PCR (D) and western blotting (E). F The expression levels of USP39, TRIM26, ZEB1 and Ki67 in tumors of different groups by IHC (original magnification, ×40; inlet, ×10). G, H Representative images showed the tumors metastasis of different groups by whole-body bioluminescence imaging (G) and lung metastases (H). The number of nodules in the lung was counted and statistically analyzed. Student’s t test: *P < 0.05; **P < 0.01; ***P < 0.001. All the data are representative of at least three independent experiments and presented as the means ± SD.

References

    1. Bray F, Ferlay J, Soerjomataram I, Siegel RL, Torre LA, Jemal A. Global cancer statistics 2018: GLOBOCAN estimates of incidence and mortality worldwide for 36 cancers in 185 countries. CA Cancer J Clin. 2018;68:394–424. - PubMed
    1. Villanueva A. Hepatocellular carcinoma. N Engl J Med. 2019;380:1450–62. doi: 10.1056/NEJMra1713263. - DOI - PubMed
    1. Wellner U, Schubert J, Burk UC, Schmalhofer O, Zhu F, Sonntag A, et al. The EMT-activator ZEB1 promotes tumorigenicity by repressing stemness-inhibiting microRNAs. Nat Cell Biol. 2009;11:1487–95. doi: 10.1038/ncb1998. - DOI - PubMed
    1. Dong L, Zhang X, Xiang W, Ni J, Zhou W, Li H. Post-transcription mediated Snail stabilization is involved in radiation exposure induced invasion and migration of hepatocarcinoma cells. Biomed Pharmacother. 2018;103:767–72. doi: 10.1016/j.biopha.2018.04.095. - DOI - PubMed
    1. Zhang X, Lin C, Song J, Chen H, Chen X, Ren L, et al. Parkin facilitates proteasome inhibitor-induced apoptosis via suppression of NF-kappaB activity in hepatocellular carcinoma. Cell Death Dis. 2019;10:719. doi: 10.1038/s41419-019-1881-x. - DOI - PMC - PubMed

Publication types