. 2021 Apr;27(4):632-639.
doi: 10.1038/s41591-021-01257-1. Epub 2021 Mar 1.

Autologous transplant therapy alleviates motor and depressive behaviors in parkinsonian monkeys

Affiliations

Autologous transplant therapy alleviates motor and depressive behaviors in parkinsonian monkeys

Yunlong Tao et al. Nat Med. 2021 Apr.

Abstract

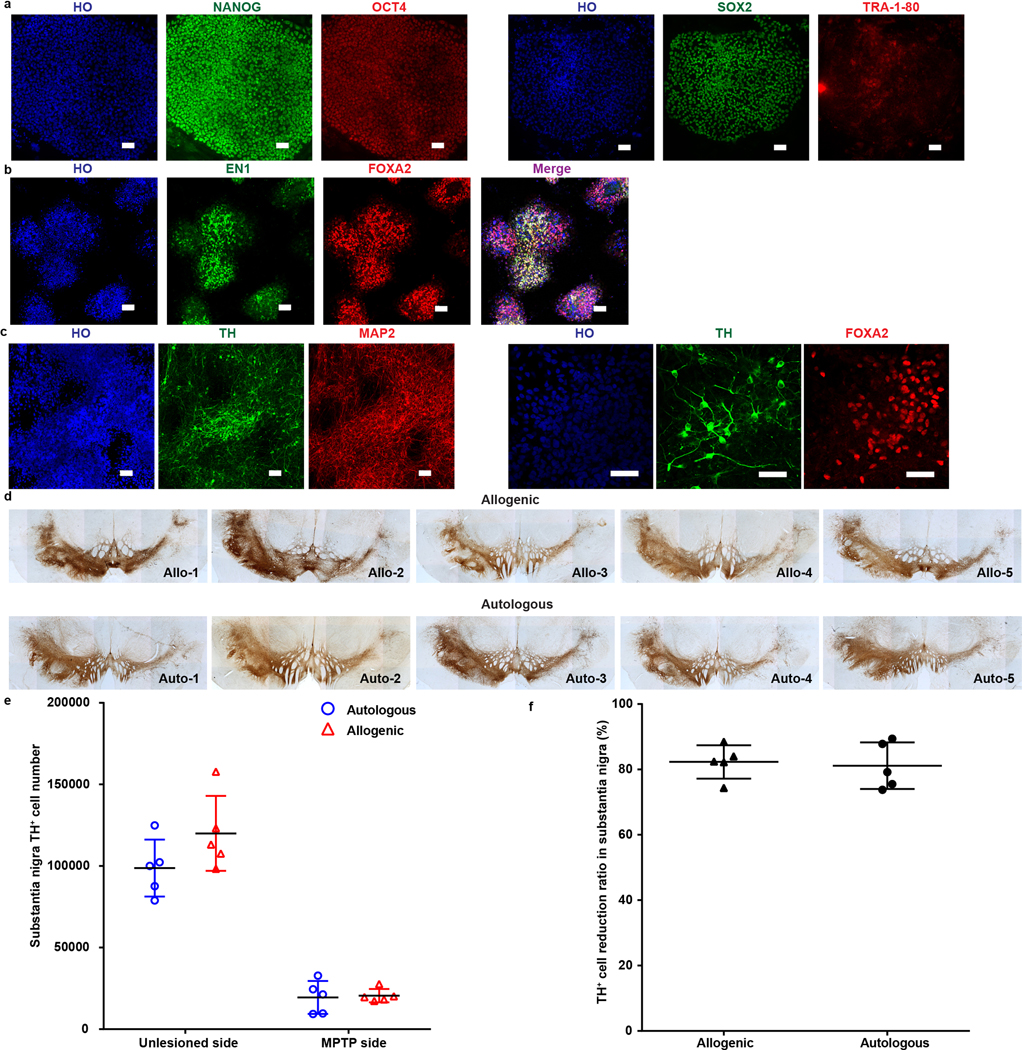
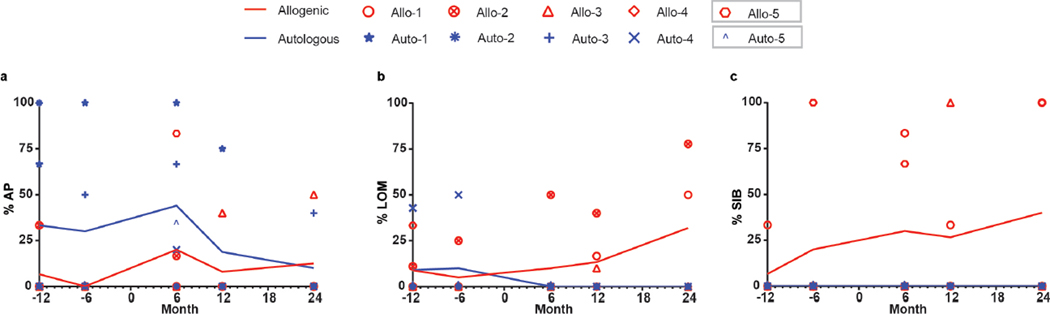
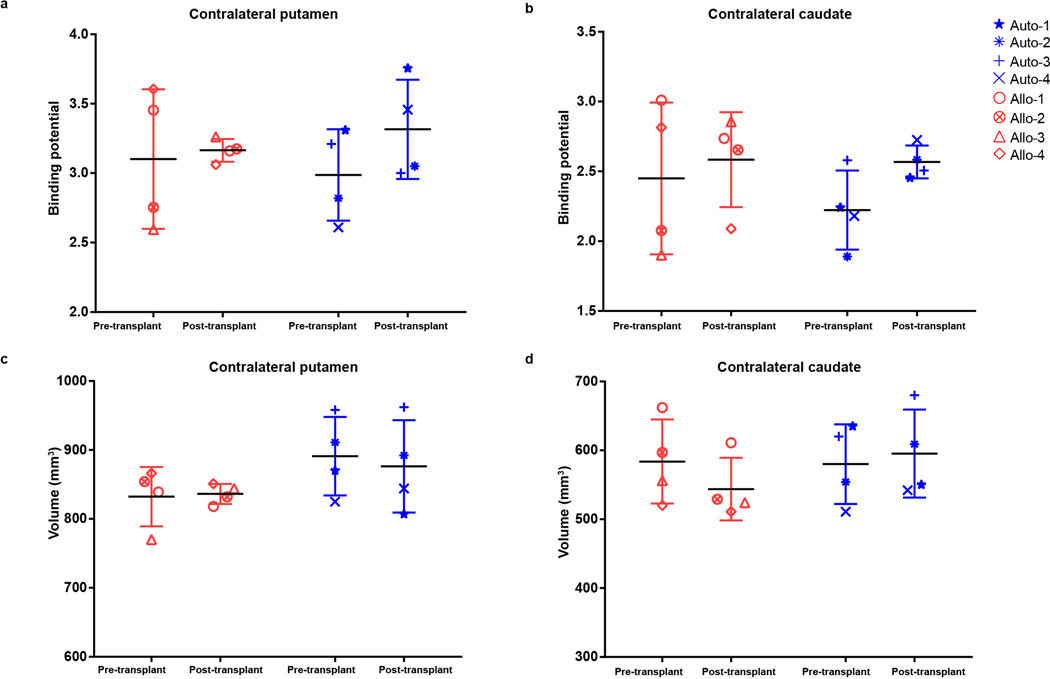
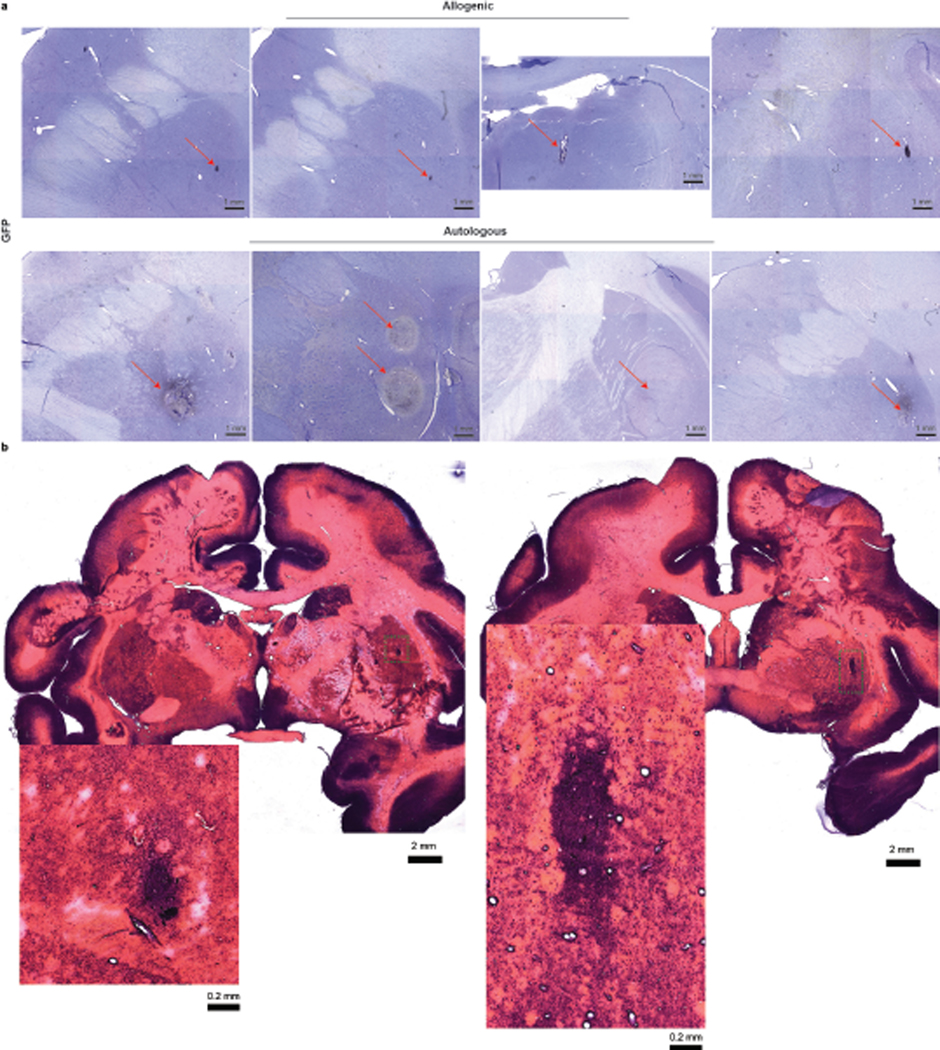
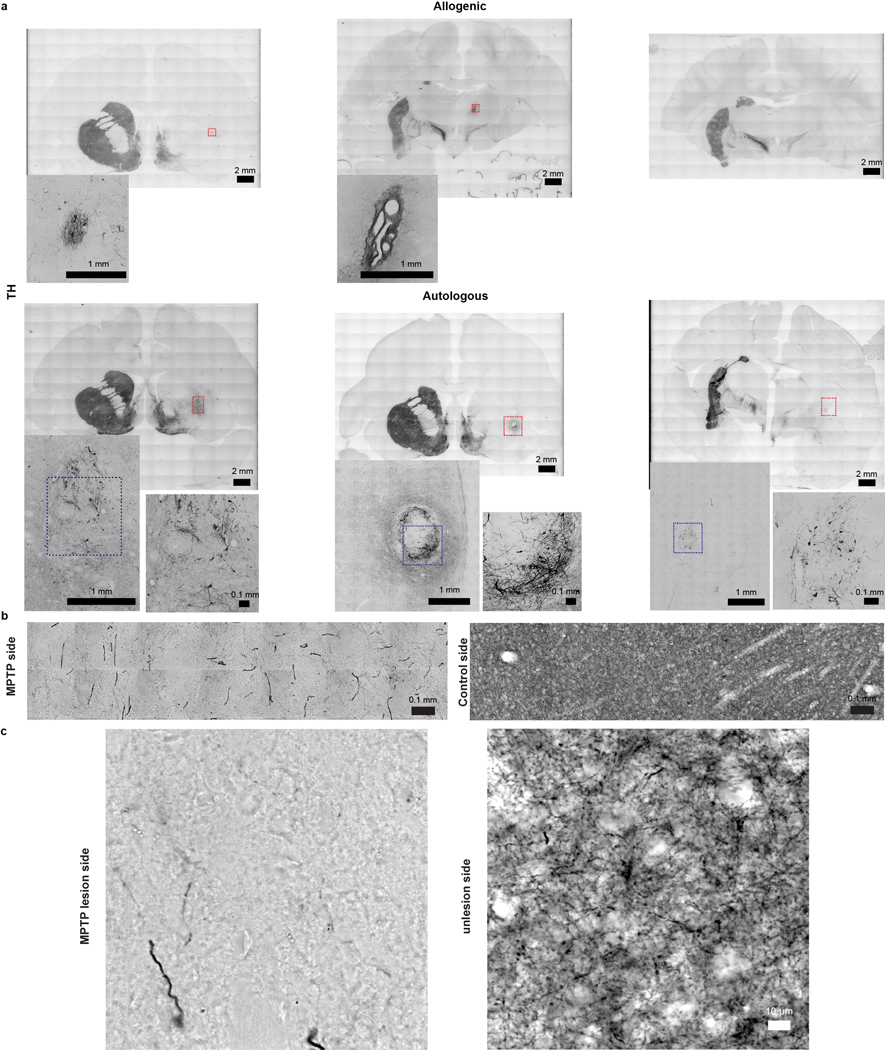
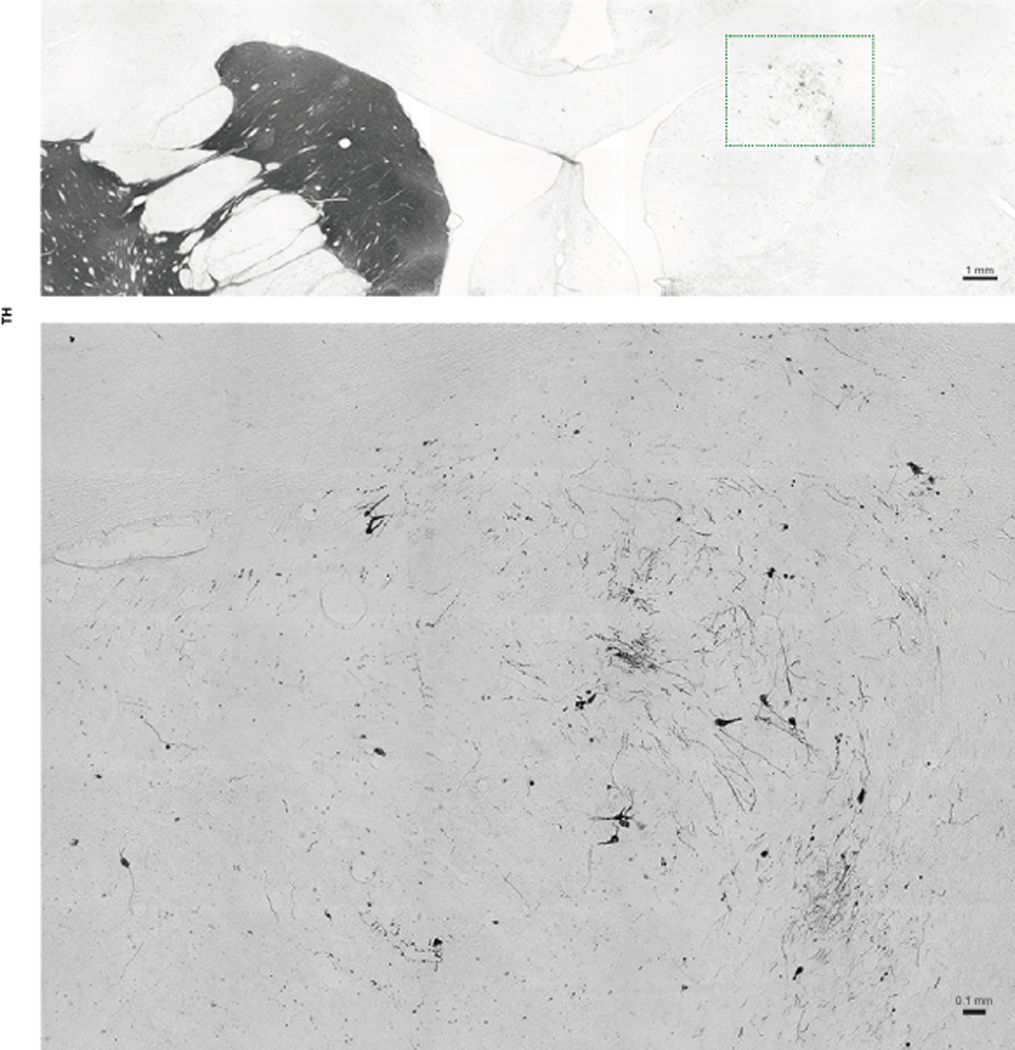
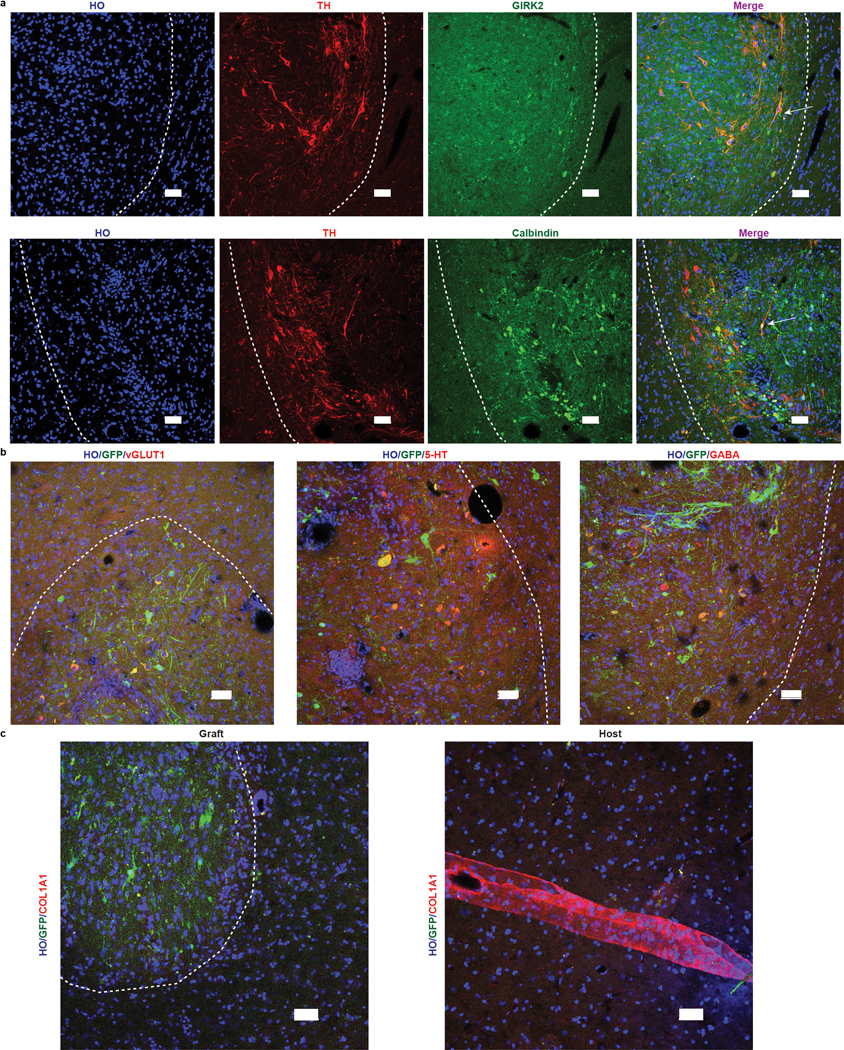
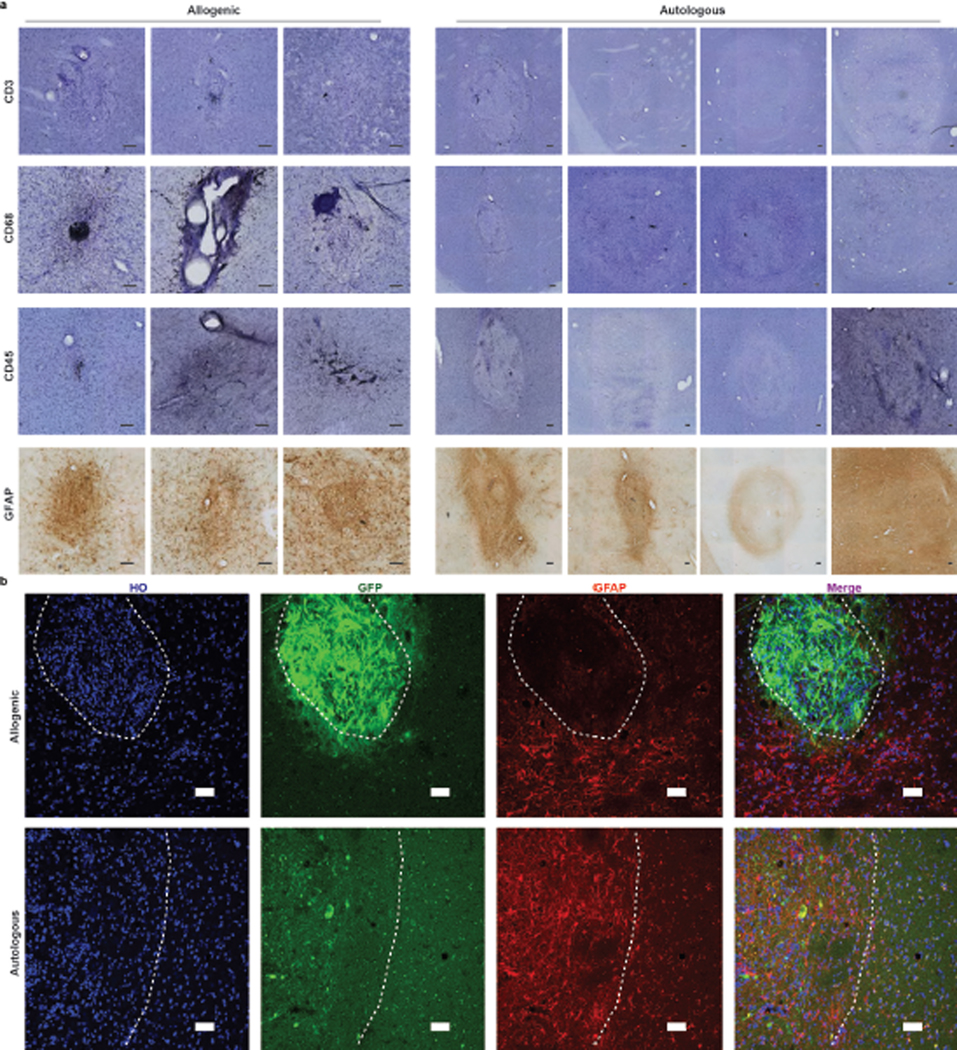
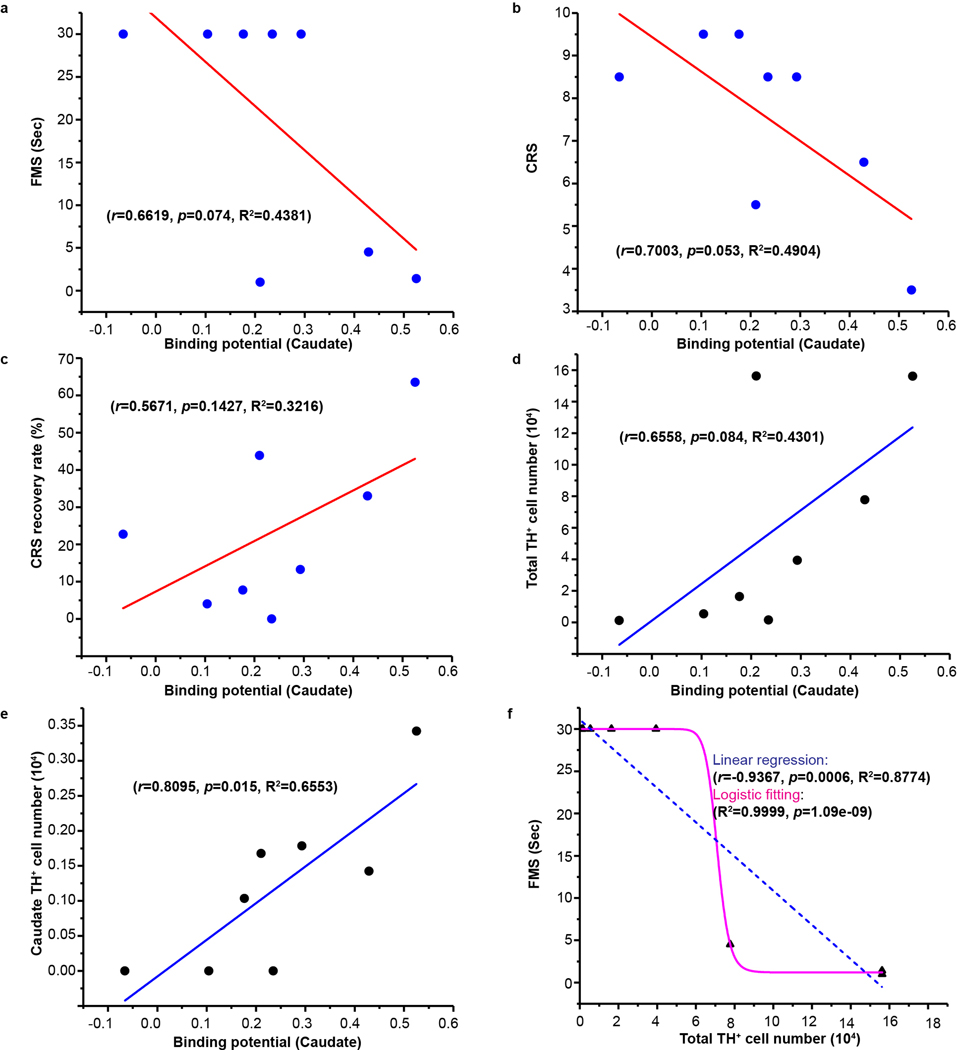
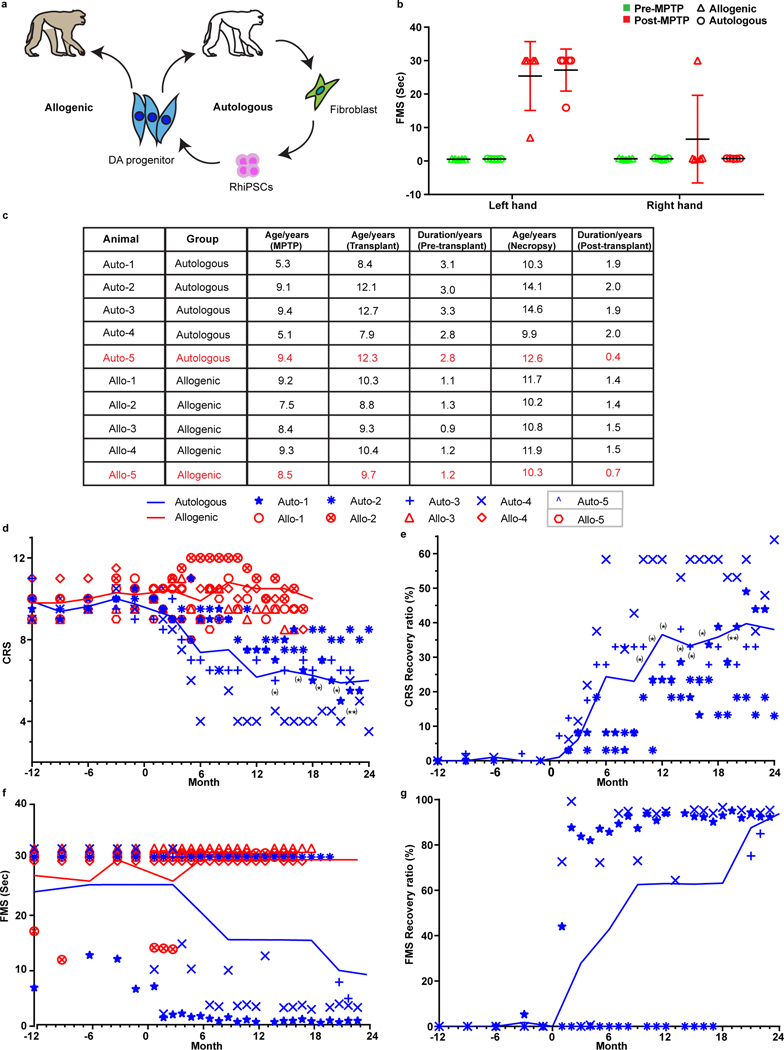
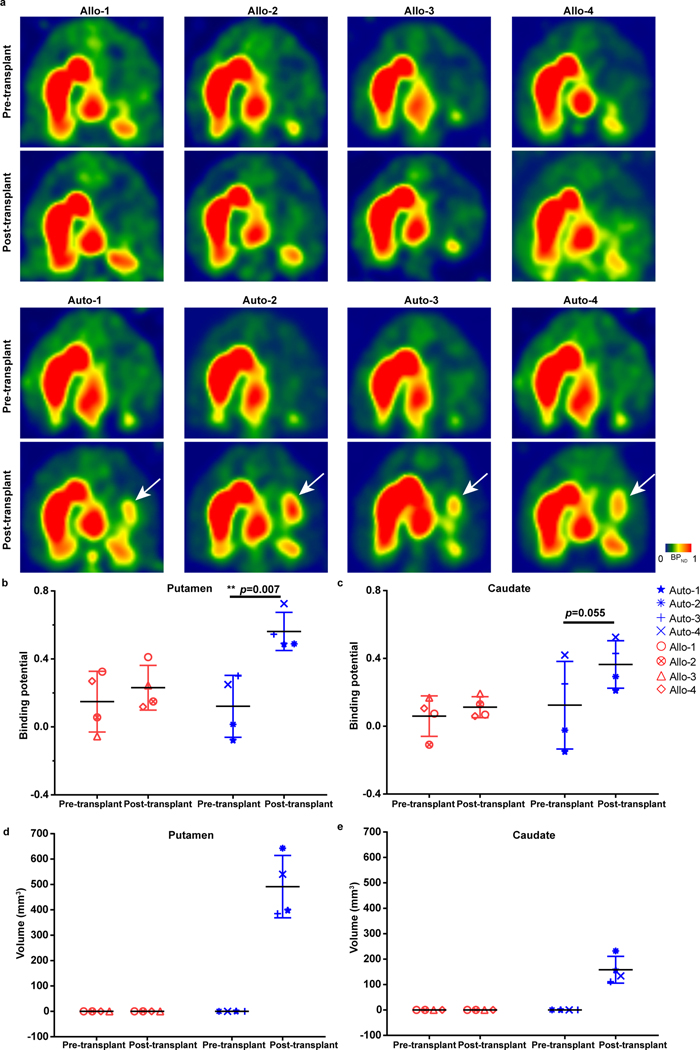
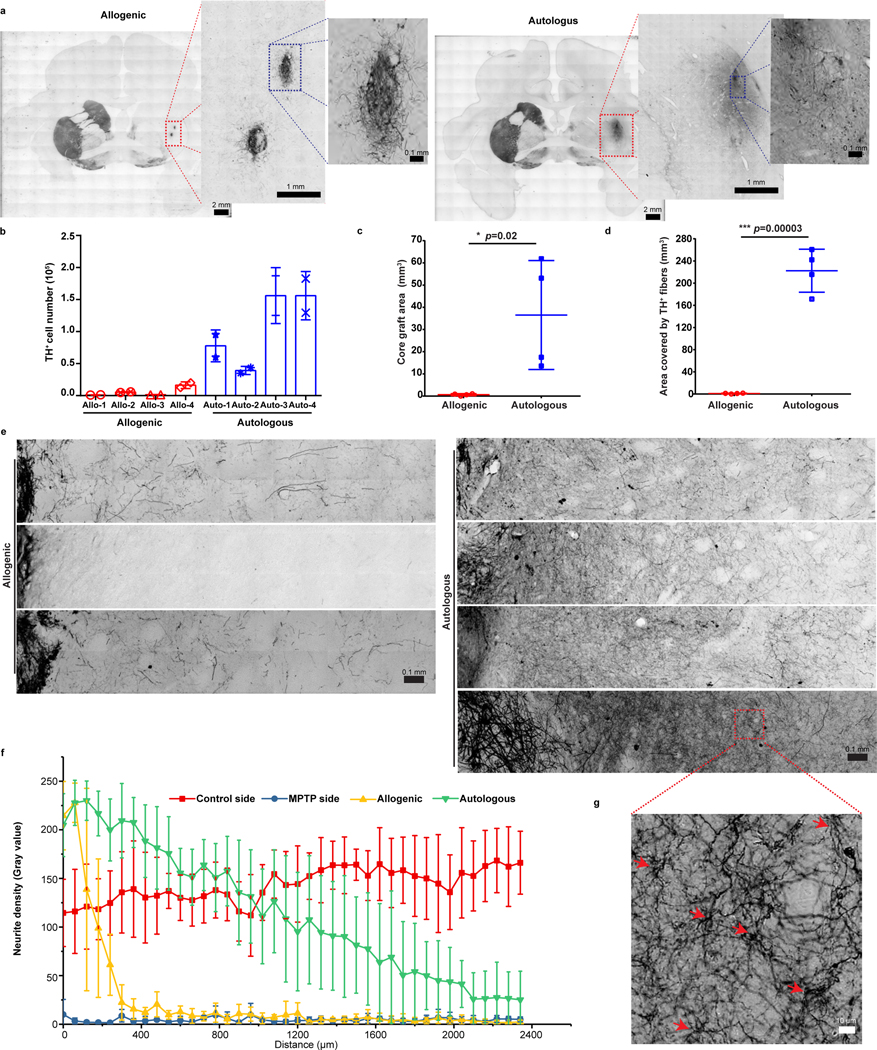
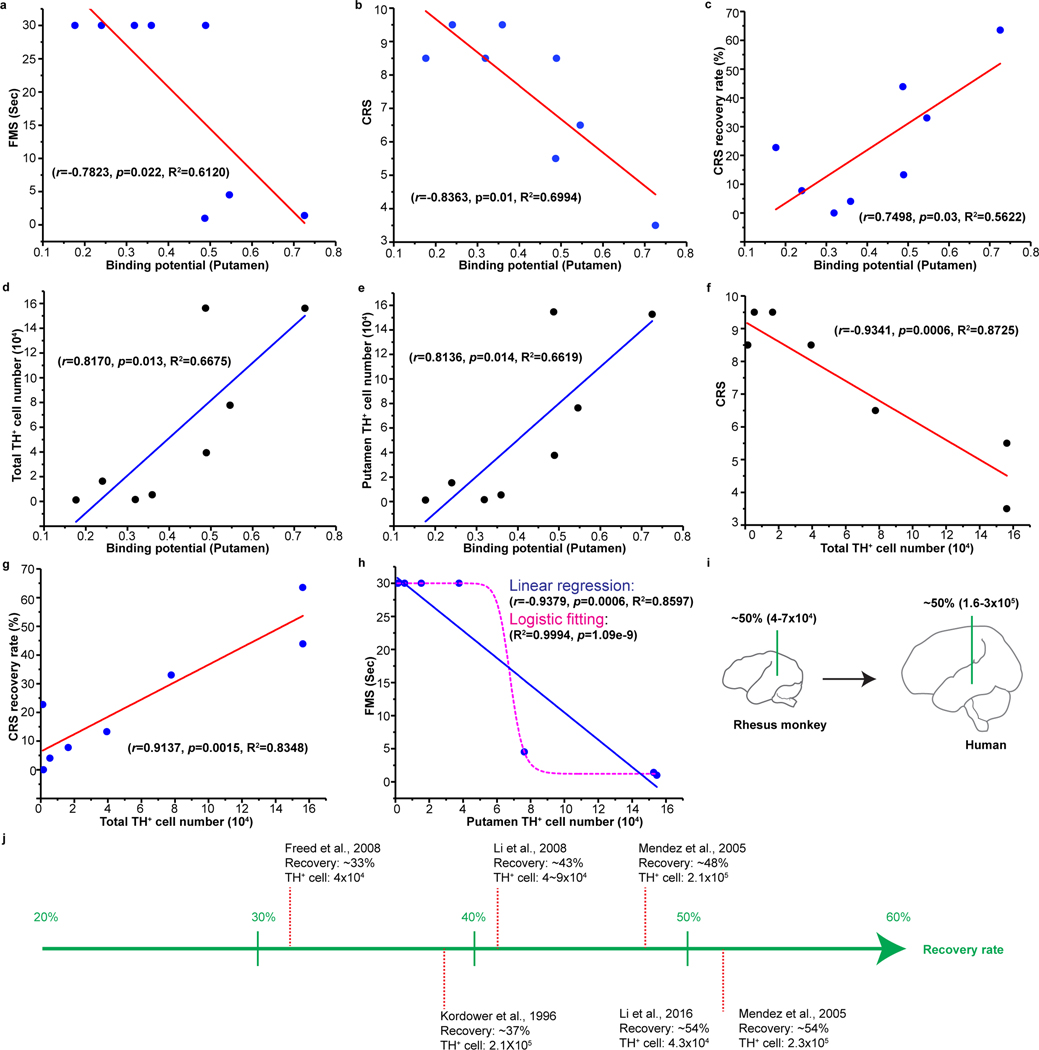
Degeneration of dopamine (DA) neurons in the midbrain underlies the pathogenesis of Parkinson's disease (PD). Supplement of DA via L-DOPA alleviates motor symptoms but does not prevent the progressive loss of DA neurons. A large body of experimental studies, including those in nonhuman primates, demonstrates that transplantation of fetal mesencephalic tissues improves motor symptoms in animals, which culminated in open-label and double-blinded clinical trials of fetal tissue transplantation for PD1. Unfortunately, the outcomes are mixed, primarily due to the undefined and unstandardized donor tissues1,2. Generation of induced pluripotent stem cells enables standardized and autologous transplantation therapy for PD. However, its efficacy, especially in primates, remains unclear. Here we show that over a 2-year period without immunosuppression, PD monkeys receiving autologous, but not allogenic, transplantation exhibited recovery from motor and depressive signs. These behavioral improvements were accompanied by robust grafts with extensive DA neuron axon growth as well as strong DA activity in positron emission tomography (PET). Mathematical modeling reveals correlations between the number of surviving DA neurons with PET signal intensity and behavior recovery regardless autologous or allogeneic transplant, suggesting a predictive power of PET and motor behaviors for surviving DA neuron number.


Figures

Extended Data Fig. 1
Extended Data Fig. 1. DA neuron generation and MPTP PD model
a, Representative images of pluripotent stem cell marker expression in iPSCs generated from rhesus macaque fibroblasts. b,c, Representative images of mDA progenitor marker (b) and DA neuron marker (c) in differentiating cells from rhesus macaque iPSCs. Scale bar: 50μm. Data are representative of at least 5 independent experiments (a-c). d, Images of TH immunostaining in the substantia nigra from allogenic and autologous rhesus monkeys. e, Stereological quantification of TH+ neurons in the substantia nigra of allogenic and autologous rhesus monkeys. f, Percentage of TH+ cell reduction in the MPTP-treated substantia nigra compared to the unlesioned side. The data are presented as mean ± SD (n = 5 biologically independent monkeys in each group) in e, f.
Extended Data Fig. 2
Extended Data Fig. 2. Mood behavior in transplanted monkeys
a, The anxious pacing (AP) behavior observed in monkeys receiving allogenic or autologous transplantation from 12 months before transplantation to 24 months after transplantation. The transplantation happened at month 0. Lines show mean values for every 6 months from the allogenic group or the autologous group. b, The lack of motivation (LOM) behavior observed in monkeys receiving allogenic or autologous transplantation from 12 months before transplantation to 24 months after transplantation. c, The self-injury behavior (SIB) observed in monkeys receiving allogenic or autologous transplantation from 12 months before transplantation to 24 months after transplantation.
Extended Data Fig. 3
Extended Data Fig. 3. Graft evaluation in vivo
a,b, Quantification of [11C]DTBZ graft binding potential in contralateral (untreated) putamen (a) and caudate (b) from allogenic and autologous monkeys before and after transplantation. The data is presented as mean ± SD (n=4 per group). c,d, Quantification of the volume of uptake in contralateral (untreated) putamen (c) and contralateral caudate (d) from allogenic and autologous monkeys before and after transplantation. The data is presented as mean ± SD (n=4 per group).
Extended Data Fig. 4
Extended Data Fig. 4. Overview of the graft
a, Representative images of GFP immunostaining and Nissl staining in brain sections of allogenic and autologous animals. The red arrows point to the grafts. b, H&E staining in brain sections of allogenic and autologous animal. Enlarged images correspond to the yellow area in the respective grafts. All grafts (if present) in monkeys from both groups were examined. Data are representative of at least 3 sections having grafts from each monkey.
Extended Data Fig. 5
Extended Data Fig. 5. Histological analysis of graft
a, Representative images of TH immunostaining in brain sections of allogenic and autologous animals. Enlarged images correspond to the grafts. b, Representative images of TH+ fiber extension area in control and MPTP brain hemisphere. c, TH immunostaining in the putamen from MPTP lesion side and unlesioned side. Scale bar: 10 μm. All grafts (if present) in monkeys from both groups were examined. Data are representative of at least 3 sections having grafts from each monkey (a-c).
Extended Data Fig. 6
Extended Data Fig. 6. Caudate graft in autologous monkeys
Representative image of TH immunostaining in autologous monkey caudate region. The inset area is enlarged below. All grafts (if present) in monkeys from both groups were examined. Data are representative of at least 3 sections having grafts from each monkey.
Extended Data Fig. 7
Extended Data Fig. 7. Cellular composition in grafts.
a, Representative images of TH and GIRK2 or Calbindin immunostaining in grafts. Scale bars: 50 μm. b, Representative images of vGLUT1, 5-HT and GABA immunostaining in grafts. Scale bars: 50 μm. c, Representative images of COL1A1 immunostaining in and outside of grafts. scale bars: 50 μm. The white dash lines mark the edge of the graft. All grafts (if present) in monkeys from both groups were examined. Data are representative of at least 3 sections having grafts from each monkey (a-c).
Extended Data Fig. 8
Extended Data Fig. 8. Immune response evaluation in grafts
a, Histological analysis of T cells (CD3 and CD45), microglia (CD68) and astrocyte (GFAP) marker in grafts from allogenic and autologous animals. Scale bar: 100 μm. b, Representative images of GFP and GFAP immunostaining in allogenic and autologous monkeys. Scale bar: 50 μm. The white dash lines mark the edge of the graft. All grafts (if present) in monkeys from both groups were examined. Data are representative of at least 3 sections having grafts from each monkey (a-b).
Extended Data Fig. 9
Extended Data Fig. 9. Regression analysis on the relation between DA neuron numbers and behavioral recovery/PET
a, Linear regression analysis between ipsilateral caudate [11C]DTBZ binding potential and FMS. b, Linear regression analysis between ipsilateral caudate [11C]DTBZ binding potential and CRS. c, Linear regression analysis between ipsilateral caudate [11C]DTBZ binding potential and CRS recovery rate. d, Linear regression analysis between ipsilateral caudate [11C]DTBZ binding potential and surviving TH+ neuron numbers. e, Linear regression analysis between ipsilateral caudate [11C]DTBZ binding potential and caudate surviving TH+ neuron numbers. f, Linear regression and logistic fitting analysis of FMS and total surviving TH+ neuron numbers in grafts. The Pearson’s r, significance (p value) and R2 (coefficient of determination) were assessed by two-tailed Pearson’s correlation analysis in a-f.
Figure 1.
Figure 1.. Behavior evaluation of transplanted monkeys
a, Experiment design of allogenic and autologous transplantation. b, Pre- and post-MPTP fine motor skill (FMS) scores in monkeys from the allogenic and autologous groups. Each symbol represents one monkey. The data is presented as mean ± SD (n = 5 biologically independent monkeys in each group). c, The age of each of the monkeys when they received MPTP, cell transplantation and necropsy. The monkeys highlighted as red died shortly post-transplantation. d,e, Monthly CRS (d) and CRS improvement (e) of the monkeys receiving allogenic or autologous transplantation from 12 months before transplantation to 24 months after transplantation. The transplantation happened at month 0. Lines show mean values for every 3 months from the allogenic group or the autologous group. Significance was assessed by Friedman test (non-parametric statistical test) (d, e); * p < 0.05, ** p < 0.01. f,g, Monthly FMS scores (f) and FMS improvement (g) in the monkeys receiving allogenic or autologous transplantation from 12 months before transplantation to 24 months after transplantation. The transplantation happened at month 0. Lines show mean values for every 3 months from the allogenic group or the autologous group.
Figure 2.
Figure 2.. Graft evaluation in vivo by PET
a, PET imaging with [11C]DTBZ from allogenic and autologous group at pre- and post-transplantation stages. The white arrows point to the grafts. b,c, Quantification of [11C]DTBZ binding potential in putamen (b) and caudate (c) from the allogenic and autologous groups at pre- and post-transplantation stages. The data is presented as mean ± SD (n=4 for each group). Significance was assessed by a two-tailed, Paired t-test. d,e, Quantification of the graft volumes in putamen (d) and caudate (e) from the allogenic and autologous groups based on [11C]DTBZ PET data threshold at pre- and post-transplantation stages. The data are presented as mean ± SD (n=4 for each group).
Figure 3.
Figure 3.. Histological analysis of grafts
a, Representative images of TH immunostaining in coronal brain sections from the allogenic and autologous groups. Enlarged images correspond to the grafts in putamen. All grafts (if present) in monkeys from both groups were examined. Data are representative of at least 3 sections having grafts from each monkey. b, Stereological quantification of TH+ cell numbers in the grafts of allogenic and autologous groups. The data are presented as mean ± SD (n = 2 sets of serial brain sections from each monkey were quantified). c,d, Quantification of graft size (c) and the area covered by TH+ fibers (d) from allogenic and autologous groups. The data are presented as mean ± SD (n = 4 biologically independent monkeys in each group). Significance was assessed by a two-tailed t-test. e, Representative images of TH immunostaining of the grafts and the fiber extension area in the putamen from allogenic and autologous groups. All grafts (if present) in monkeys from both groups were examined. Data are representative of at least 3 sections having grafts from each monkey. f, Quantification of neurite density from grafts of allogenic and autologous grafts, the control side and MPTP side without grafts. The data are presented as mean ± SD (n=4 for each group). g, High magnification of fibers present in panel e (red square area). The red arrows indicate the branches of fibers. The histology was examined in all autologous monkeys. Data are representative of at least 3 sections having grafts in all autologous monkeys.
Figure 4.
Figure 4.. Correlation analysis between behavior recovery, PET and DA neurons in grafts
a,b,c, Linear regression analysis between FMS (a) or CRS (b) or CRS recovery rate (c) and putamen [11C]DTBZ binding potential. d, Linear regression analysis between putamen [11C]DTBZ binding potential and total surviving TH+ neuron numbers. e, Linear regression analysis between putamen [11C]DTBZ binding potential and putamen surviving TH+ neuron numbers. f,g, Linear regression analysis between CRS (f) or CRS recovery rate (g) and total surviving TH+ neuron numbers. h, Linear regression and logistic fitting analysis of FMS and putamen surviving TH+ neuron numbers in grafts. The Pearson’s r, significance (p value) and R (coefficient of determination) were assessed by two-tailed Pearson’s correlation analysis in a-h. i, Predicted number of surviving TH+ neurons required for up to 50% motor recovery in PD humans based on the data from linear regression in panel (g) using rhesus monkey models. j, The surviving TH+ neurons in grafts and recovery rate reported in studies using human fetal tissue transplantation.

Comment in

References

    1. Bjorklund A & Lindvall O. Replacing Dopamine Neurons in Parkinson’s Disease: How did it happen? J Parkinsons Dis 7, S21–S31, doi:10.3233/JPD-179002 (2017). - DOI - PMC - PubMed
    1. Barker RA, Barrett J, Mason SL & Bjorklund A. Fetal dopaminergic transplantation trials and the future of neural grafting in Parkinson’s disease. Lancet Neurol 12, 84–91, doi:10.1016/S1474-4422(12)70295-8 (2013). - DOI - PubMed
    1. Kriks S et al. Dopamine neurons derived from human ES cells efficiently engraft in animal models of Parkinson’s disease. Nature 480, 547–551, doi:10.1038/nature10648 (2011). - DOI - PMC - PubMed
    1. Kikuchi T et al. Human iPS cell-derived dopaminergic neurons function in a primate Parkinson’s disease model. Nature 548, 592–596, doi:10.1038/nature23664 (2017). - DOI - PubMed
    1. Barker RA, Parmar M, Studer L & Takahashi J. Human Trials of Stem Cell-Derived Dopamine Neurons for Parkinson’s Disease: Dawn of a New Era. Cell Stem Cell 21, 569–573, doi:10.1016/j.stem.2017.09.014 (2017). - DOI - PubMed

Publication types

MeSH terms