. 2021 Mar 1;4(1):263.
doi: 10.1038/s42003-021-01748-4.

PKA-RIIβ autophosphorylation modulates PKA activity and seizure phenotypes in mice

Affiliations

PKA-RIIβ autophosphorylation modulates PKA activity and seizure phenotypes in mice

Jingliang Zhang et al. Commun Biol. .

Abstract

Temporal lobe epilepsy (TLE) is one of the most common and intractable neurological disorders in adults. Dysfunctional PKA signaling is causally linked to the TLE. However, the mechanism underlying PKA involves in epileptogenesis is still poorly understood. In the present study, we found the autophosphorylation level at serine 114 site (serine 112 site in mice) of PKA-RIIβ subunit was robustly decreased in the epileptic foci obtained from both surgical specimens of TLE patients and seizure model mice. The p-RIIβ level was negatively correlated with the activities of PKA. Notably, by using a P-site mutant that cannot be autophosphorylated and thus results in the released catalytic subunit to exert persistent phosphorylation, an increase in PKA activities through transduction with AAV-RIIβ-S112A in hippocampal DG granule cells decreased mIPSC frequency but not mEPSC, enhanced neuronal intrinsic excitability and seizure susceptibility. In contrast, a reduction of PKA activities by RIIβ knockout led to an increased mIPSC frequency, a reduction in neuronal excitability, and mice less prone to experimental seizure onset. Collectively, our data demonstrated that the autophosphorylation of RIIβ subunit plays a critical role in controlling neuronal and network excitabilities by regulating the activities of PKA, providing a potential therapeutic target for TLE.


Conflict of interest statement

The authors declare no competing interests.

Figures

Fig. 1
Fig. 1. Decreased autophosphorylation of the RIIβ subunit of PKA and increased phosphorylation of CREB and PKA substrates in epileptic foci of TLE patients and experimental seizure model mice.
a Western blot analysis of p-PKA substrates. NC normal control using adjacent normal tissues from a designated epilepsy patient, EP epileptic focus from a designated epilepsy patient. If the EP was the hippocampus, then the NC was the entorhinal cortex embedded in the anterior temporal lobe; if the EP was the entorhinal cortex in the anterior temporal lobe, then the NC was the hippocampus. b Quantification of the Western blot results in a and Supplementary Fig. 1a, n = 14 patients, ***P < 0.001, paired two-tailed Student’s t-test. c Western blot analysis of p-RIIβ, total RIIβ, p-CREB, and total CREB in the epileptic foci and adjacent normal tissues obtained from the surgically removed human anterior temporal lobe and hippocampus. dg Quantification of the Western blot results in c and Supplementary Fig. 1, n = 14 patients, ns no significance, P > 0.05; ***P < 0.001, paired two-tailed Student’s t test. h Western blot analysis of p-RIIβ, total RIIβ, p-CREB, and total CREB in the DG, CA1, CA3 area, and entorhinal cortex from mice in control (Ctr) or experimental seizure model (Epi) group. il Quantification of the Western blot results in H (n = 5 mice for each group). ns no significance, P > 0.05; ***P < 0.001, unpaired two-tailed Student’s t test. m Western blot analysis of p-PKA substrates in the DG, CA1, CA3 area, and entorhinal cortex from mice in control or experimental seizure model group. n Quantification of the Western blot results in m (n = 5 mice for each group). ***P < 0.001, unpaired two-tailed Student’s t test. Data were represented as mean ± SEM.
Fig. 2
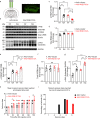
Fig. 2. Downregulation of RIIβ autophosphorylation in vivo led to increased phosphorylation of CREB and PKA substrates, as well as increased seizure susceptibility in mice.
a Schematic diagram of injection and expression of adenosine associated virus in the hippocampal DG area. scale bar, 1 mm. b The Western blot analysis showed p-RIIβ, total RIIβ, p-CREB, total CREB, and p-PKA substrates protein levels in the hippocampal DG area from mice in AAV-Vector or AAV-RIIβ-S112A group. Ctr control, Epi experimental seizure model. cg Quantification of the Western blot results in b. n = 6 mice for each group of Ctr and n = 9 mice for each group of Epi, ns no significance, P > 0.05; ***P < 0.001, one-way ANOVA with Bonferroni’s multiple-comparison test. h Graph depicting limbic seizure progression, illustrated as mean maximum seizure class reached by 15, 30, 60, 90, 120, or 150 min after kainic acid administration (30 mg/kg, i.p.) in AAV-Vector transfected (n = 13) and AAV-RIIβ-S112A transfected (n = 12) mice. P = 0.0379 at 30 min, P = 0.074 at 120 min, P = 0.0025 at 150 min, P < 0.05; **P < 0.01, for each time bin, data were analyzed by unpaired two-tailed non-parametric Mann–Whitney U-test. i Incidence of maximum seizure class reached during the course of the experiment. Data were represented as mean ± SEM.
Fig. 3
Fig. 3. Decreased phosphorylation of CREB and PKA substrates in RIIβ-/- mice, and RIIβ null exhibited anticonvulsant activity in KA-induced mouse experimental seizure model.
a Western blot analysis showed p-CREB, total CREB, and p-PKA substrates protein levels in the DG, CA1, CA3 area, and entorhinal cortex (EC) from WT and RIIβ−/− mice. bd Quantification of the Western blot results in a n = 5 mice for each group, *P < 0.05; **P < 0.01; ***P < 0.001, unpaired two-tailed Student’s t test. e Graph depicting limbic seizure progression, illustrated as mean maximum seizure class reached by 15, 30, 45, 60, or 90 min after kainic acid administration (30 mg/kg, i.p.) in WT (n = 8) and RIIβ−/− (n = 7) mice. P = 0.0014 at 15 min, P = 0.1636 at 30 min, P = 0.0107 at 45 min, P = 0.0145 at 60 min, P = 0.0145 at 90 min, ns no significance, P > 0.05; *P < 0.05; **P < 0.01 for each time bin, data were analyzed by unpaired two-tailed non-parametric Mann–Whitney U-test. f Incidence of maximum seizure Class reached during the course of the experiment. Data were represented as mean ± SEM.
Fig. 4
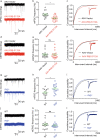
Fig. 4. Downregulation of autophosphorylation of RIIβ decreased inhibitory afferent, and RIIβ null increased inhibitory afferent of DG granule cells without changing excitatory afferent in mice.
a Representative raw recording of miniature inhibitory postsynaptic currents (mIPSCs) in DG neurons transfected with AAV-Vector (upper trace, black) and AAV-RIIβ-S112A (lower trace, red). b Comparison of the average values ± SEM of mIPSC frequency. n = 17 neurons for AAV-Vector group and n = 18 neurons for AAV-RIIβ-S112A group, *P < 0.05, unpaired two-tailed Student’s t-test. c Cumulative probability plots of inter-event interval distributions. Insets: comparison of the representative of an averaged mIPSC. d Representative raw recording of miniature excitatory postsynaptic currents (mEPSCs) in DG neurons transfected with AAV-Vector (upper trace, black) and AAV-RIIβ-S112A (lower trace, red). e Comparison of the average values ± SEM of mEPSC frequency. n = 18 neurons for each group, ns no significance, P > 0.05, unpaired two-tailed Student’s t test. f Cumulative probability plots of inter-event interval distributions. Insets: comparison of the representative of an averaged mEPSC. g Representative raw recording of miniature inhibitory postsynaptic currents (mIPSCs) in WT (upper trace, black) and RIIβ−/− (lower trace, blue) DG neurons. h Comparison of the average values ± SEM of mIPSC frequency. n = 15 neurons for WT group and n = 16 neurons for RIIβ−/− group, *P < 0.05, unpaired two-tailed Student’s t test. i Cumulative probability plots of inter-event interval distributions. Insets: comparison of the representative of an averaged mIPSC. j Representative raw recording of miniature excitatory postsynaptic currents (mEPSCs) in DG neurons transfected with AAV-Vector (upper trace, black) and AAV-RIIβ-S112A (lower trace, red). k Comparison of the average values ± SEM of mEPSC frequency. n = 16 neurons for each group, ns no significance, P > 0.05, unpaired two-tailed Student’s t test. l Cumulative probability plots of inter-event interval distributions. Insets: comparison of the representative of an averaged mEPSC. Data were represented as mean ± SEM.
Fig. 5
Fig. 5. Downregulation of autophosphorylation of RIIβ in vivo increased neuronal intrinsic excitabilities of DG granule cells in mice.
a Representative current-clamp recordings of DG neurons held at the normal RMP from AAV-Vector transfected (black) and AAV-RIIβ-S112A transfected (red) mice. A series of 400-ms hyperpolarizing and depolarizing steps in 50-pA increments were applied to produce the traces. Inset: representative trace in response to 150 pA positive current injection. b Mean number of action potentials (APs) generated in the response of depolarizing current pulses at RMP. n = 13 neurons for AAV-Vector group and n = 12 neurons for AAV-RIIβ-S112A group, **P < 0.01, unpaired two-tailed non-parametric Mann–Whitney U-test for each current pulse. c Representative current-clamp recordings of DG neurons held at a fixed potential of −80 mV from AAV-Vector transfected (black) and AAV-RIIβ-S112A transfected (red) mice. A series of 400-ms hyperpolarizing and depolarizing steps in 50-pA increments were applied to produce the traces. Inset: representative trace in response to 150 pA positive current injection. d Mean number of APs generated in the response of depolarizing current pulses at −80 mV. n = 13 neurons for AAV-Vector group and n = 12 neurons for AAV-RIIβ-S112A group, ns no significance, P > 0.05, unpaired two-tailed non-parametric Mann–Whitney U-test for each current pulse. e Individuals and mean spike RMP values. ***P < 0.001, unpaired two-tailed Student’s t test. f Individuals and mean input resistance values at RMP. *P < 0.05, unpaired two-tailed Student’s t test. g Individuals and mean input resistance values at −80 mV. ns no significance, P > 0.05, unpaired two-tailed Student’s t test. h Plot of a typical action potential showed its various phases as the action potential passes a point on a cell membrane. i Typical spikes of DG neurons from AAV-Vector transfected (black) and AAV-RIIβ-S112A transfected (red) mice at the normal RMP. j Associated phase plane plots. km Individuals and mean spike threshold, amplitude, and fAHP values. ns no significance, P > 0.05; **P < 0.01, unpaired two-tailed Student’s t test. Data were represented as mean ± SEM.
Fig. 6
Fig. 6. Decreased neuronal intrinsic excitabilities of DG granule cells at normal RMP in RIIβ−/− mice.
a Representative current-clamp recordings of DG neurons held at the normal RMP from WT (black) and RIIβ−/− (blue) mice. A series of 400-ms hyperpolarizing and depolarizing steps in 50-pA increments were applied to produce the traces. Inset: representative trace in response to 150 pA positive current injection. b Mean number of action potentials (APs) generated in the response of depolarizing current pulses at RMP. n = 17 neurons for WT group and n = 13 neurons for RIIβ−/− group, **P < 0.01; ***P < 0.001, unpaired two-tailed non-parametric Mann–Whitney U-test for each current pulse. c Representative current-clamp recordings of DG neurons held at a fixed potential of −80 mV from WT (black) and RIIβ−/− (blue) mice. A series of 400-ms hyperpolarizing and depolarizing steps in 50-pA increments were applied to produce the traces. Inset: representative trace in response to 150 pA positive current injection. d Mean number of APs generated in the response of depolarizing current pulses at −80 mV. n = 18 neurons for WT group and n = 16 neurons for RIIβ−/− group, **P < 0.01, unpaired two-tailed non-parametric Mann–Whitney U-test for each current pulse. e Individuals and mean spike RMP values. **P < 0.01, unpaired two-tailed Student’s t-test. f Individuals and mean input resistance values at RMP. **P < 0.01, unpaired two-tailed Student’s t-test. g Individuals and mean input resistance values at −80 mV. *P < 0.05, unpaired two-tailed Student’s t-test. h Plot of a typical action potential showed its various phases as the action potential passes a point on a cell membrane. i Typical spikes of DG neurons from WT (black) and RIIβ−/− (blue) mice at the normal RMP. j Associated phase plane plots. km Individuals and mean spike threshold, amplitude, and fAHP values. ns no significance, P > 0.05; *P < 0.05, unpaired two-tailed Student’s t test. Data were represented as mean ± SEM.
Fig. 7
Fig. 7. The proposed mechanism underlying the increased PKA activities in TLE patients and KA-induced experimental seizure model mice.
In physiological conditions, the PKA-C subunits can autophosphorylate RIIβ subunits using MgATP, and the phosphorylated RIIβ can turn back into unphosphorylated RIIβ using protein phosphatases (PPs). The PKA holoenzyme exists in a phosphorylated state due to the rapid autophosphorylation. When intracellular levels of cAMP rise, the phosphorylated and de-phosphorylated RIIβ homodimer start to associate with cAMP and thus releases the active C subunits and increase the PKA activity. Conversely, when cAMP levels fall, the phosphorylated and de-phosphorylated RIIβ can reassociate with C to reconstitute into an inactive tetrameric holoenzyme,,,. It was reported that dephosphorylated RIIβ can associate with the C subunit at least 5 times more rapidly compared with the association rate of phosphorylated RIIβ with C subunit. This means the dephosphorylated RIIβ subunits can associate with the C subunit more efficiently when compared with phosphorylated RIIβ. Alternatively, the dephosphorylated RIIβ can also be rapidly dephosphorylated by PPs, thus, greatly facilitating its capacity to reassociate with C and generate the inactive holoenzyme. Therefore, the two detectable forms by Western blot analysis are composed of p-RIIβ mainly derived from phospho-holoenzyme, and the disassociated RIIβ (subtracted by p-RIIβ from total RIIβ), which in theory approximately equals to the amount of the disassociated C subunits, in positive proportion to the PKA activity. However, under TLE condition, the abnormal neuronal activities might increase cAMP levels, reduce the RIIβ subunit’s autophosphorylation or increase the PPs activity, and hence decrease the proportion of phospho-holoenzyme (detected as p-RIIβ in Western blot analysis), thus to destabilize the holoenzyme, resulting in more liberated C subunits, which is reflected by the disassociated RIIβ subunits. These results suggest that a higher proportion of RIIβ subunits staying in the dephosphorylated states correspond to a higher PKA activity state.

Similar articles

Cited by

References

    1. Spencer DD, Spencer SS. Hippocampal resections and the use of human tissue in defining temporal lobe epilepsy syndromes. Hippocampus. 1994;4:243–249. doi: 10.1002/hipo.450040303. - DOI - PubMed
    1. Spencer SS, Spencer DD. Entorhinal-hippocampal interactions in medial temporal lobe epilepsy. Epilepsia. 1994;35:721–727. doi: 10.1111/j.1528-1157.1994.tb02502.x. - DOI - PubMed
    1. Cadd G, McKnight GS. Distinct patterns of cAMP-dependent protein kinase gene expression in mouse brain. Neuron. 1989;3:71–79. doi: 10.1016/0896-6273(89)90116-5. - DOI - PubMed
    1. Yasuda H, Barth AL, Stellwagen D, Malenka RC. A developmental switch in the signaling cascades for LTP induction. Nat. Neurosci. 2002;6:15. doi: 10.1038/nn985. - DOI - PubMed
    1. Ohtake N, Saito M, Eto M, Seki K. Exendin-4 promotes the membrane trafficking of the AMPA receptor GluR1 subunit and ADAM10 in the mouse neocortex. Regulatory Pept. 2014;190-191:1–11. doi: 10.1016/j.regpep.2014.04.003. - DOI - PubMed

Publication types

MeSH terms

Substances