. 2021 Aug;15(8):2322-2335.
doi: 10.1038/s41396-021-00926-w. Epub 2021 Mar 1.

Genomic network analysis of environmental and livestock F-type plasmid populations

Collaborators, Affiliations

Genomic network analysis of environmental and livestock F-type plasmid populations

William Matlock et al. ISME J. 2021 Aug.

Abstract

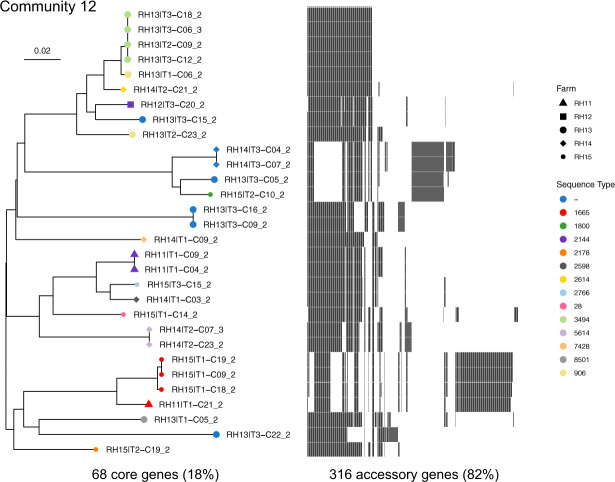
F-type plasmids are diverse and of great clinical significance, often carrying genes conferring antimicrobial resistance (AMR) such as extended-spectrum β-lactamases, particularly in Enterobacterales. Organising this plasmid diversity is challenging, and current knowledge is largely based on plasmids from clinical settings. Here, we present a network community analysis of a large survey of F-type plasmids from environmental (influent, effluent and upstream/downstream waterways surrounding wastewater treatment works) and livestock settings. We use a tractable and scalable methodology to examine the relationship between plasmid metadata and network communities. This reveals how niche (sampling compartment and host genera) partition and shape plasmid diversity. We also perform pangenome-style analyses on network communities. We show that such communities define unique combinations of core genes, with limited overlap. Building plasmid phylogenies based on alignments of these core genes, we demonstrate that plasmid accessory function is closely linked to core gene content. Taken together, our results suggest that stable F-type plasmid backbone structures can persist in environmental settings while allowing dramatic variation in accessory gene content that may be linked to niche adaptation. The association of F-type plasmids with AMR may reflect their suitability for rapid niche adaptation.


Conflict of interest statement

The authors declare that they have no conflict of interest.

Figures

Fig. 1
Fig. 1. Overview of plasmid population.
a Plasmid host genera distribution by compartment. b Distribution of plasmid sequence lengths with predicted mobilities. c Graph representing the association between replicon alleles. F-type nodes are coloured pink. Line weight is proportional to frequency of association in the sample. d Plasmid GC-content subtracted from host chromosome GC-content. A value greater than zero indicates the plasmid is AT-richer than the host. Only plasmids with circularised host chromosomes were used (565/726).
Fig. 2
Fig. 2. Thresholding the plasmid network.
a Number of communities (at least 10 nodes) detected over a varying Mash similarity threshold. Median and IQR bar shown. b Cumulative proportion of nodes recruited in a detected community of at least ten nodes over a varying Mash similarity threshold. Median and IQR bars shown. c Gaussian kernel density estimates of Mash similarities stratified by compartment. Bandwidth = 0.00864 calculated by Silverman’s ‘rule of thumb’. Density medians are indicated with vertical lines. d Evolution of the largest connected component and number of components over a varying Mash similarity threshold.
Fig. 3
Fig. 3. Plasmid network communities.
The plasmid network at threshold = 0.95. Each community with at least ten members has a unique colour. Communities are labelled from 1 to 13, which correspond to Figs. 5, S3–4 and S5–15. Unassigned plasmids and those in smaller communities are left white.
Fig. 4
Fig. 4. Plasmid network coloured by metadata.
All nodes are coloured, not just those in our detected 13 communities of at least 10 members. a Partition by livestock or WwTW sampling compartment. b Partition by plasmid host genera.
Fig. 5
Fig. 5. Community core gene phylogeny.
A neighbour-joining tree based on alignments of the 68 core genes. A heatmap of the 316 accessory genes is also shown. Node colour represents a host sequence type and node shape represents the farm. Unknown STs are labelled by ‘-’. Branch lengths have been corrected for homologous recombination.

References

    1. Thanner S, Drissner D, Walsh F. Antimicrobial resistance in agriculture. MBio. 2016;7(2):e02227–15. doi: 10.1128/mBio.02227-15. - DOI - PMC - PubMed
    1. Wyres KL, Holt KE. Klebsiella pneumoniae as a key trafficker of drug resistance genes from environmental to clinically important bacteria. Curr Opin Microbiol. 2018;45:131–9. doi: 10.1016/j.mib.2018.04.004. - DOI - PubMed
    1. Collis RM, Burgess SA, Biggs PJ, Midwinter AC, French NP, Toombs-Ruane L, et al. Extended-spectrum beta-lactamase-producing Enterobacteriaceae in dairy farm environments: a New Zealand perspective. Foodborne Pathog Dis. 2019;16(1):5–22. doi: 10.1089/fpd.2018.2524. - DOI - PubMed
    1. Velasova M, Smith RP, Lemma F, Horton RA, Duggett NA, Evans J, et al. Detection of extended‐spectrum β‐lactam, AmpC and carbapenem resistance in Enterobacteriaceae in beef cattle in Great Britain in 2015. J Appl Microbiol. 2019;126(4):1081–95. doi: 10.1111/jam.14211. - DOI - PubMed
    1. AbuOun M, O’Connor HM, Stubberfield EJ, Nunez-Garcia J, Sayers E, Crook DW, et al. Characterizing antimicrobial resistant Escherichia coli and associated risk factors in a cross-sectional study of pig farms in Great Britain. Front Microbiol. 2020;11:861. doi: 10.3389/fmicb.2020.00861. - DOI - PMC - PubMed

Publication types