. 2021 Jun;5(6):555-570.
doi: 10.1038/s41551-020-00682-w. Epub 2021 Mar 1.

Data-efficient and weakly supervised computational pathology on whole-slide images

Affiliations

Data-efficient and weakly supervised computational pathology on whole-slide images

Ming Y Lu et al. Nat Biomed Eng. 2021 Jun.

Abstract

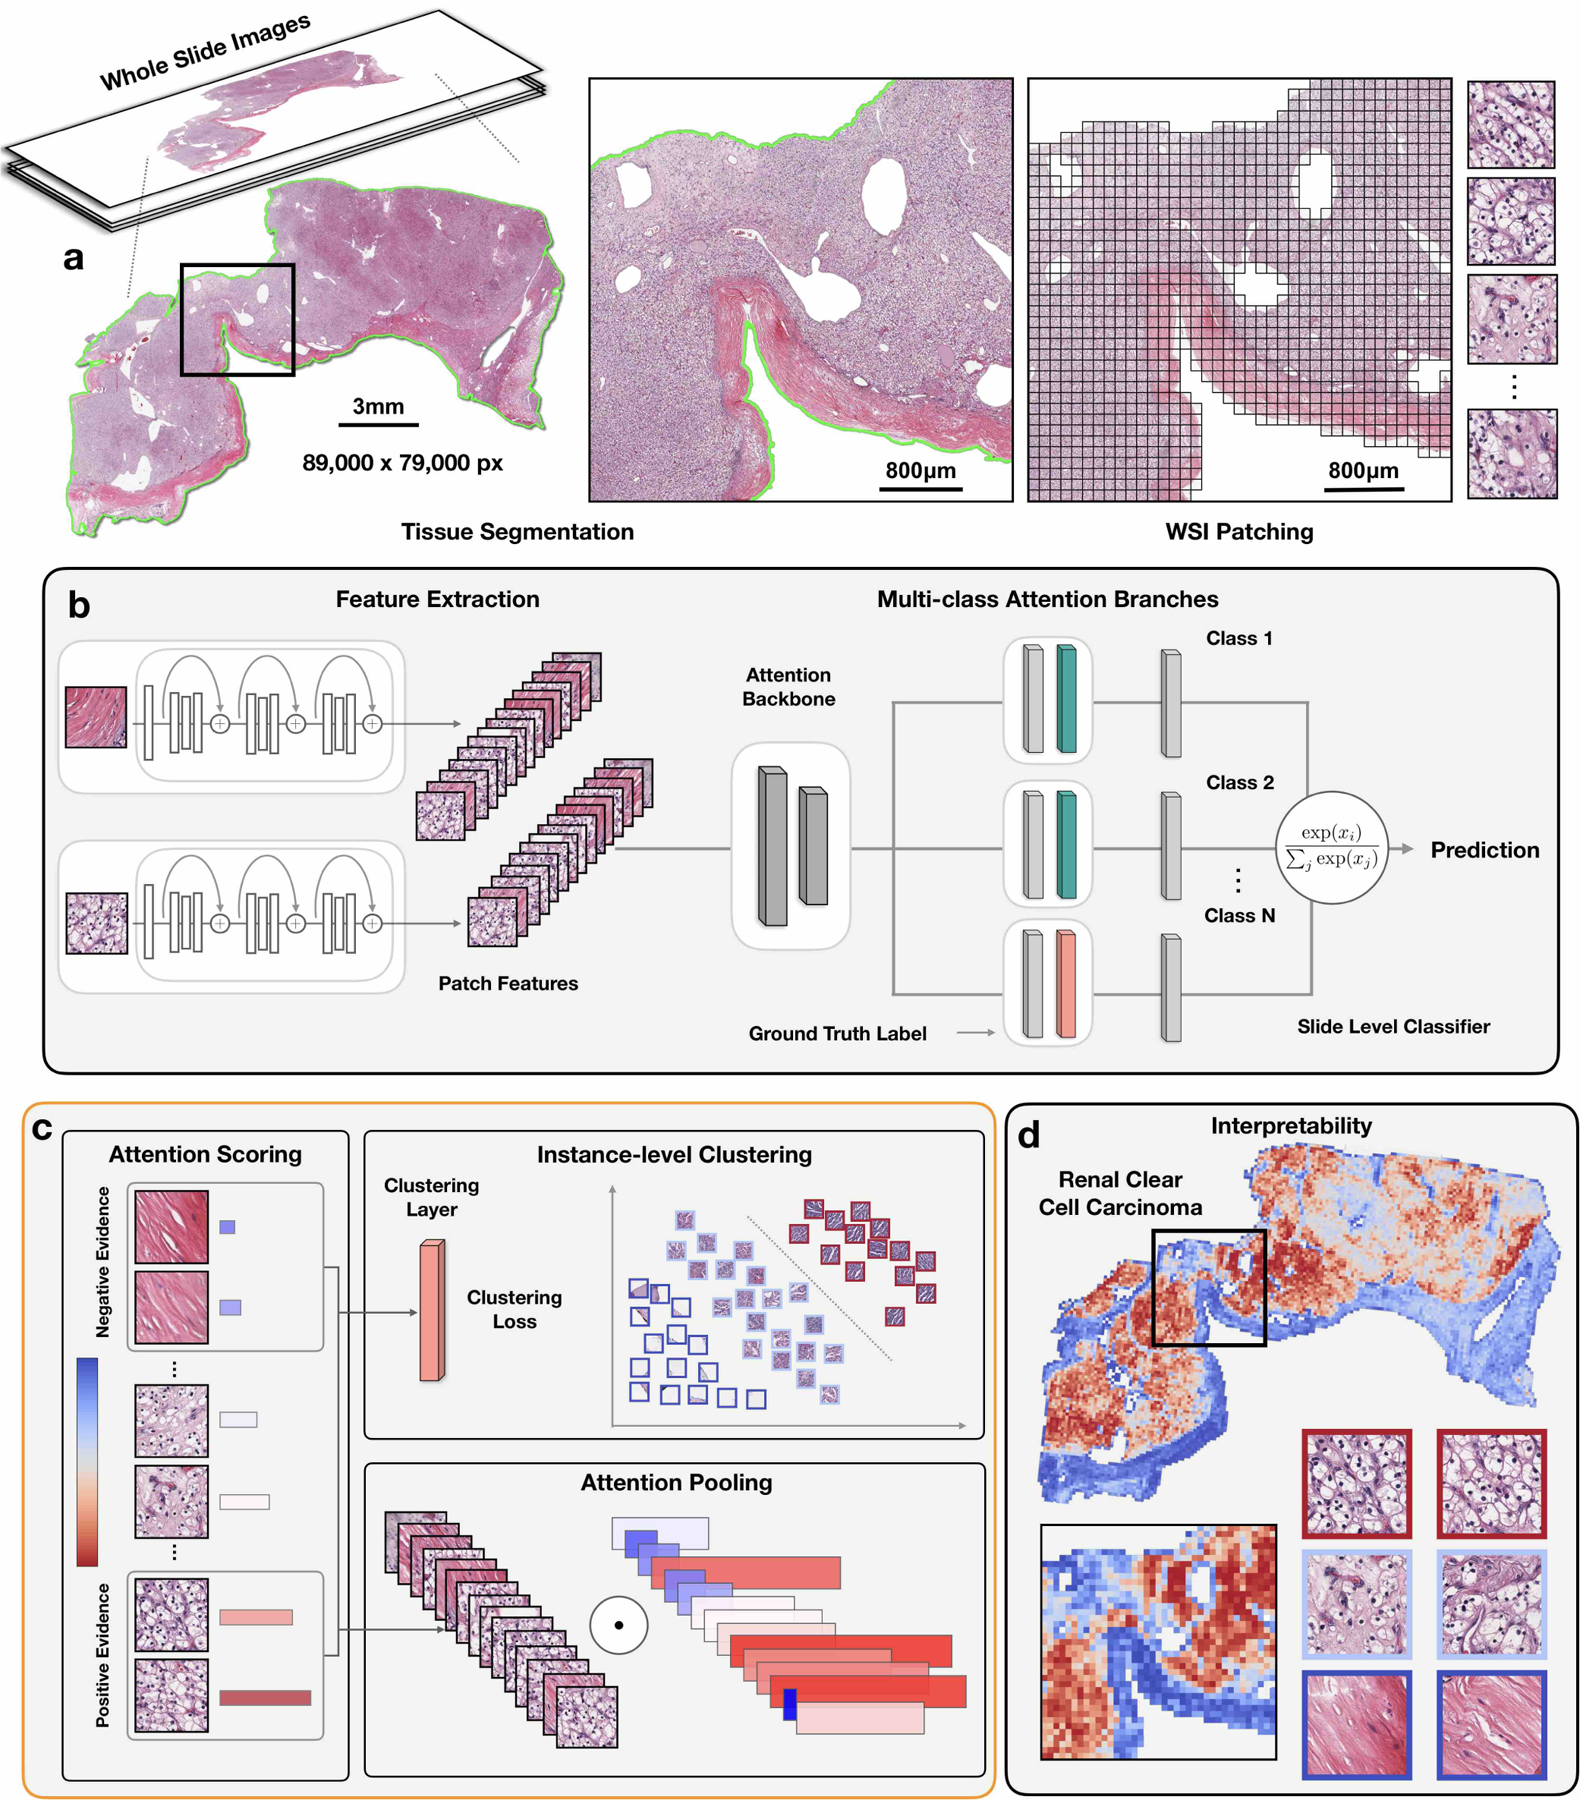
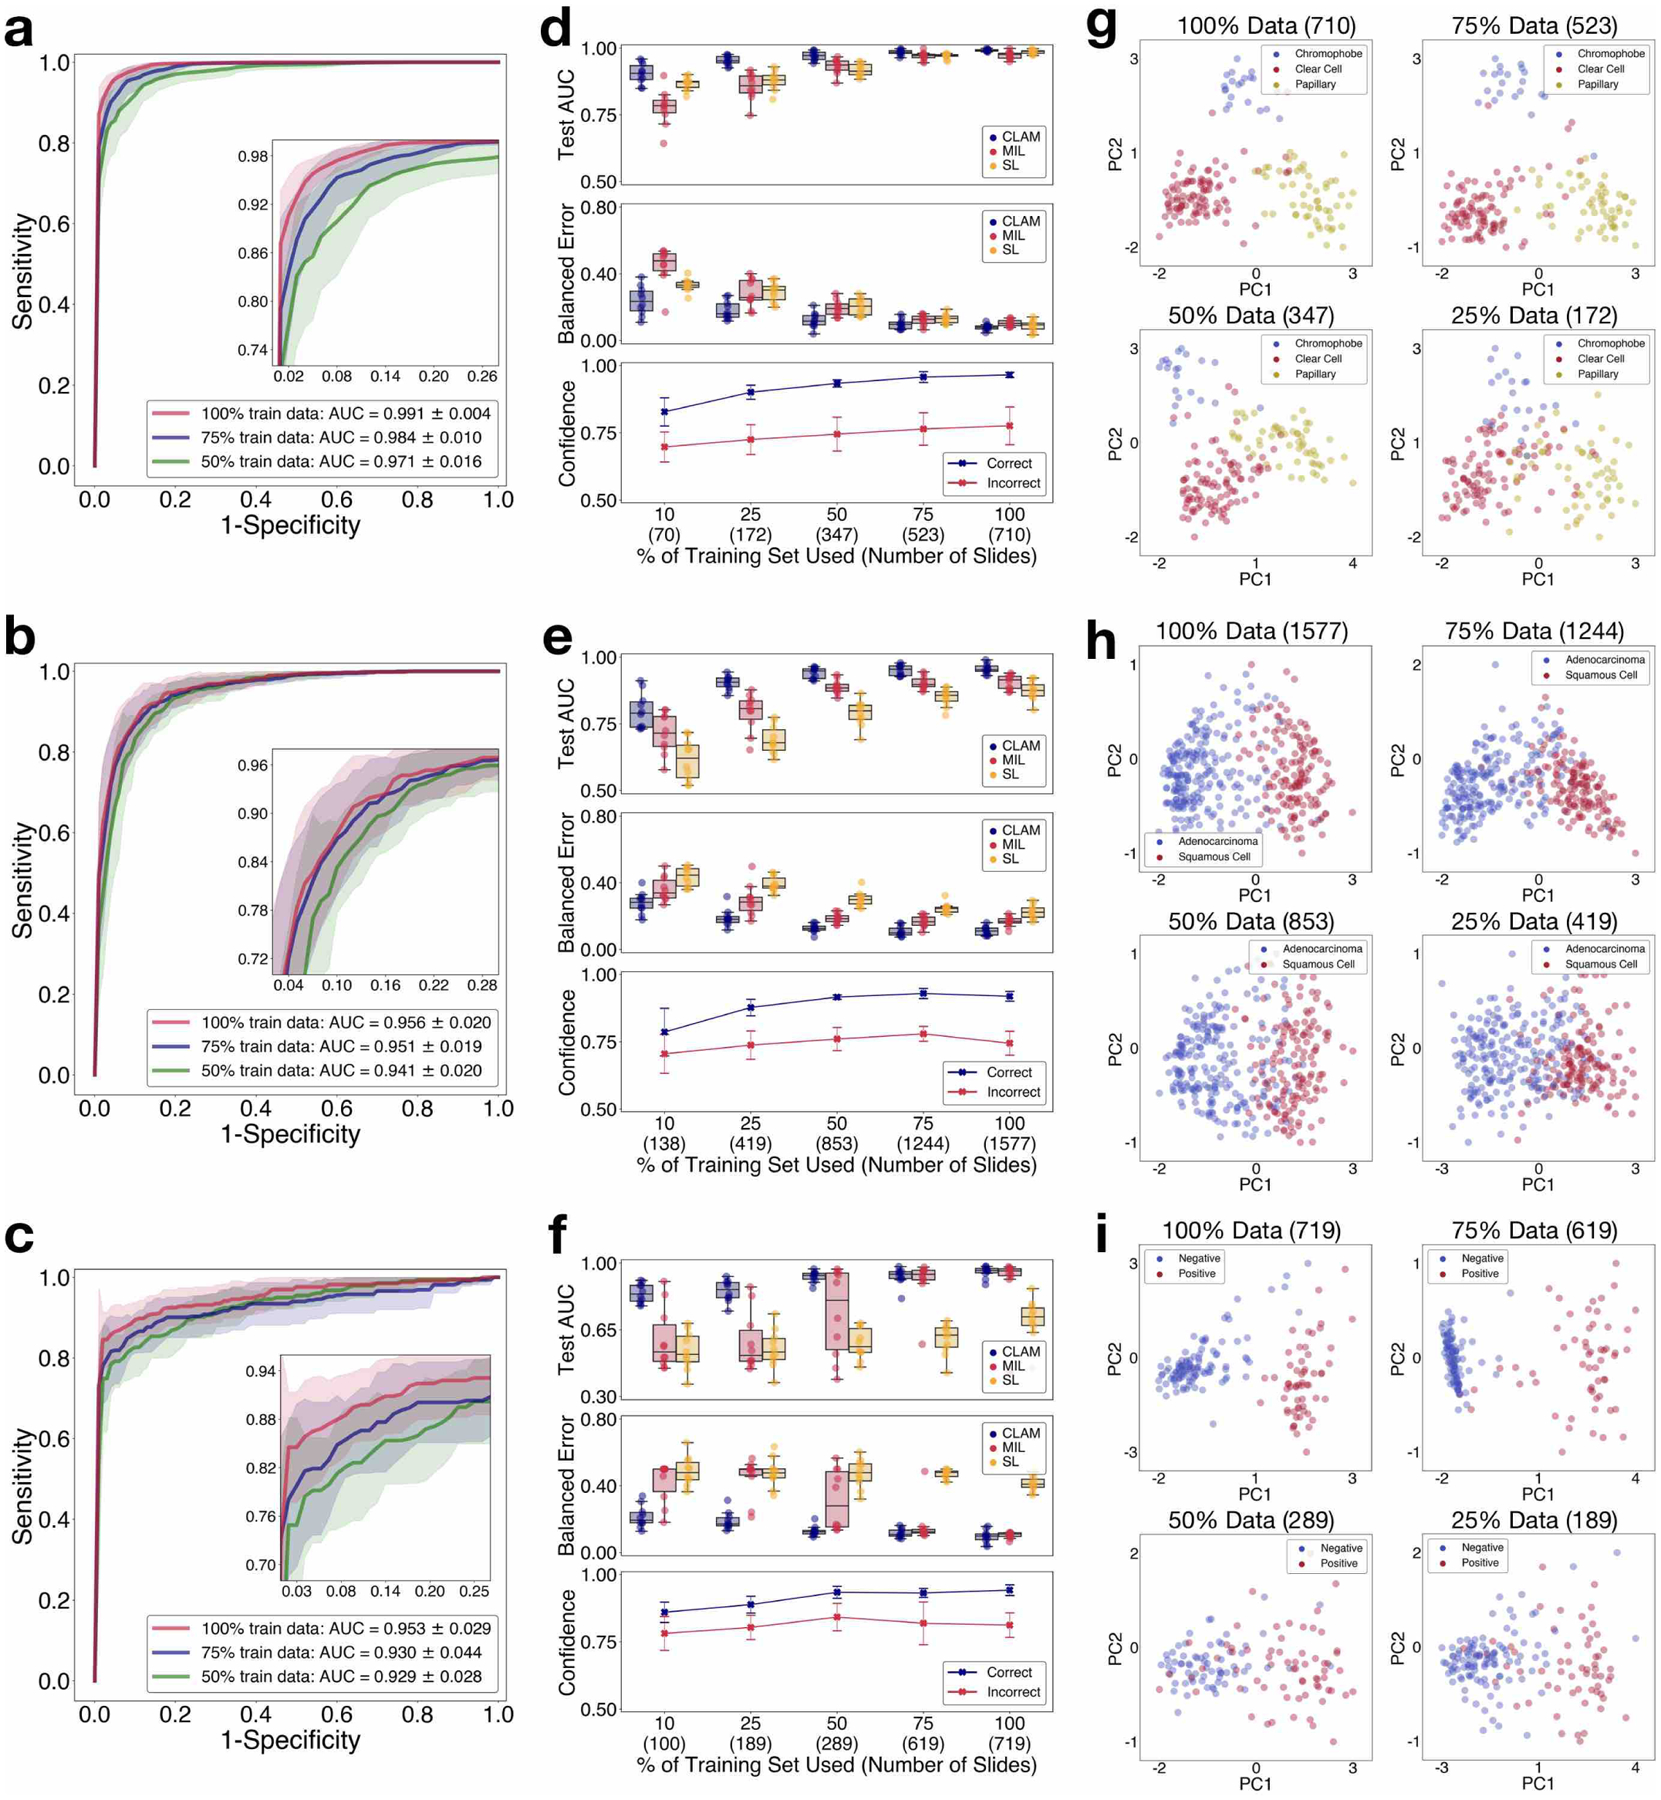
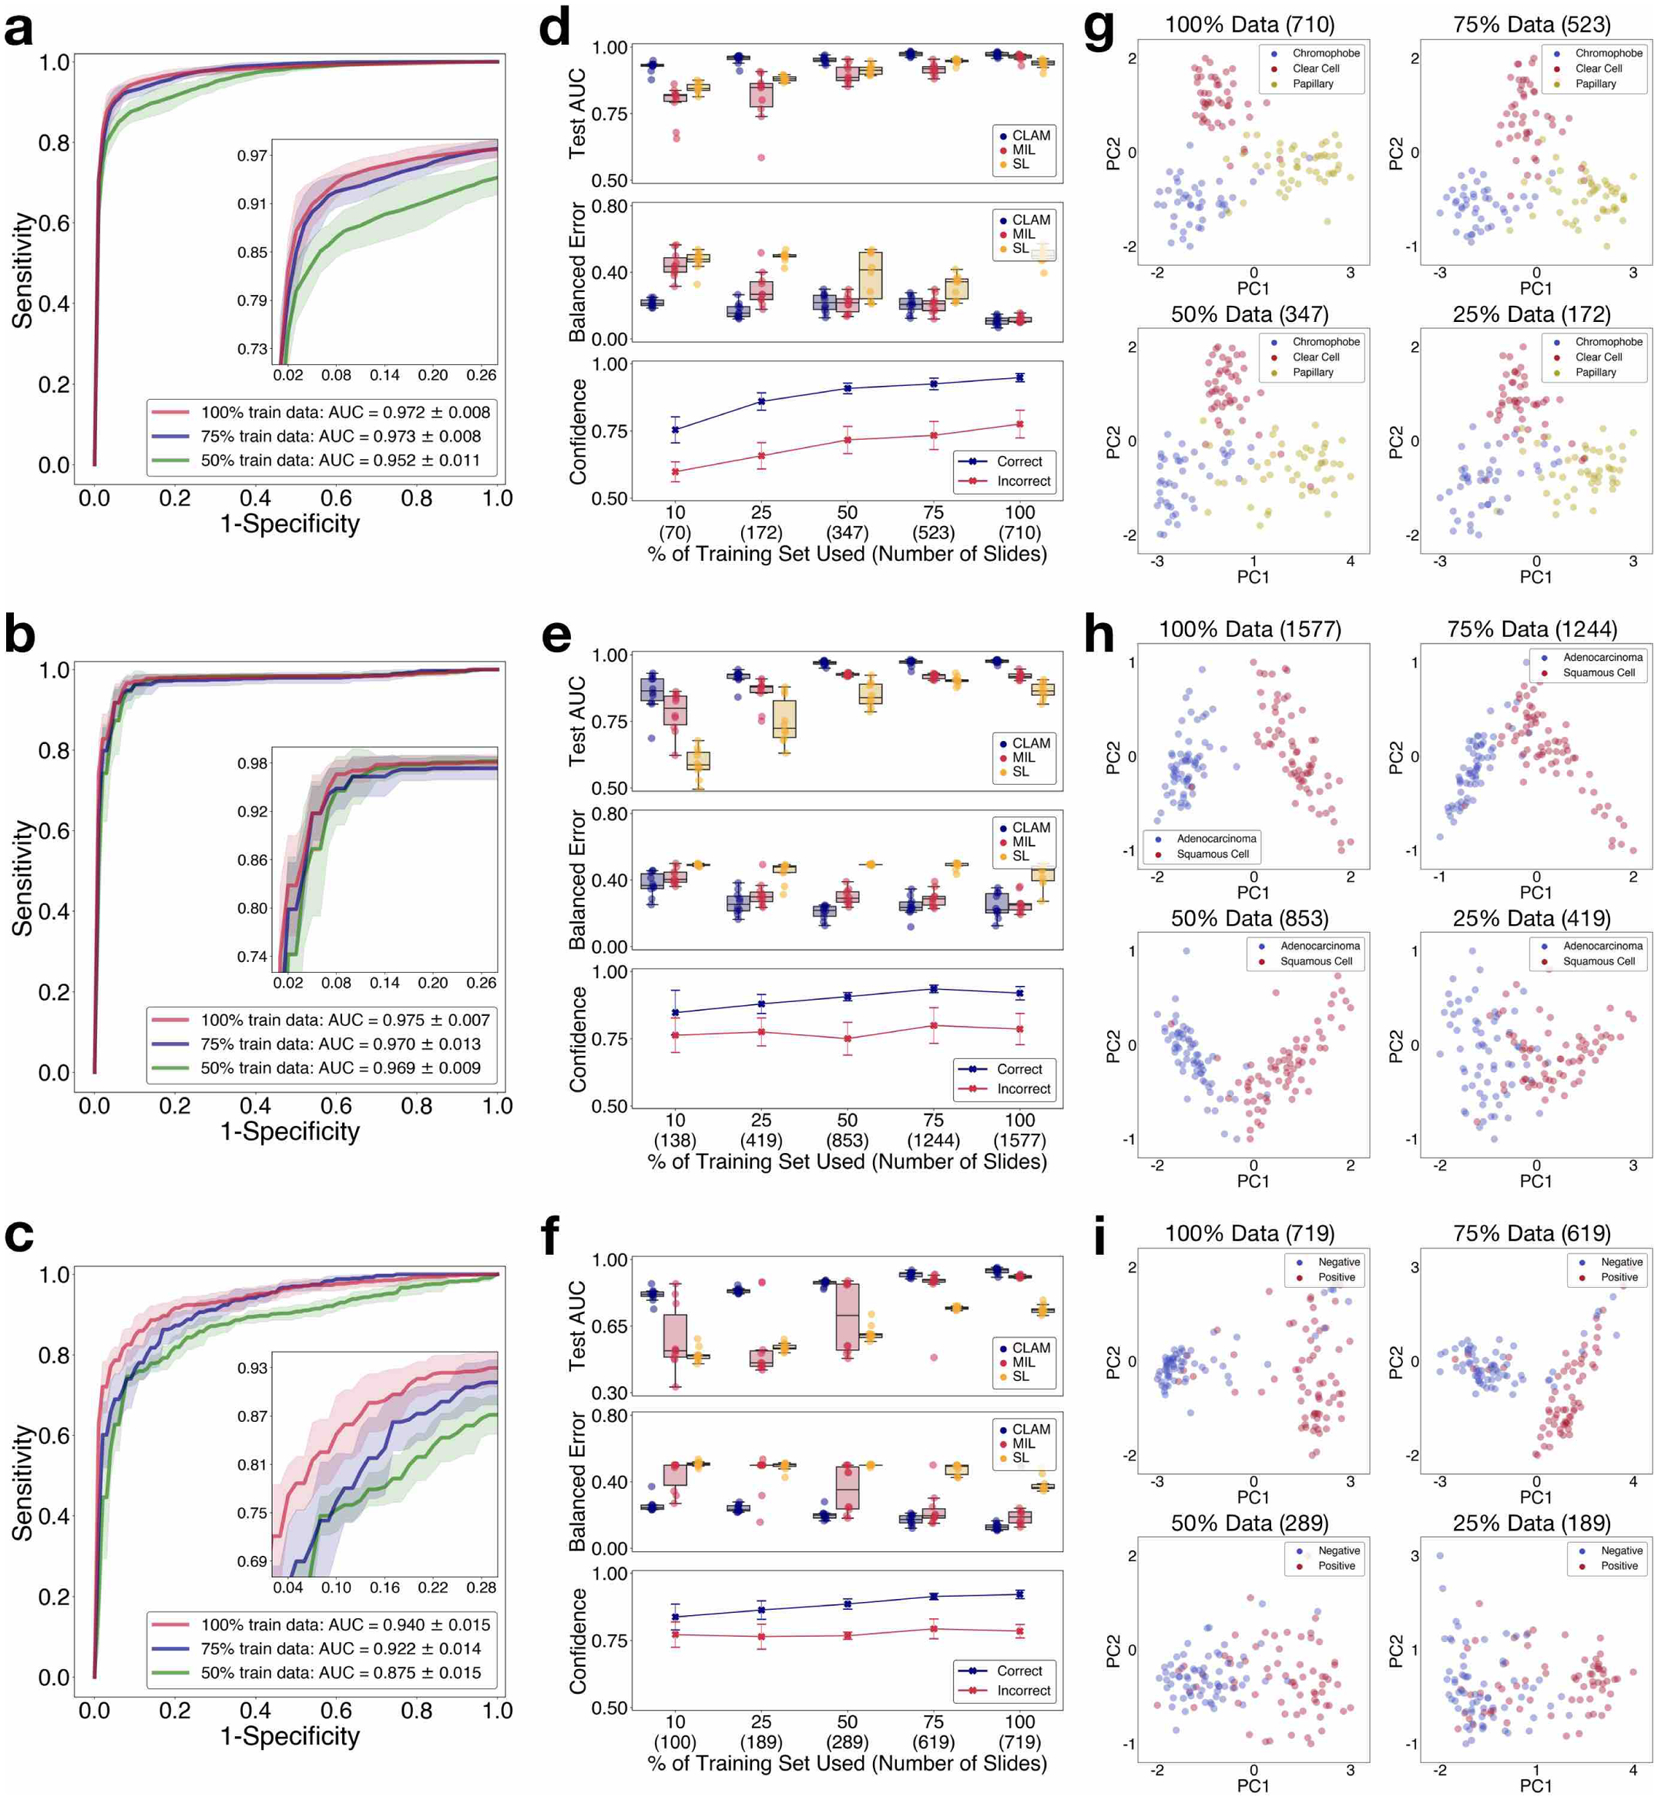
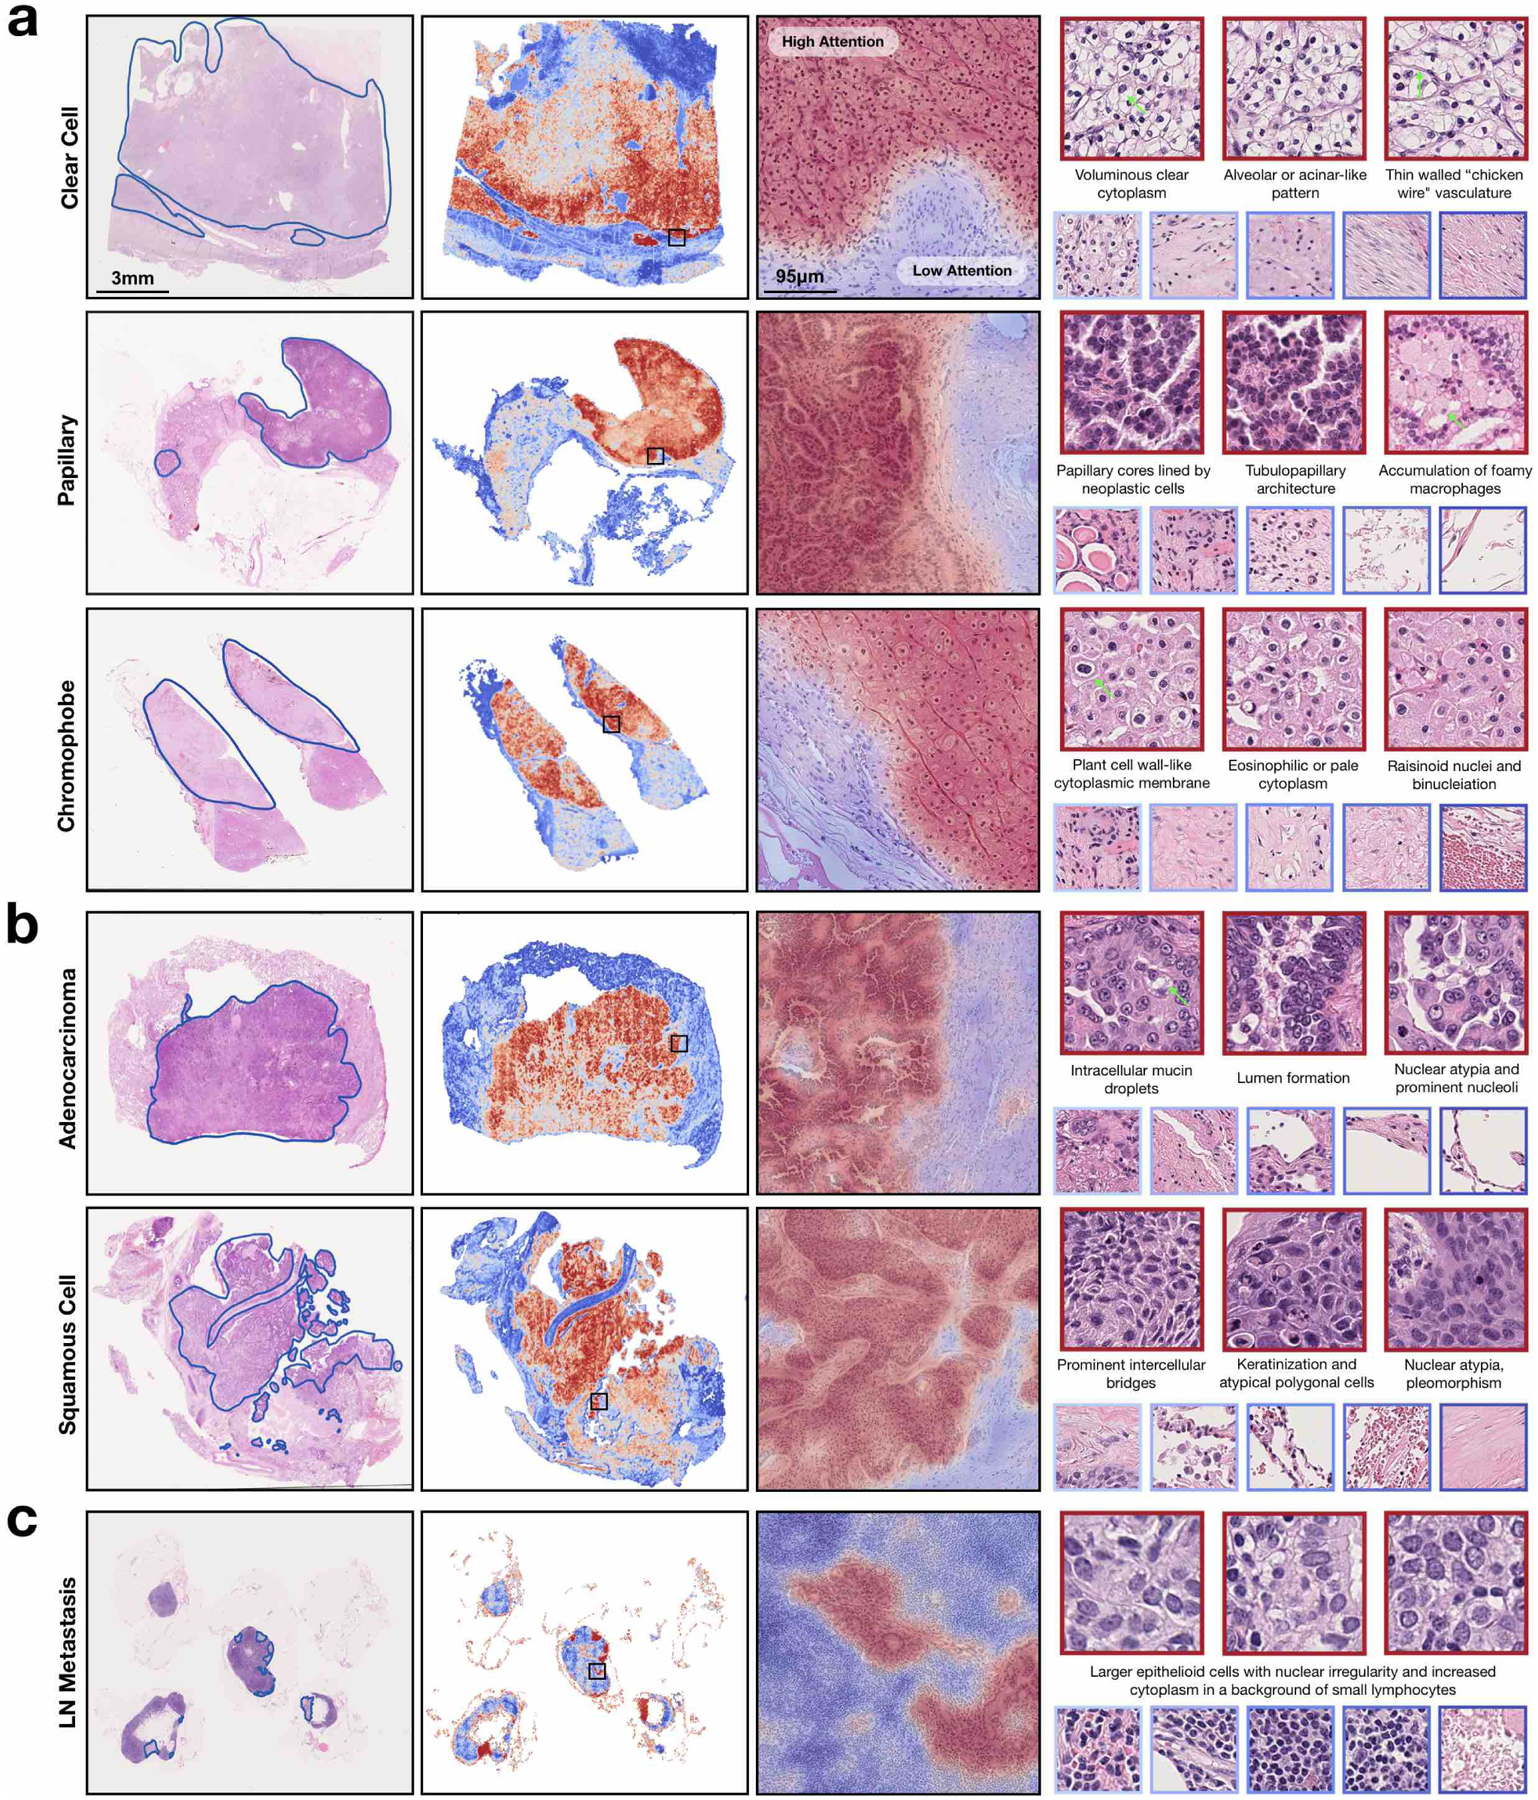
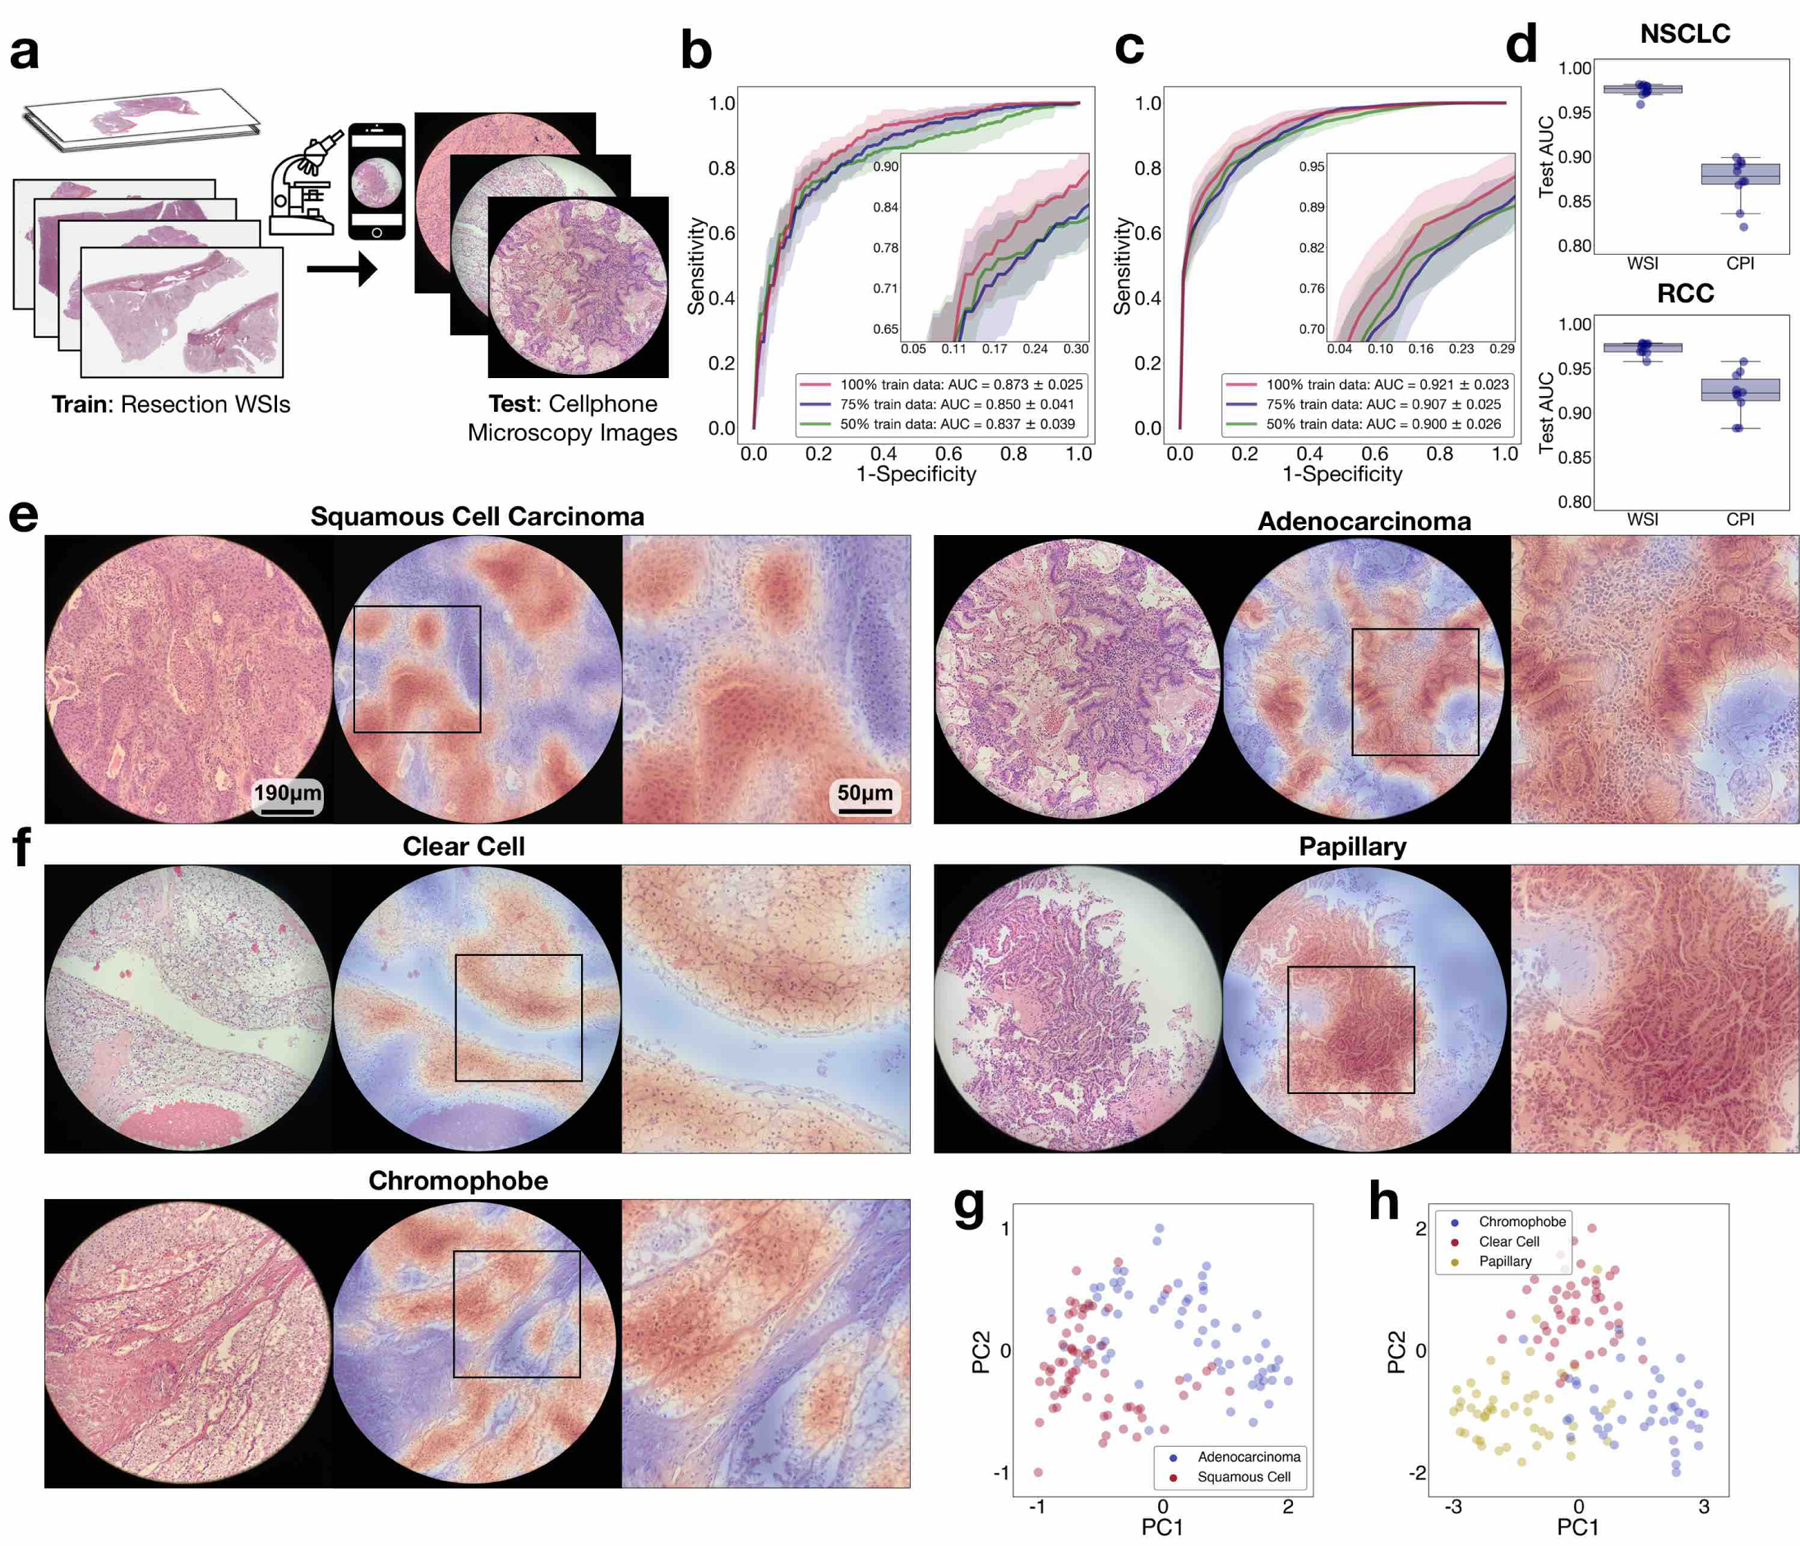
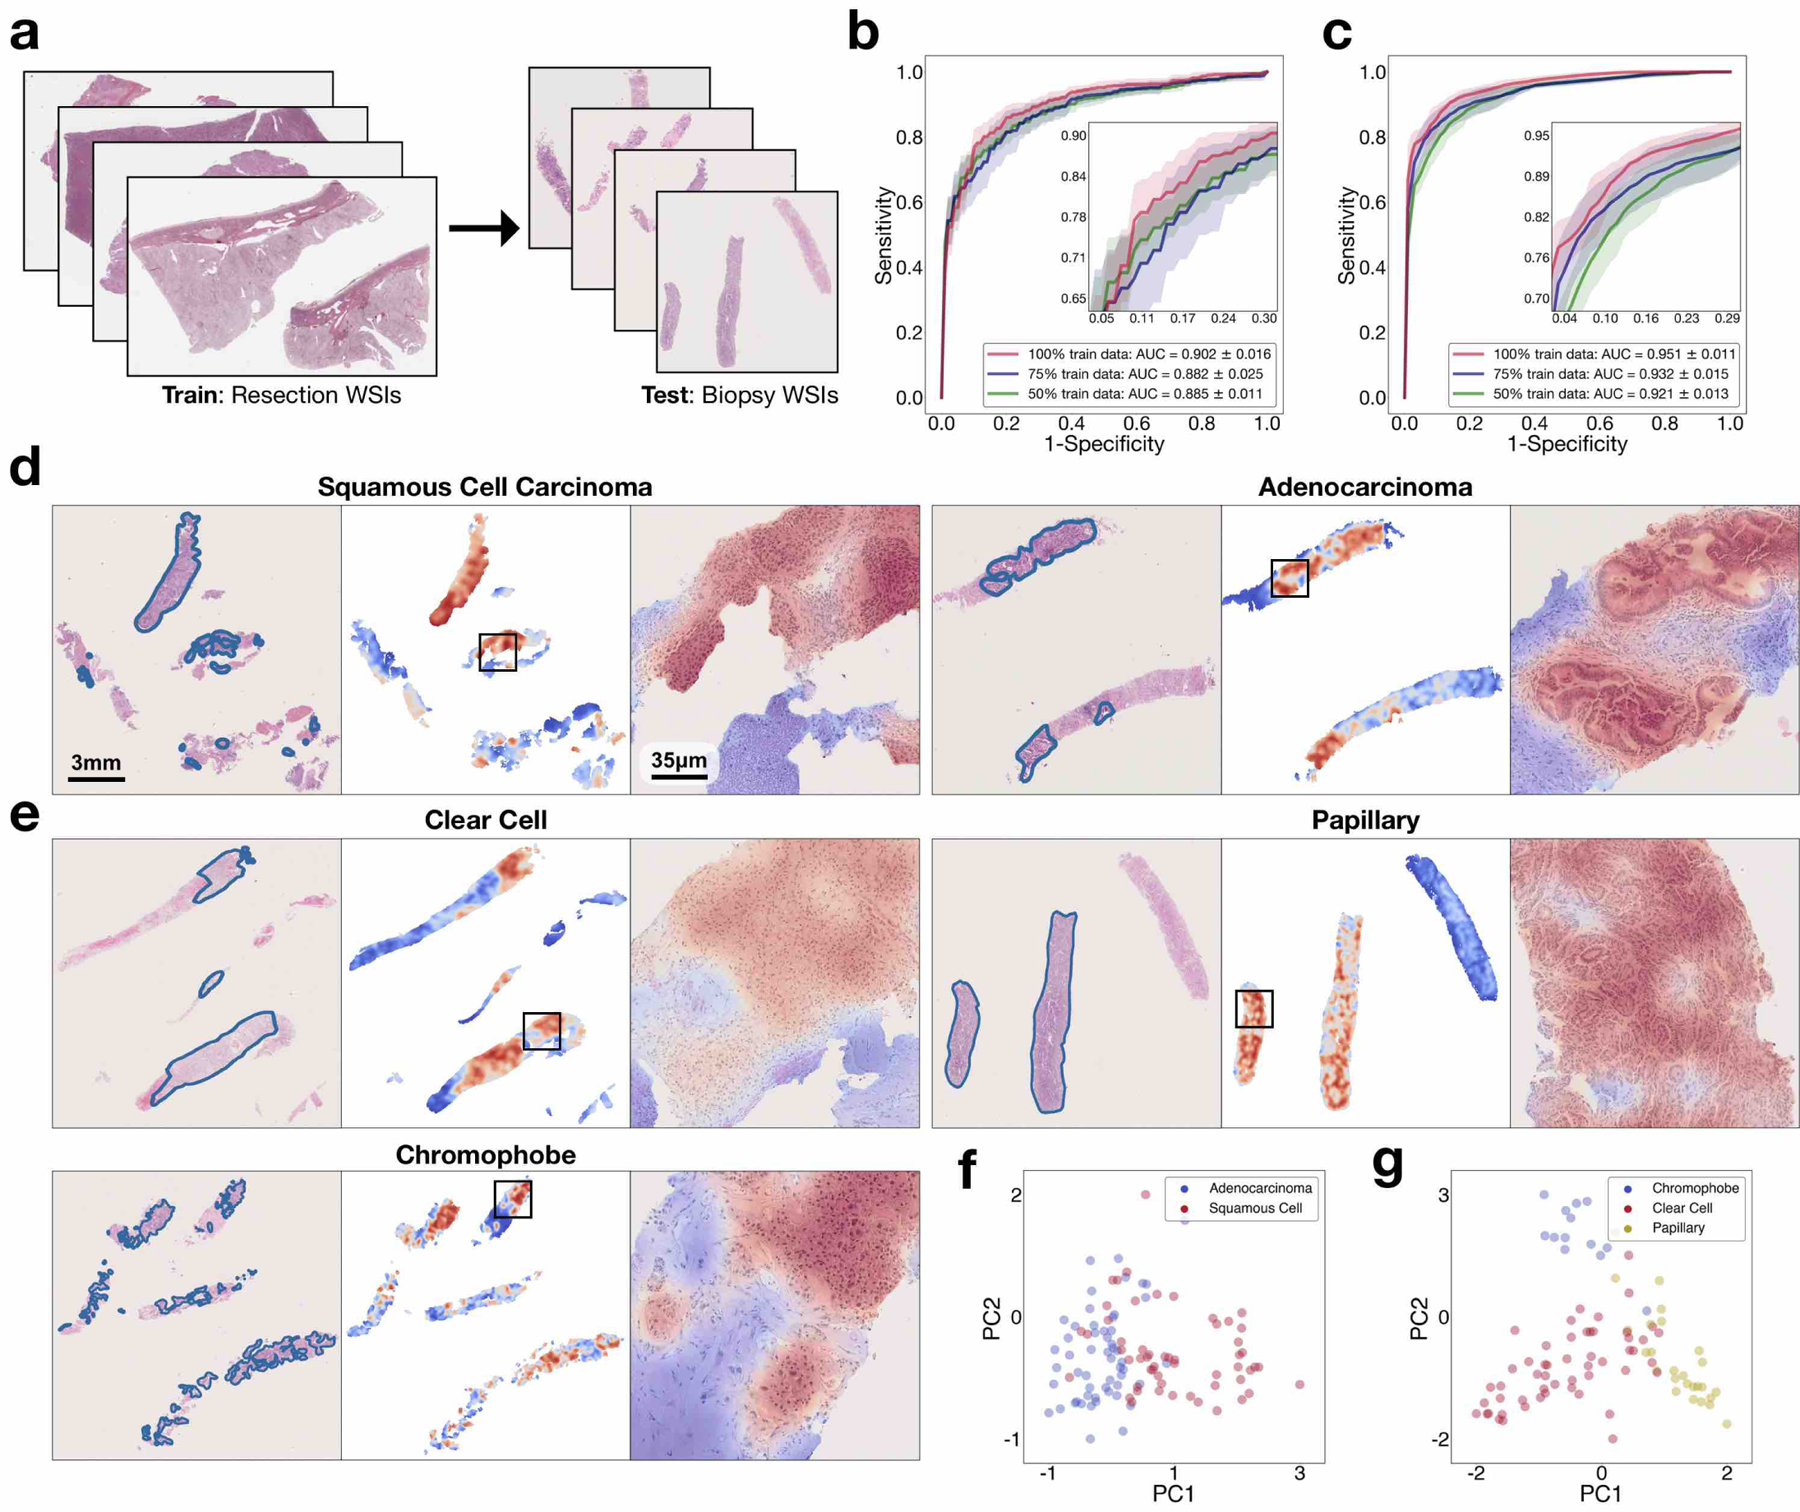
Deep-learning methods for computational pathology require either manual annotation of gigapixel whole-slide images (WSIs) or large datasets of WSIs with slide-level labels and typically suffer from poor domain adaptation and interpretability. Here we report an interpretable weakly supervised deep-learning method for data-efficient WSI processing and learning that only requires slide-level labels. The method, which we named clustering-constrained-attention multiple-instance learning (CLAM), uses attention-based learning to identify subregions of high diagnostic value to accurately classify whole slides and instance-level clustering over the identified representative regions to constrain and refine the feature space. By applying CLAM to the subtyping of renal cell carcinoma and non-small-cell lung cancer as well as the detection of lymph node metastasis, we show that it can be used to localize well-known morphological features on WSIs without the need for spatial labels, that it overperforms standard weakly supervised classification algorithms and that it is adaptable to independent test cohorts, smartphone microscopy and varying tissue content.


Conflict of interest statement

Competing interests

The authors declare that they have no competing financial interests.

Figures

Fig 1.
Fig 1.. Overview of the CLAM conceptual framework, architecture and interpretability.
a, Following segmentation (left), image patches are extracted from the tissue regions of the WSI (right). b, Patches are encoded once by a pre-trained CNN into a descriptive feature representation. During training and inference, the extracted patches in each WSI are passed to a CLAM model as feature vectors. An attention network is used to aggregate patch-level information into slide-level representations, which are used to make the final diagnostic prediction. c, For each class, the attention network ranks each region in the slide and assigns an attention score based on its relative importance to the slide-level diagnosis (left). Attention pooling weighs patches by their respective attention scores and summarizes patch-level features into slide-level representations (bottom right). During training, given the ground-truth label, the strongly attended (red) and weakly attended (blue) regions can additionally be used as representative samples to supervise clustering layers that learn a rich patch-level feature space separable between the positive and negative instances of distinct classes (top right). d, The attention scores can be visualized as a heatmap to identify ROIs and interpret the important morphology used for diagnosis.
Fig 2.
Fig 2.. Performance, data efficiency and comparative analysis.
ai, The 10-fold Monte Carlo cross-validation prediction results and test performance of CLAM models are analysed for RCC subtyping (a,d,g; n = 86), NSCLC subtyping (b,e,h; n = 196) and the detection of lymph node metastasis (c,f,i; n = 89). ac, Mean test AUC ± s.d. of CLAM models using 100, 75 and 50% of cases in the training set. The confidence band shows ±1 s.d. for the averaged receiver-operating-characteristic curve. For multi-class RCC subtyping, the macro-averaged curve and AUC is reported. Insets: zoomed-in view of the curves. df, The dataset-size-dependent performance of various weakly supervised classification algorithms, in terms of the 10-fold test AUCs (top) and balanced error scores (middle) is shown using box plots for each training-set size (100, 75, 50, 25 and 10% of cases). The boxes indicate the quartile values and the whiskers extend to data points within 1.5× of the interquartile range. Mean confidence (± 1 s.d.) of the predictions made by the CLAM models for correctly and incorrectly classified slides (bottom). gi, Visualization of the learned slide-level feature space for CLAM models; following PCA, the final slide-level feature representation used for the prediction of the model is plotted for each slide in both the validation and test set for a single cross-validated fold. PC, principal component. di, The number of slides used for each training-set size is shown in parentheses.
Fig 3.
Fig 3.. Adaptability to independent test cohorts.
ai, Independent test cohorts from BWH for RCC (a,d,g), NSCLC (b,e,h) and lymph node metastasis (c,f,i) are used to assess and analyse the capability of CLAM models trained on public datasets to generalize to new data sources that are not encountered during training. ac, Performance of the CLAM model in terms of 10-fold mean test AUCs ± s.d. for RCC subtyping (n = 135), NSCLC subtyping (n = 131) and the detection of lymph node metastasis (n = 133). Insets: zoomed-in view of the curves. df, For each training-set size, the test AUCs (top) and balanced error scores (middle) of ten models are reported for CLAM, MIL (mMIL for RCC subtyping) and SL using box plots. The boxes indicate the quartile values and the whiskers extend to data points within 1.5× of the interquartile range. The results demonstrate that CLAM models can generalize to new data sources after training on a limited number of labelled slides and outperform other weakly supervised baselines with high consistency. Mean confidence (±1 s.d.) of CLAM model predictions for correctly and incorrectly classified slides (bottom). In general, CLAM models become less confident when trained using fewer data. gi, Visualization of the slide-level feature space in two dimensions for select models from different training-set sizes. di, The number of slides used for each training-set size is shown in parentheses.
Fig 4.
Fig 4.. Interpretability and visualization.
a,b, For RCC (a) and NSCLC (b) subtyping, a representative slide from each subtype was annotated by a pathologist (left), who roughly highlighted the tumour tissue regions. c, Similarly, regions of metastasis are highlighted for a case of lymph node metastasis (left). ac, A whole-slide attention heatmap corresponding to each slide was generated by computing the attention scores for the predicted class of the model over patches tiled with a spatial overlap of 25% (second column); the fine-grained ROI heatmap, which highlights parts of the tumour normal boundary, was generated using a 95% overlap and overlaid onto the original H&E image (third column; zoomed-in view of the regions in the black squares in the images to its left). Patches of the most highly attended regions (red border) generally exhibit well-known tumour morphology and low-attention patches (blue border) include normal tissue among different background artefacts (right). Green arrows highlight specific morphology corresponding to the textual description. High-resolution WSIs and heatmaps corresponding to these slides may be viewed in our interactive demo (http://clam.mahmoodlab.org).
Fig 5.
Fig 5.. Adaptability to smartphone microscopy images.
a, CLAM models trained on WSIs are adapted to CPIs taken with a consumer-grade smartphone camera without domain adaptation, stain normalization or further fine-tuning. b,c, An average test AUC of 0.873 ± 0.025 and 0.921 ± 0.023 was achieved for the BWH NSCLC (b; n = 131) and BWH RCC (c; n = 135) independent test sets, respectively. For each slide, patches extracted from all FOVs are collectively used by the CLAM model to inform the slide-level diagnosis. Insets: zoomed-in view of the curves. d, A drop in performance is expected when directly adapting models trained on data from one imaging modality (WSIs) to another (CPIs). We noted a decrease of 0.102 and 0.051 in the mean test AUC (relative to the performances on the corresponding WSI independent datasets) for NSCLC (top) and RCC (bottom) subtyping, respectively, when evaluating CLAM models (using 100% of the training set) on our CPI datasets. The boxes indicate the quartile values and the whiskers extend to data points within 1.5× of the interquartile range. e,f, The attention heatmaps (shown for NSCLC (e) and RCC (f) subtyping) help make model predictions interpretable by highlighting the discriminative regions in each FOV used by the model to make the slide-level diagnostic prediction. We observed that the model attends strongly to tumour regions and largely ignores normal tissue and background artefacts, as expected. However, due to the circular-shaped cutout of each FOV, patches near the border inevitably encapsulate varying degrees of black space in addition to the tissue content, which can mislead the model towards assigning weaker attention to those regions than it would otherwise. Zoomed-in views of the boxed regions are shown on the right. g,h, As additional validation that CLAM models trained on WSIs are directly applicable to the classification of CPIs, we visualized the attention-pooled feature representation of each set of CPIs and observed that there is visible separation between distinct classes in both the NSCLC (g) and RCC (h) smartphone datasets.
Fig 6.
Fig 6.. Adaptability to biopsy slides.
a, Compared with resection WSIs, biopsy WSIs generally contain a much lower tissue content (for example, the average number of patches extracted from the tissue regions of each slide is 820 in our BWH lung biopsy dataset compared with 24,714 in the lung-resection dataset). The presence of crush artefacts as well as poorly differentiated and sparsely distributed tumour cells can further challenge accurate diagnosis. b,c, We observed that CLAM models trained on resections are directly adaptable to biopsy WSIs, achieving a respectable average test AUC of 0.902 ± 0.016 and 0.951 ± 0.011 on our NSCLC (b; n = 110) and RCC (c; n = 92) biopsy independent test cohorts, respectively, without further fine-tuning or ROI extraction. Insets: zoomed-in view of the curves. d,e, Attention heatmap visualization for NSCLC (d) and RCC (e) biopsy slides. H&E slide with annotation by the pathologist for tumour regions (left). Heatmap for patches tiled with a 95% overlap (middle). Zoomed-in view of tumour regions attended by the CLAM model (right). Consistent with our findings on the resection and smartphone datasets, the regions that were most strongly attended by the model consistently correspond to tumour tissue. The attention heatmaps also tend to clearly highlight the tumour–normal tissue boundaries, despite the fact that no patch-level or pixel-level annotation was required or used during training. f,g, The slide-level feature representations of the biopsy datasets are visualized in two dimensions using PCA. We observed that the feature space learned by the CLAM model from resections remains visibly separable among the distinct subtypes when it is adapted to biopsy slides for both NSCLC (f) and RCC (g). A high-resolution version of these biopsy whole slides and heatmaps may be viewed our interactive demo (http://clam.mahmoodlab.org).

References

    1. Bera K, Schalper & Madabhushi, A. Artificial intelligence in digital pathology—new tools for diagnosis and precision oncology. Nature Reviews Clinical Oncology 16, 703–715 (2019). - PMC - PubMed
    1. Niazi MKK, Parwani AV & Gurcan MN Digital pathology and artificial intelligence. The Lancet Oncology 20, e253–e261 (2019). - PMC - PubMed
    1. Hollon TC et al. Near real-time intraoperative brain tumor diagnosis using stimulated raman histology and deep neural networks. Nature Medicine 1–7 (2020). - PMC - PubMed
    1. Kather JN et al. Deep learning can predict microsatellite instability directly from histology in gastrointestinal cancer. Nature medicine 25, 1054–1056 (2019). - PMC - PubMed
    1. Bulten W et al. Automated deep-learning system for gleason grading of prostate cancer using biopsies: a diagnostic study. The Lancet Oncology (2020). - PubMed

Publication types

MeSH terms