. 2021 Mar;53(3):332-341.
doi: 10.1038/s41588-021-00779-1. Epub 2021 Mar 1.

Multimodal pooled Perturb-CITE-seq screens in patient models define mechanisms of cancer immune evasion

Affiliations

Multimodal pooled Perturb-CITE-seq screens in patient models define mechanisms of cancer immune evasion

Chris J Frangieh et al. Nat Genet. 2021 Mar.

Abstract

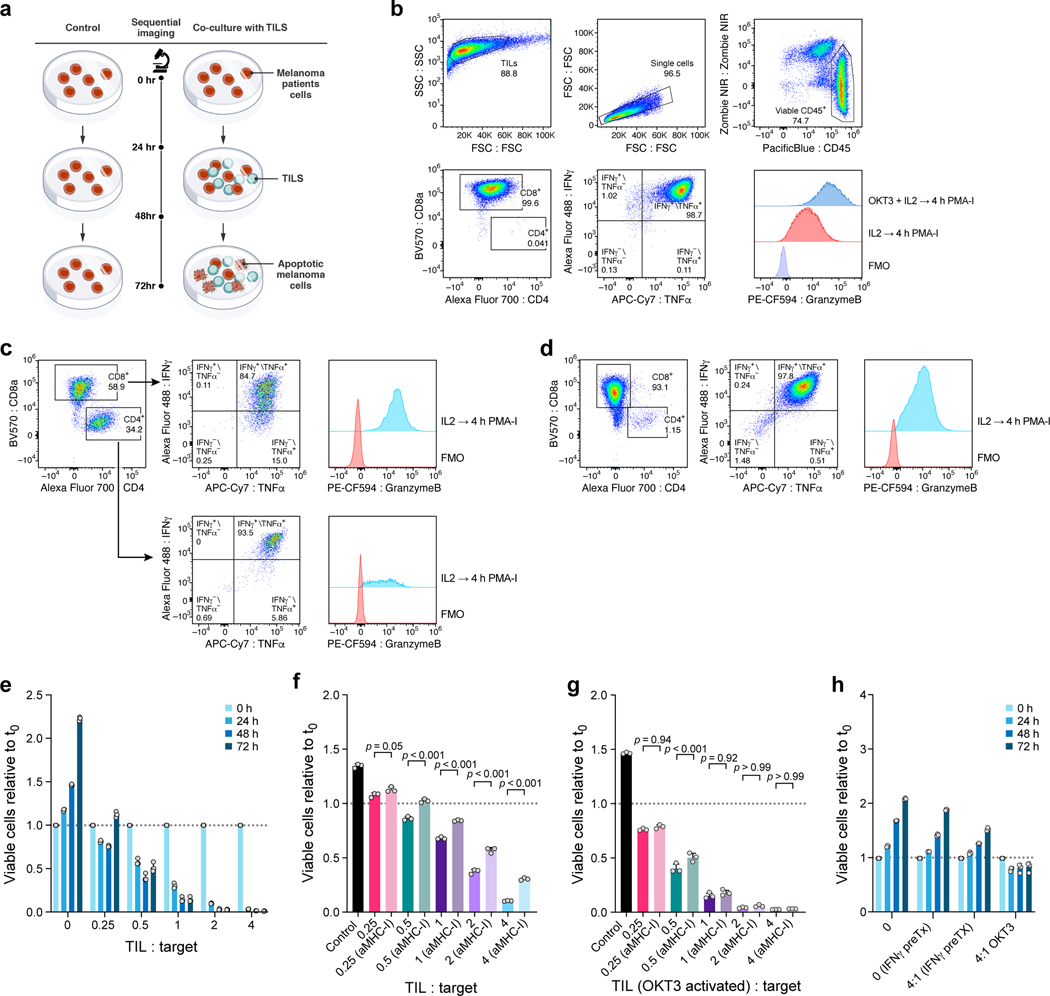
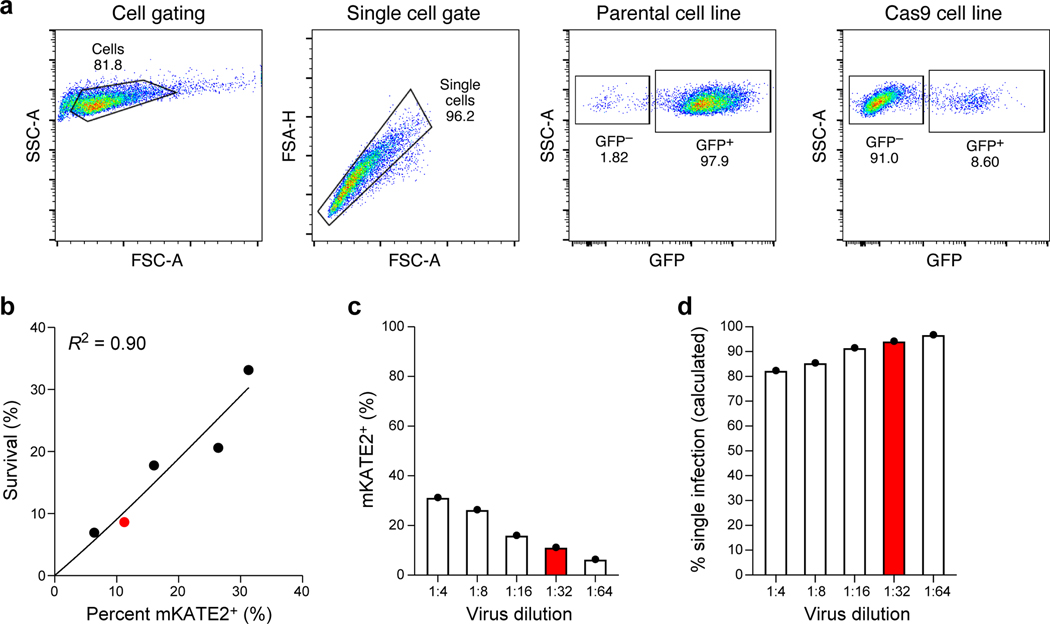
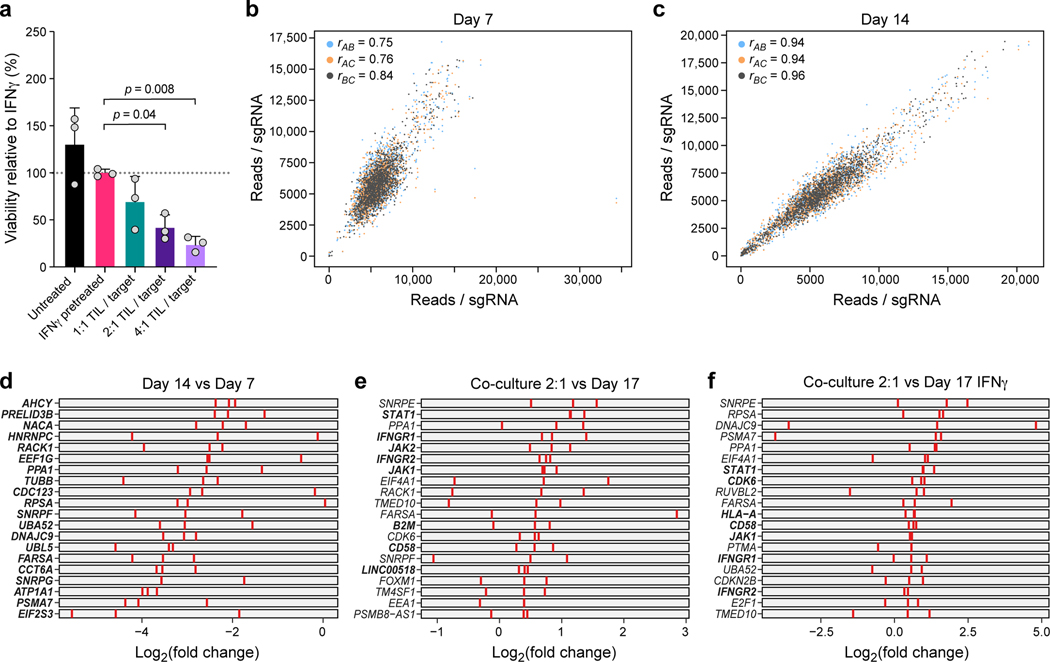
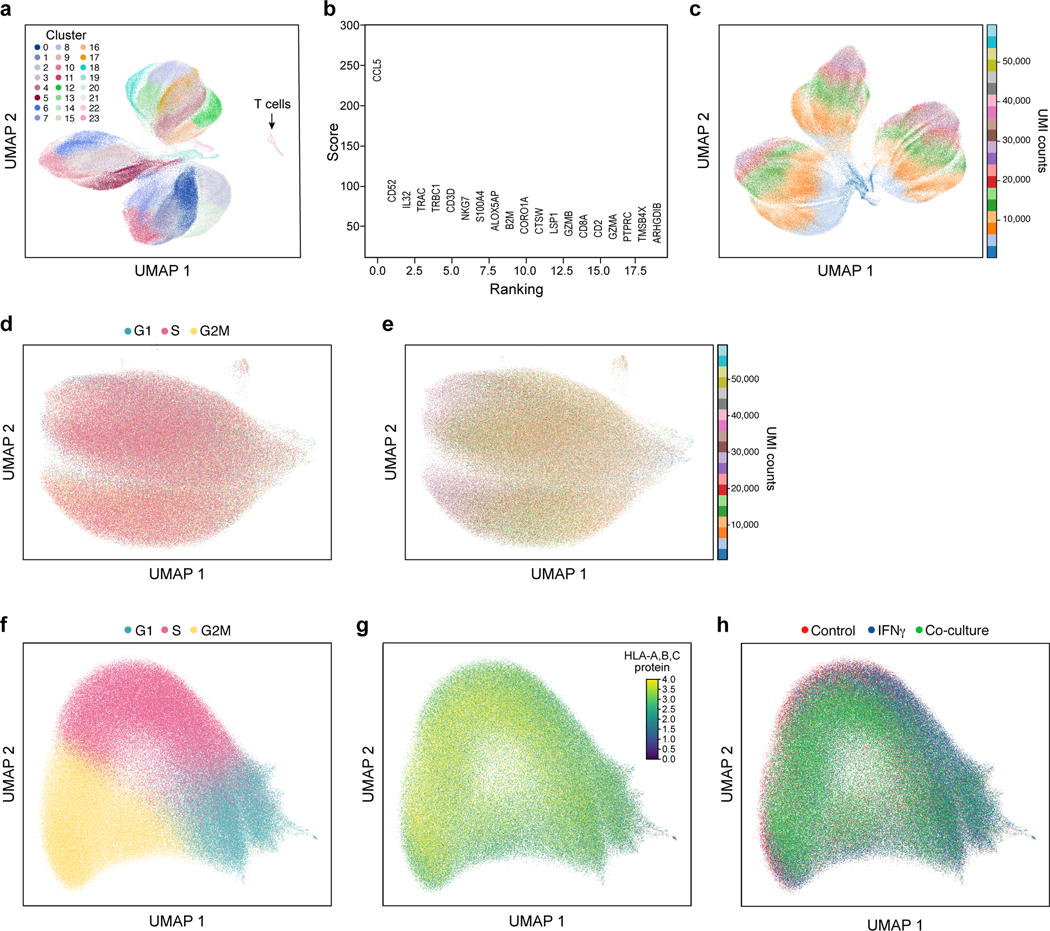
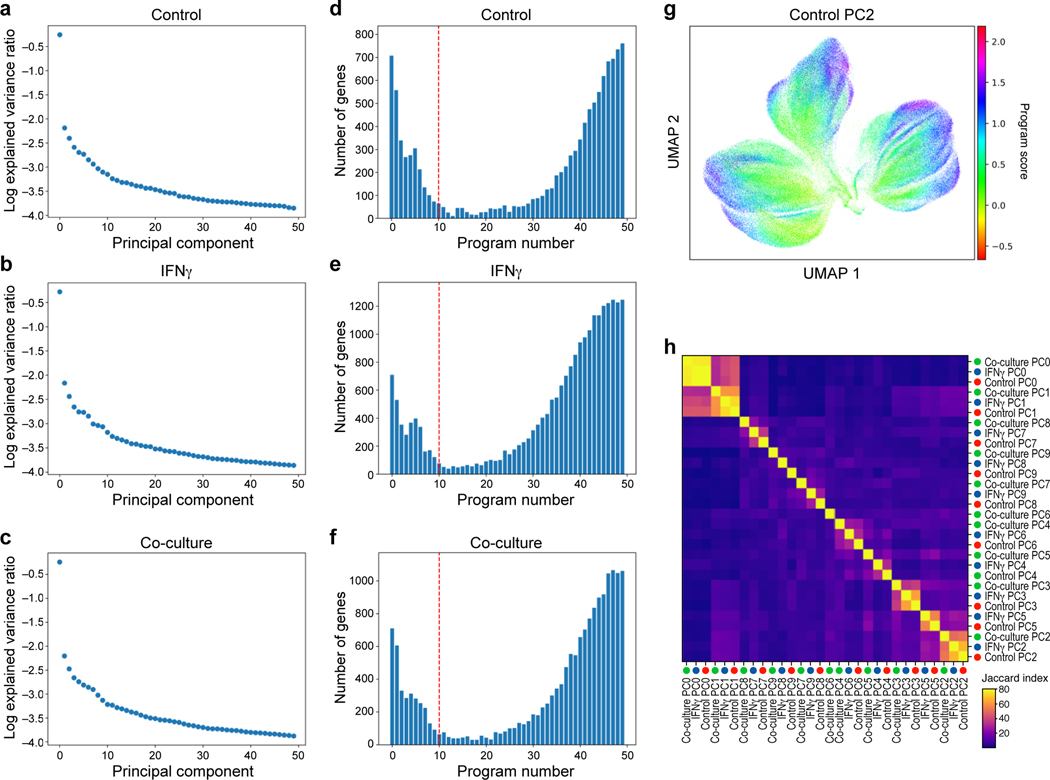
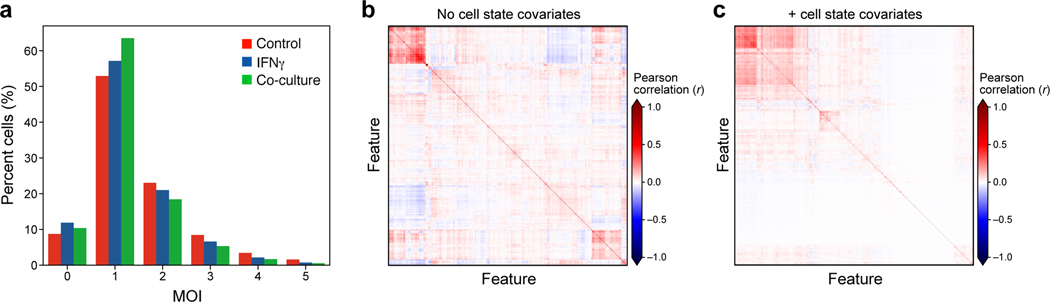
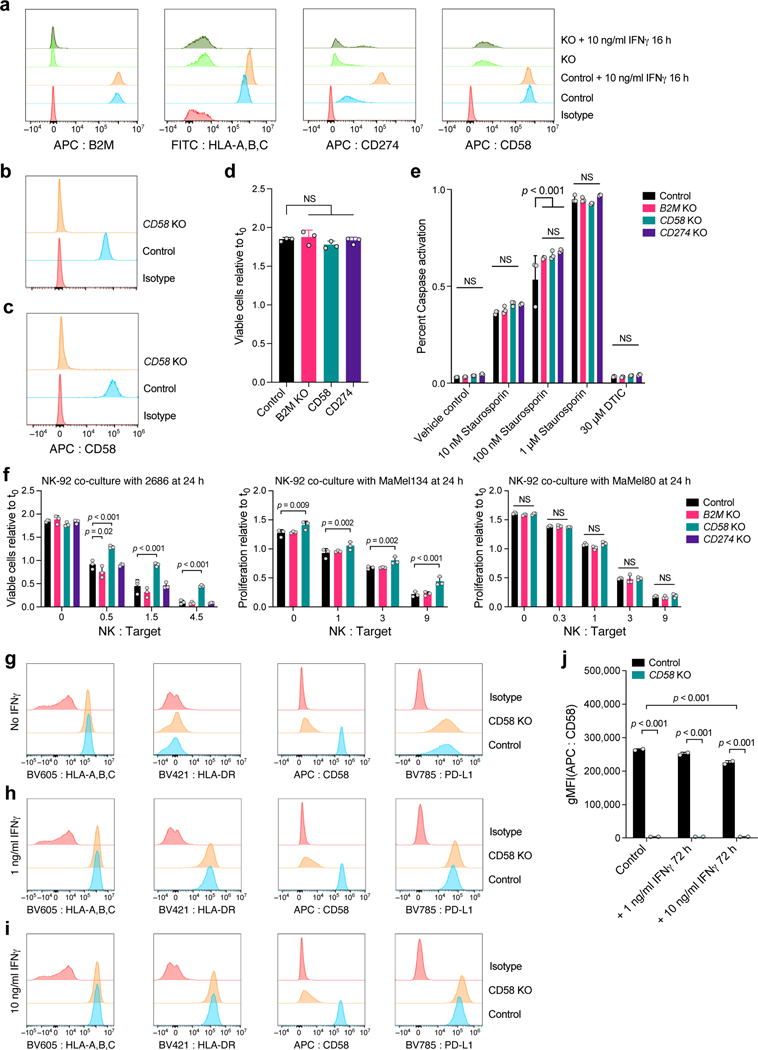
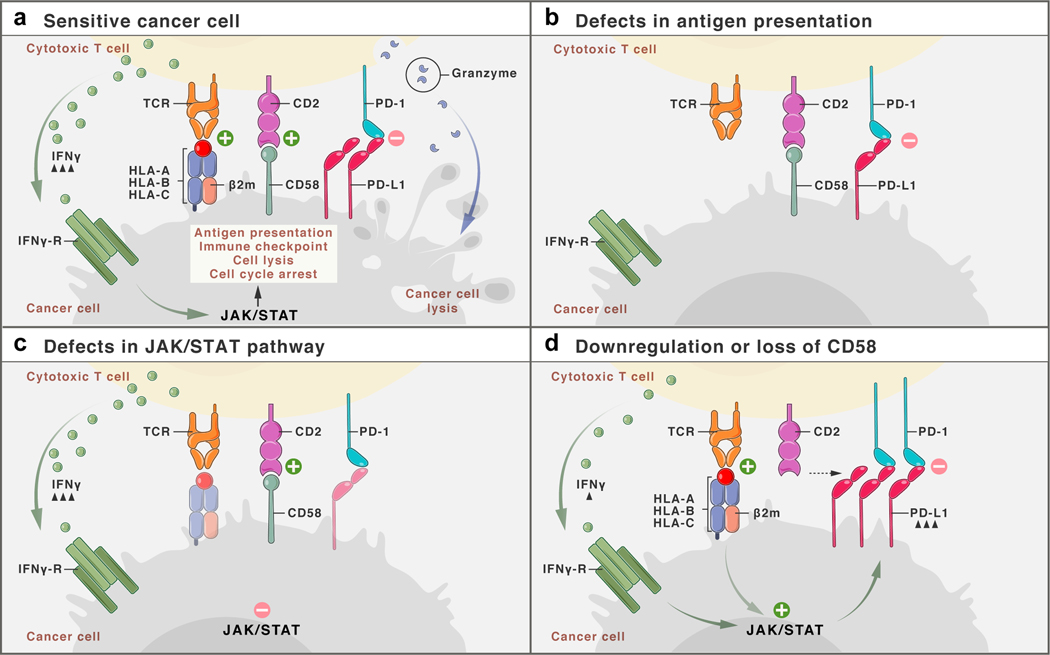
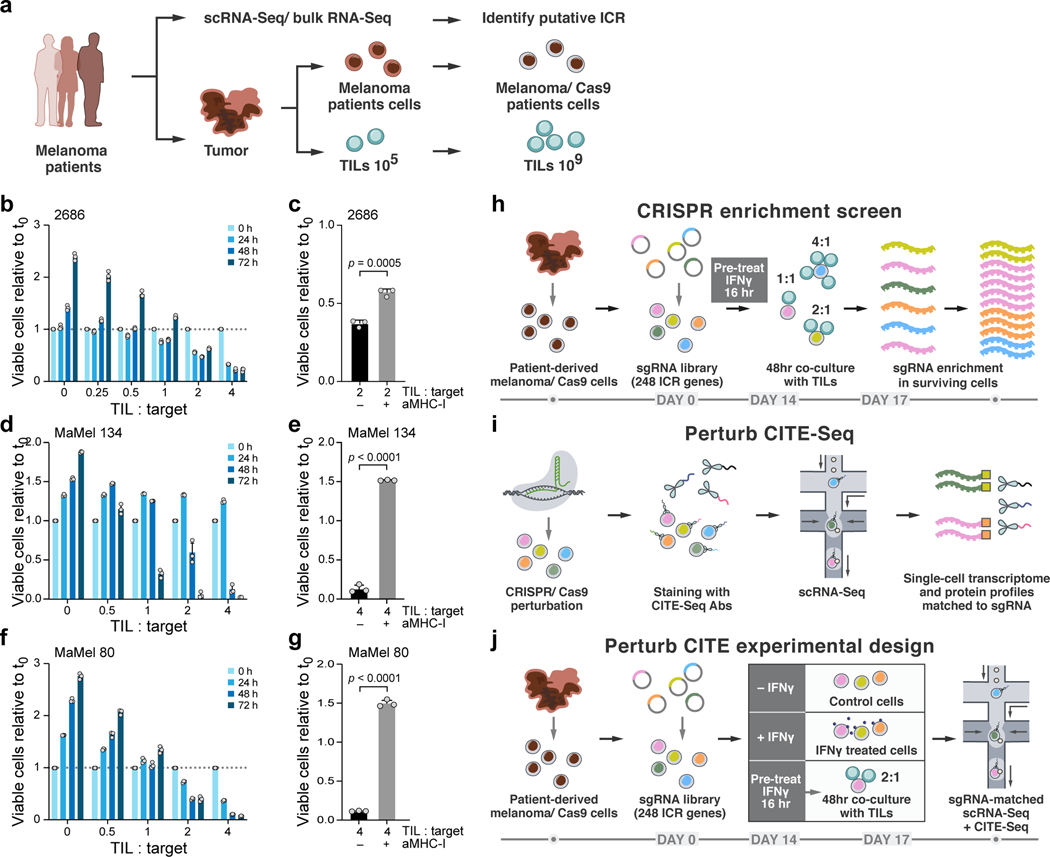
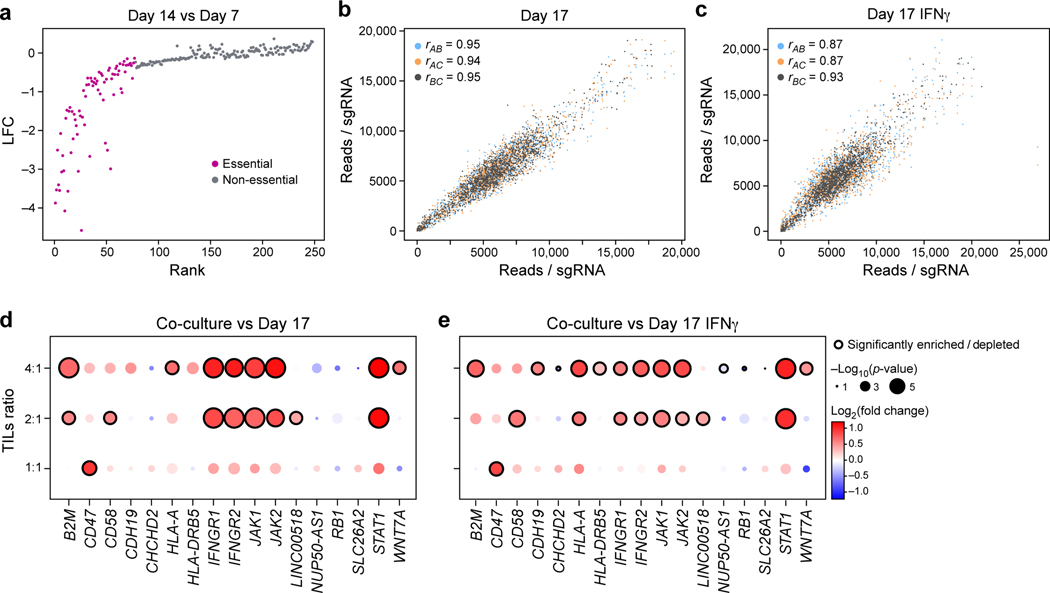
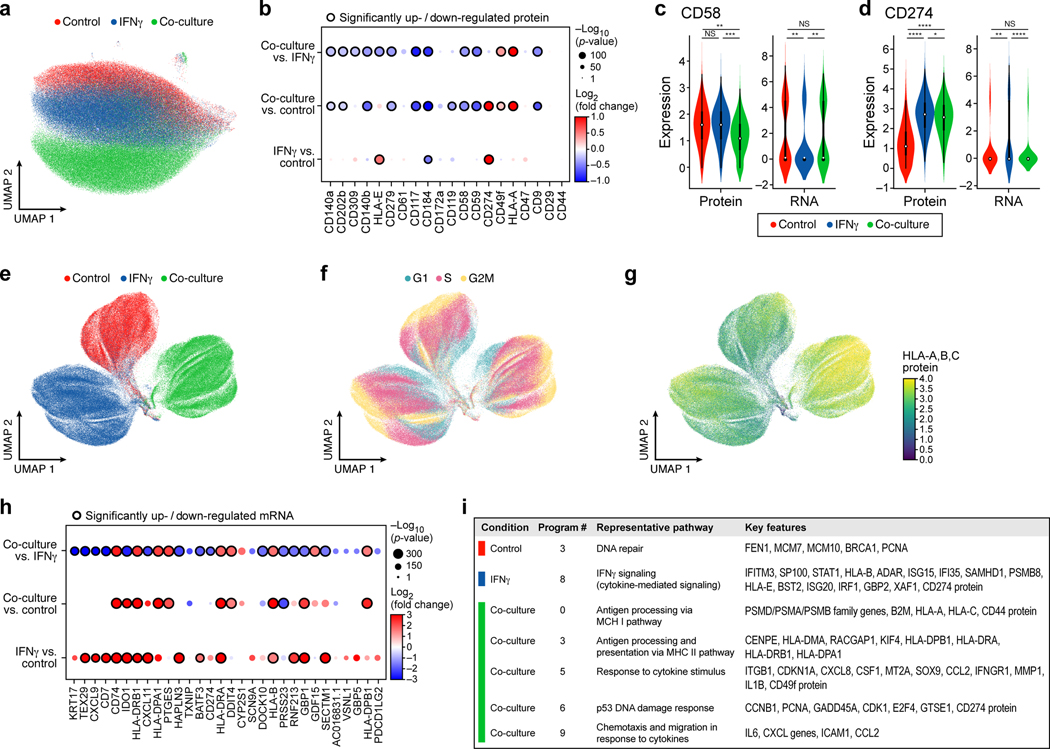
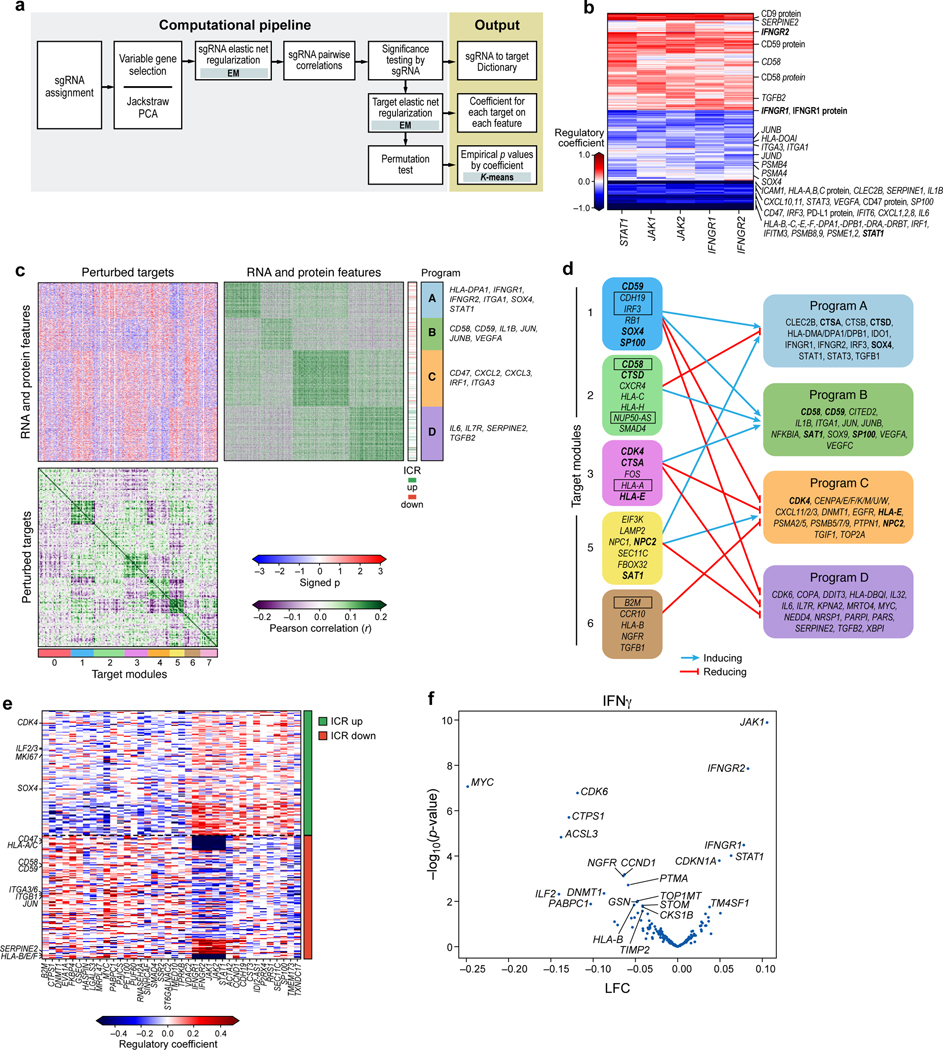
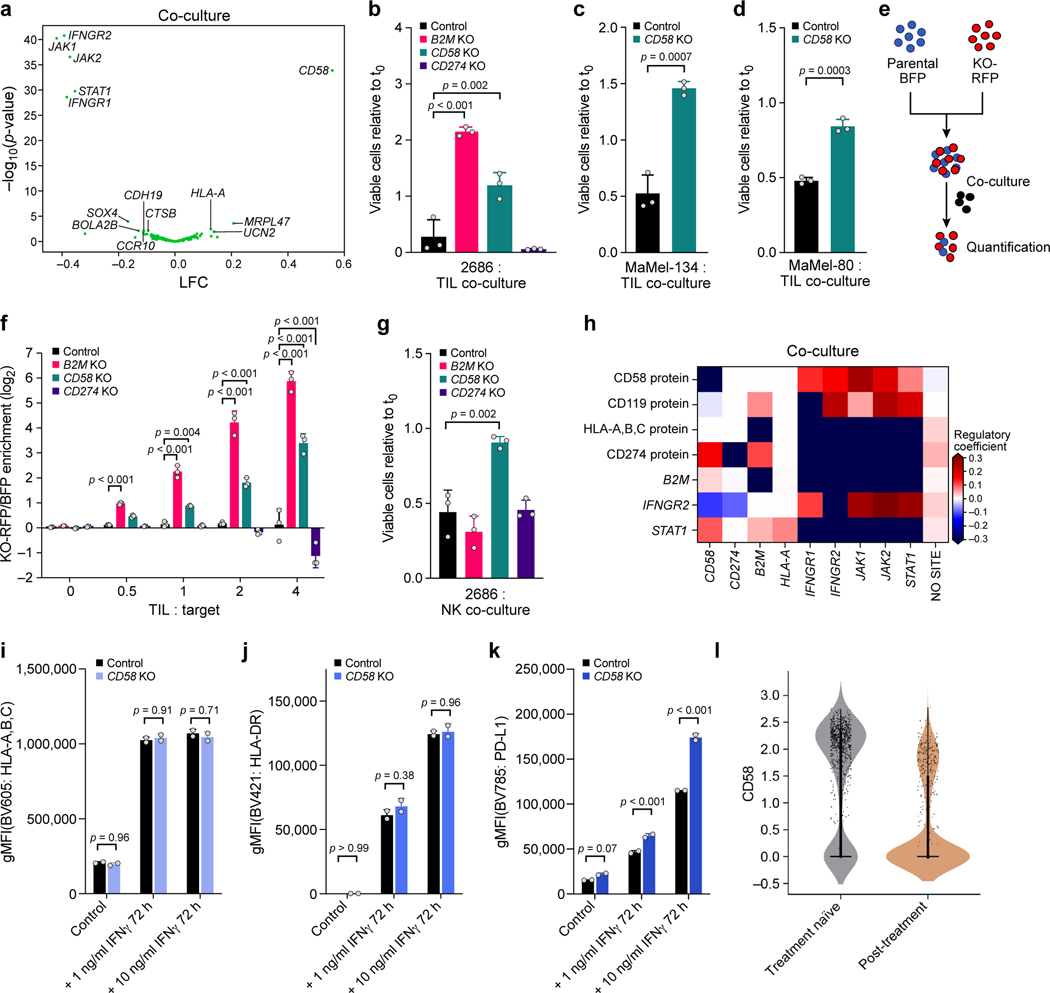
Resistance to immune checkpoint inhibitors (ICIs) is a key challenge in cancer therapy. To elucidate underlying mechanisms, we developed Perturb-CITE-sequencing (Perturb-CITE-seq), enabling pooled clustered regularly interspaced short palindromic repeat (CRISPR)-Cas9 perturbations with single-cell transcriptome and protein readouts. In patient-derived melanoma cells and autologous tumor-infiltrating lymphocyte (TIL) co-cultures, we profiled transcriptomes and 20 proteins in ~218,000 cells under ~750 perturbations associated with cancer cell-intrinsic ICI resistance (ICR). We recover known mechanisms of resistance, including defects in the interferon-γ (IFN-γ)-JAK/STAT and antigen-presentation pathways in RNA, protein and perturbation space, and new ones, including loss/downregulation of CD58. Loss of CD58 conferred immune evasion in multiple co-culture models and was downregulated in tumors of melanoma patients with ICR. CD58 protein expression was not induced by IFN-γ signaling, and CD58 loss conferred immune evasion without compromising major histocompatibility complex (MHC) expression, suggesting that it acts orthogonally to known mechanisms of ICR. This work provides a framework for the deciphering of complex mechanisms by large-scale perturbation screens with multimodal, single-cell readouts, and discovers potentially clinically relevant mechanisms of immune evasion.


Figures

Extended Data Fig. 1
Extended Data Fig. 1. Establishment of patient derived co-culture model.
a, Approach for imaging-based quantification of TIL-mediated killing of melanoma target cells. Plates were imaged at 0, 24, 48 and 72 hours, and viable cell counts were normalized to starting counts to quantify outgrowth of target cells. b-d, Sorting and gating strategy to isolate and expand TIL cultures prior to co-culture. b. TILs grown in IL2 or OKT3-stimulated for 72 hours and analyzed after 4 hours of PMA-I-stimulation. FMO, fluorescent-minus-one control b. TILs from 2686 retain ability to induce IFNγ and TNFa, and OKT-3 reactivation leads to an increase in Granzyme-B production compared to TILs grown in IL2 alone. c, MaMel-134 TILs produce IFNγ, TNFa, and Granzyme-B. d, MaMel-80 TILs produce IFNγ, TNFa, and Granzyme-B. e-h. Impact of time, dose, IFNγ pre-treatment, MHC-I blocking, and OKT3 on TIL-mediated killing in the co-culture system from patient 2686. Ratio of viable cancer cells (y axis, relative to t0) in co-cultures: (e) after different time points of co-culture at increasing TIL:cancer cell ratios (x axis), where TILs were restimulated with immobilized OKT3 for 72 h prior to co-culture; f, after 48 h of co-culture, where cancer cells were pre-treated with 1 ng/ml IFNγ for 16 hours (without prior OKT3-reactivation); g, after 48 hours of co-culture as in (f) but using OKT3-reactivated TILs. h, Specificity of IFNγ pre-treatment approach. Ratio of viable allogenic cancer cells (y axis, relative to t0) in different culture conditions with or without IFNγ pre-treatment (x axis) grown from 0 to 72 hours (color bars) with 2686 TILs with or without prior reactivation with OKT3. For e-h, we performed a one-way ANOVA with Tukey post hoc test. Error bars: Mean±SD. All experiments were performed in triplicates in each of at least two independent experiments.
Extended Data Fig. 2
Extended Data Fig. 2. Generation of Cas9 transgenic patient derived lines and sgDNA library titration.
a, High Cas9 activity in Cas9 transgenic line. Flow cytometry of EGFP levels in Cas9-expressing and parental melanoma cells from patient 2686 transduced with lentivirus encoding EGFP and an EGFP targeting sgRNA at MOI <1 and selected using puromycin. b-d, Transduction of sgDNA lentiviral library to Cas9 transgenic line. b, Proportion of mKATE2+ cells prior to selection (x axis) and survival after puromycin selection (y axis) in 2686 melanoma Cas9 transgenic cells transduced with the ICR library. Line: Linear regression, Pearson R2=0.90. c, Percentage of mKate2+ cells (y axis) in 2686 melanoma Cas9 transgenic cells transduced with the ICR library at virus dilutions (x axis). Red: Dilution used for the Perturb-CITE-seq screen. d. Proportion of cells estimated to be infected by one virus (y axis) at different dilutions of the ICR library (x axis). Red: Dilution used for the Perturb-CITE-seq screen.
Extended Data Fig. 3
Extended Data Fig. 3. CRISPR/Cas9 viability screen in the co-culture system.
a, Dose-response killing in the co-culture experiment validates target killing range. Percent of surviving cells relative to IFNγ pretreated target cells (y axis) in different co-culture conditions (x axis) from a plate run in parallel to the viability and Perturb-CITE screens, with triplicate wells for each condition. One-way ANOVA with Dunnet post-hoc test. Error bars: Mean±SD. b,c, Screen reproducibility across triplicates. Number of reads detected (x, y axis) for each sgDNA (dots) when comparing each pair within triplicate experiments (color legend) in pre-treated day 7 (b) or day 14 (c). Pearson correlation coefficients are noted in the color legend. d-f, Identification of essential genes and genes affecting resistance to TIL mediated killing. Relative depletion (log2(FC), x axis) for each individual sgDNA (red bar) of the top20 target genes by MAGeCK analysis (rows) (n = 3 sgDNAs/target gene, Methods) on day 7 (without TILs, to recover essential genes, d), day 17 of 2:1 TIL:cancer cells co-cultures, comparing control cells (e), or day 17 of IFNγ treated cells (f, no co-culture). Bold lettering indicates significantly enriched / depleted target.
Extended Data Fig. 4
Extended Data Fig. 4. Characterization of different immune pressures by single-cell RNA and protein profiles.
a,b, Removal of profiled T cells. a. UMAP embedding of single cell RNA-Seq profiles from the Perturb-CITE-seq screen, colored by unsupervised cluster assignment34 (Methods). b, A permutation test was used to score marker genes associated with each cluster shown in (a)35. Score (y axis, permutation test, Methods) of marker genes (x axis) associated with the distinct cluster marked by an arrow in (a), include canonical T cell markers. c, Cell complexity affects scRNA-Seq profiles. UMAP embedding of scRNA-Seq profiles of cancer cells only, colored by UMI count bins. d,e, CITE profiles of 20 cell surface proteins do not reflect cell cycle phases (d) or UMI count (e). UMAP embedding of cells (dots) by CITE-seq profiles (dots) colored by cell cycle phase, as scored from scRNA-Seq of the cells, and (e) UMAP of cells by count bins (indicated in legend). f-h, Limited relation between the cell cycle and immune pressure or phenotype. UMAP embedding of cells (dots) based only on RNA expression on cell cycle genes colored by (f) cell cycle phase based on the cell’s RNA profile; (g) MHC protein levels from the CITE signal of the cell; or (h) condition.
Extended Data Fig. 5
Extended Data Fig. 5. Learning expression programs in different conditions.
a-f, Identification of programs by jackstraw PCA in each condition. a-c. Explained variance (y axis) by each principal component (x axis) for PCA performed on control (a), IFNγ-treated (b), or co-culture (c) Perturb-CITE-seq data. d-f, Number of features (y axis) for each jackstraw program (x axis) for models learned on control (a), IFNγ-treated (b), or co-culture (c) Perturb-CITE-seq data. Dotted red line: cutoff for programs considered in further analysis. g, G2M program learned from control dataset. UMAP embedding of cells (dots) by scRNA-seq profiles, with cells colored by the gene set score (color bar) (Methods) of a G2M cell cycle control program (compare to Fig. 3f) (Methods). h, Identifying related programs across conditions. Jaccard index (color bar) for each pair of programs across all 30 programs (rows).
Extended Data Fig. 6
Extended Data Fig. 6. Addressing cell cycle and complexity covariates by the Perturb-CITE-seq model and impact of targeting vs. non-targeting guides.
a, Estimated Multiplicity of infection (MOI). Distribution of cells (%, y axis) at different estimated MOI (x axis) in each experimental condition (color legend) as determined from the guide dictionary (Methods). b,c, Improved model fit following accounting for cell state as a covariate. Pearson correlation (color bar) between the residuals from the linear model fit for each regulated feature (columns) from models learned without (b) or with (c) cell state covariates accounting for the cell cycle and cell complexity.
Extended Data Fig. 7
Extended Data Fig. 7. Role of CD58 in resistance to T cell mediated killing and regulation of PD-L1.
a, Validation of CRISPR/Cas9 KO (and unperturbed control) melanoma cells. a, Distribution of fluorescent intensity of CD58 (APC-CD58), B2M (APC-B2M), MHC-I (FITC-HLA-A,B,C), PD-L1 (APC-CD274) or staining with isotype control, without or with IFNg stimulation, in 2686 melanoma cells. b, Validation of CD58 KO MaMel-134, and c, MaMel-80 melanoma cells. d, Comparable growth of control and KO cells. Ratio of viable cells relative to timepoint 0 (y axis) for control and B2M KO, CD58 KO or CD274 KO melanoma cells from patient 2686 (x axis). e, Comparable induction of apoptosis in response to Staurosporin and resistance to DTIC in control and KO melanoma cells. Percent of cells inducing Caspase 3/7 (y axis) in control and B2M KO, CD58 KO or CD274 KO melanoma cells (color code) from patient 2686 in different treatment conditions (x axis). f, Co-culture experiments of three melanoma cells lines (2686, MaMel134 and MaMel80) at increasing ratios of NK cells and tumor cells with different genotypes (including CD58 KO, B2M KO in all models, and additionally CD274 KO in 2686). g-j, CD58 perturbation in co-culture does not affect B2M and HLA expression at the RNA and protein level but induces CD274. Distribution of fluorescent intensity by flow cytometry (corresponding to Fig. 5i-k) of MHC Class I and II, CD58, and PD-L1 in parental (control) and CD58 KO lines at baseline (g) and after 72 hours of stimulation with either 1 ng IFNγ (h) or 10 ng IFNγ (i), and summary of the impact of IFNγ on CD58 protein abundance after 72 hours. In all experiments, we used a one-way ANOVA with Tukey post hoc test. Error bars: Mean ±SD. All experiments were performed in triplicates in each of at least two independent experiments.
Extended Data Fig. 8
Extended Data Fig. 8. Known mechanisms of immune evasion and distinct role of CD58.
a, Schematic representation of interactions between T cell and cancer cells. At baseline, TCR stimulation via peptide-loaded MHC Class I and through CD58:CD2 co-stimulation results in production of cytokines (such as IFNγ, Granzymes), which lead to activation of the IFNγ-JAK/STAT-pathway that determine the cell fate and expression of surface proteins. b, In the absence of antigen presentation, either due to genetic defects or downregulation of the antigen presentation machinery, cancer cells survive. c, Defects in the JAK/STAT-pathway (such as deleterious mutations in JAK genes) result in poor response of cancer cells to T cell secreted IFNγ and promote cancer cell survival. d, Loss or downregulation of CD58 does not interfere with antigen presentation or JAK/STAT-signaling per se, but reduces T cell co-stimulation while simultaneously promoting increased co-inhibitory signaling via PD-L1, and therefore overall confers resistance to T cell mediated killing.
Figure 1.
Figure 1.. Perturb-CITE-Seq to study tumor intrinsic mechanisms of T cell resistance using patient derived co-culture models
a. Patient derived cell models and programs. Resected melanomas (left) were profiled by bulk and scRNA-seq (top) to identify an immune resistance program (ICR). Melanoma (brown, middle) and tumor infiltrating lymphocytes (TILs, blue, bottom) cells were grown from patients’ tumors; melanoma cells were transduced to express Cas9 and TILs were expanded to yield sufficient numbers for screening (Methods). b-g. Optimization and validation of co-culture system for TIL mediated killing of melanoma cells. b,d,f. Time and dose-dependent killing of melanoma target cells by autologous TILs in three patient derived co-culture models. Ratio of viable cancer cells (y axis, relative to t0) at different TIL : cancer cell ratios (x axis) at different time points (color legend) after pre-treatment of target cells with 1 ng/ml IFNγ for 16 hours using TILs without prior restimulation in each patient-derived co-culture model (panels). Experiment was performed in triplicates in each of two independent experiments. c,e,g. Target cell killing depends on MHC-I. Ratio of viable cancer cells (y axis, relative to t0) after 48 hours in a 4:1 TIL and cancer cell co-culture with cancer cells pre-treated with 1ng/ml IFNγ for 16 hours and TILs without prior restimulation, in the absence or presence of MHC-I blocking antibodies (x axis). Two-sided t-test. Error bars: Mean ±SD. Experiment was performed in triplicates in each of two independent experiments. h. Viability screen design. i. Perturb-CITE-Seq approach. j. Perturb-CITE-Seq screens to characterize regulators of melanoma immune evasion.
Figure 2.
Figure 2.. Identification of genes for evasion of TIL-mediated killing by CRISPR/Cas9 viability screen in patient-derived models exposed to increasing immune pressures
a, Identification of essential gene unrelated to immune pressure. Change in abundance (negative log2 fold-change (LFC), y axis) of each sgDNA (dot) in day 14 vs. day 7 following lentivirus transduction, with guides ranked (x axis) by LFC value. Pink: called essential genes (Methods). b,c, High reproducibility of screen across triplicates. Number of reads detected (x, y axis) for each sgDNA (dots) when comparing each pair within triplicate experiments (color legend) in either control cells (b) and in IFNγ treated cells (c) on day 17. Pearson (r) correlation coefficients are noted in the color legend. (d,e) Co-culture screen highlights role for IFN γ/Jak-STAT pathway and additional mechanisms. Log2(Fold Change) (dot color) and significance (-log10(p-value), dot dize (and significantly enriched/depleted cirled with black border), Methods) of genes (columns) whose sgDNA in tumor cells co-cultured with different doses of TILs (rows) was differentially enriched compared to control cells on Day 17 (d) or IFNγ-treated cells on day 17 (e).
Figure 3.
Figure 3.. Single-cell protein and RNA profiles reveal regulation of genes and program involved in immune evasion.
a,b. Distinct protein profiles across immune pressures highlight regulation of cell surface proteins whose genetic perturbation confers resistance to TIL mediated killing. a. Uniform Manifold Approximation and Projection (UMAP) embedding of single cell CITE-antibody count profiles (dots) colored by condition (color legend). b. Log2(Fold Change) (dot color) and significance (-log10(p-value)), dot size (and statistically significantly up/downregulated circled with black border), logistic regression model; Methods) between each pair of conditions (rows) of each cell surface protein (columns) measured by CITE-Seq. c,d. Regulation of CD58 and CD274 (PDL1) by culture conditions. Distribution of protein counts (y axis, left) or RNA (normalized expression, Methods) (y axis, right) for CD58 (c) and CD274 (d). **** P < 1−10, Welch’s t test. Middle dot: median; box edges: 25th and 75th percentiles; whiskers: most extreme points that do not exceed ± 1.5 times interquartile range (IQR). Shading denotes a kernel density estimate with a bandwidth of 0.4. e-g. Variation in RNA profiles across and within conditions captures cell cycle state and MHC-I protein expression. UMAP embedding of scRNA-seq profiles (dots) colored by condition (e), cell cycle phase signature (f), or MHC (HLA-A,B,C) expression level (g, color bar). h,i. RNA expression of key immune genes and programs is impacted by increased immune pressure. h. Log2(Fold Change) (dot color) and significance (-log10(p-value)), dot size (and statistically significantly up/downregulated circled with black border) between each pair of conditions (rows) of the RNA of select immune genes (columns) measured by scRNA-seq, and differentially expressed between conditions. i. Gene programs identified by jackstraw PCA in each condition, representative enriched Gene Ontology processes, and select member genes.
Figure 4.
Figure 4.. Perturb-CITE-Seq reveals co-functional modules that are dependent- or independent of a predominant IFNg/JAK-STAT mechanism
a. Overview of computational approach (Methods). b. Perturbations in JAK/STAT pathway affect known and putative mechanisms of immune evasion. Regulatory effect ( values) on RNA and protein features (rows) when perturbing different genes in the JAK-STAT pathway (columns). c,d. Co-functional modules and co-regulated programs in the Perturb-CITE-Seq screen. c. Middle heatmap: Signed significance (−log10(Empirical p) * sign(²), red/blue color bar) for the effect on each RNA/protein feature (rows) of perturbing each gene (columns, excluding JAK-STAT targets) in the co-culture condition. Right and bottom matrices: Pearson correlation coefficient (purple/green color bar) between the significance profiles of either gene/protein features (right matrix) or perturbed genes (bottom matrix). Co-functional modules (bottom bar) and co-regulated programs (right bar) are identified by K-means clustering of each of the bottom and right matrices separately (k=4 and 8, respectively), and the clustering defines the row and column order. d. Representation of the regulatory connections between select modules (left) and programs (right) from c. Bold font: select regulators that are also members of programs. Boxed font: selected regulators significantly enriched/depleted in the viability screen (Fig. 2d,e). Notably, the edges in d are opposite the sign of the empirical p value in c: a target module connected to a co-regulated program with negative signed p values in c activates the corresponding program in d. e,f. The ICR program is coherently regulated by the perturbed regulators. e. Regulatory effect ( values) on RNA/protein features from the ICR program (rows, ICR as defined in Ref. 9) by perturbations of different genes in the screen (columns), clustered by K-means clustering (K=2). f. Change in ICR signature scores and its associated significance (y axis, -log10(P-value), Welch’s t test) for each perturbation (dot) in the IFN condition (Methods). Key perturbations with significant effects are noted.
Figure 5.
Figure 5.. CD58 loss is a distinct mechanism of immune evasion from TIL and NK-cell mediated killing
a.CD58 perturbation affects a distinct regulatory program. Change in signature scores of the CD58 regulatory program (x axis, LFC) and its associated significance (y axis, -log10(P-value), Welch’s t test) for each perturbation in the co-culture. b-d. Ratio of viable cancer cells (y axis, relative to t0) in co-culture models of control, CD58 KO, B2M KO and CD274 KO cells. e. Competition assay schematic. BFP-labeled parental cells and RFP-labeled KO cells are co-cultured with TILs and the RFP/BFP ratio is calculated as an estimate of relative fitness. f. Competition assay of parental cells and matched B2M KO, CD58 KO or CD274 KO after 48 hours of co-culture. g. Ratio of viable cancer cells in an NK co-culture model of parental cells compared to matched indicated genotypes. h-k. CD58 perturbation in co-culture does not affect B2M and HLA expression at the RNA and protein level but induces CD274. h. Regulatory effect ( values from the model shown in a; red/blue: perturbation induces/represses gene feature) in Perturb-CITE-Seq on key RNA and protein (CITE) features (rows) when perturbing different genes in the JAK-STAT pathway, CD58 or CD274 (columns). i-k. Surface expression of MHC class-I (i), MHC class-II (j) or CD274 (k) at baseline and after stimulation with different levels of IFNγ for 72 hours, in parental and CD58 KO cells. l. Distribution of expression levels (y axis, log2(TPM+1)) of CD58 RNA in melanoma cells from tumors in patients who were either treatment naïve (gray) or were resected after failure of immunotherapy (tan) in the scRNA-seq data from the ICR-signature discovery cohort. One-way ANOVA with Tukey post hoc test in b, f, g, two-sided t test in c,d, and i-k. Error bars: Mean ±SD. All experiments were performed in triplicates (except i-k in duplicates) in each of at least two independent experiments.

References

    1. Dixit A. et al.Perturb-Seq: Dissecting Molecular Circuits with Scalable Single-Cell RNA Profiling of Pooled Genetic Screens. Cell 167, 1853–1866.e17 (2016). - PMC - PubMed
    1. Adamson B. et al.A Multiplexed Single-Cell CRISPR Screening Platform Enables Systematic Dissection of the Unfolded Protein Response. Cell 167, 1867–1882.e21 (2016). - PMC - PubMed
    1. Datlinger P. et al.Pooled CRISPR screening with single-cell transcriptome readout. Nat. Methods 14, 297–301 (2017). - PMC - PubMed
    1. Jaitin DA et al.Dissecting Immune Circuits by Linking CRISPR-Pooled Screens with Single-Cell RNA-Seq. Cell 167, 1883–1896.e15 (2016). - PubMed
    1. Mimitou EP et al.Multiplexed detection of proteins, transcriptomes, clonotypes and CRISPR perturbations in single cells. Nat. Methods 16, 409–412 (2019). - PMC - PubMed

Publication types

MeSH terms