. 2021 Mar;53(3):322-331.
doi: 10.1038/s41588-021-00778-2. Epub 2021 Mar 1.

Characterizing the molecular regulation of inhibitory immune checkpoints with multimodal single-cell screens

Affiliations

Characterizing the molecular regulation of inhibitory immune checkpoints with multimodal single-cell screens

Efthymia Papalexi et al. Nat Genet. 2021 Mar.

Abstract

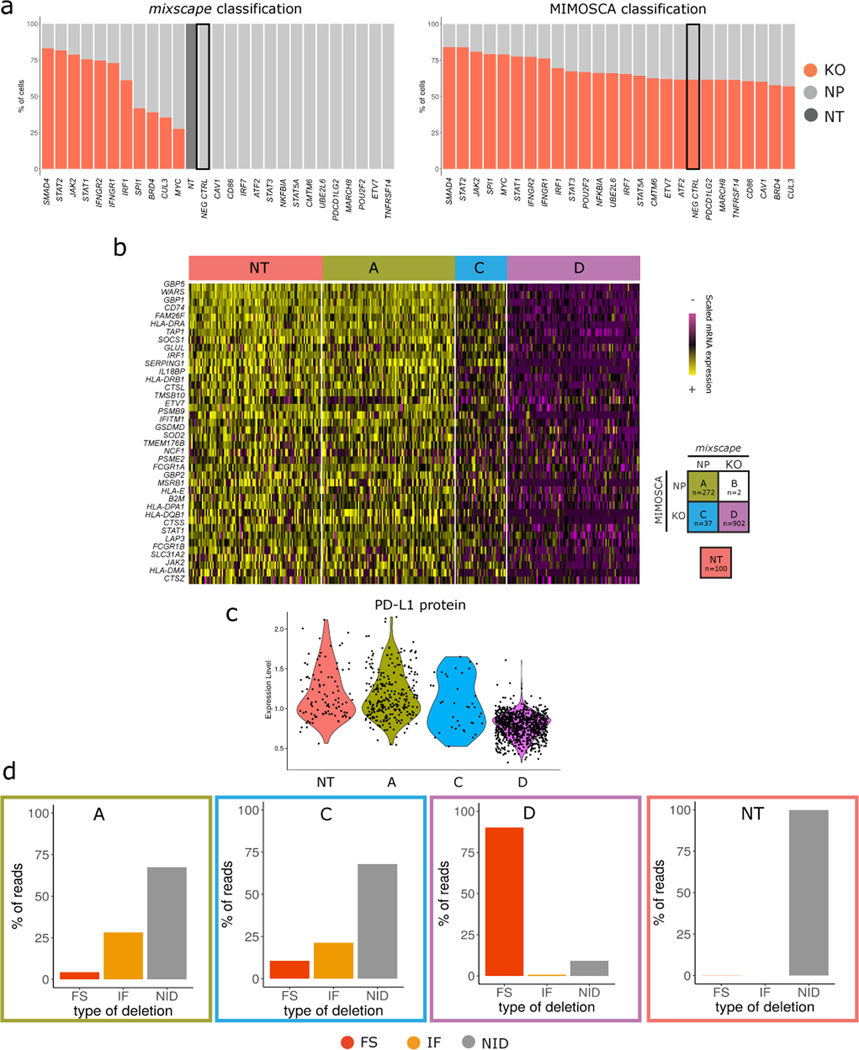
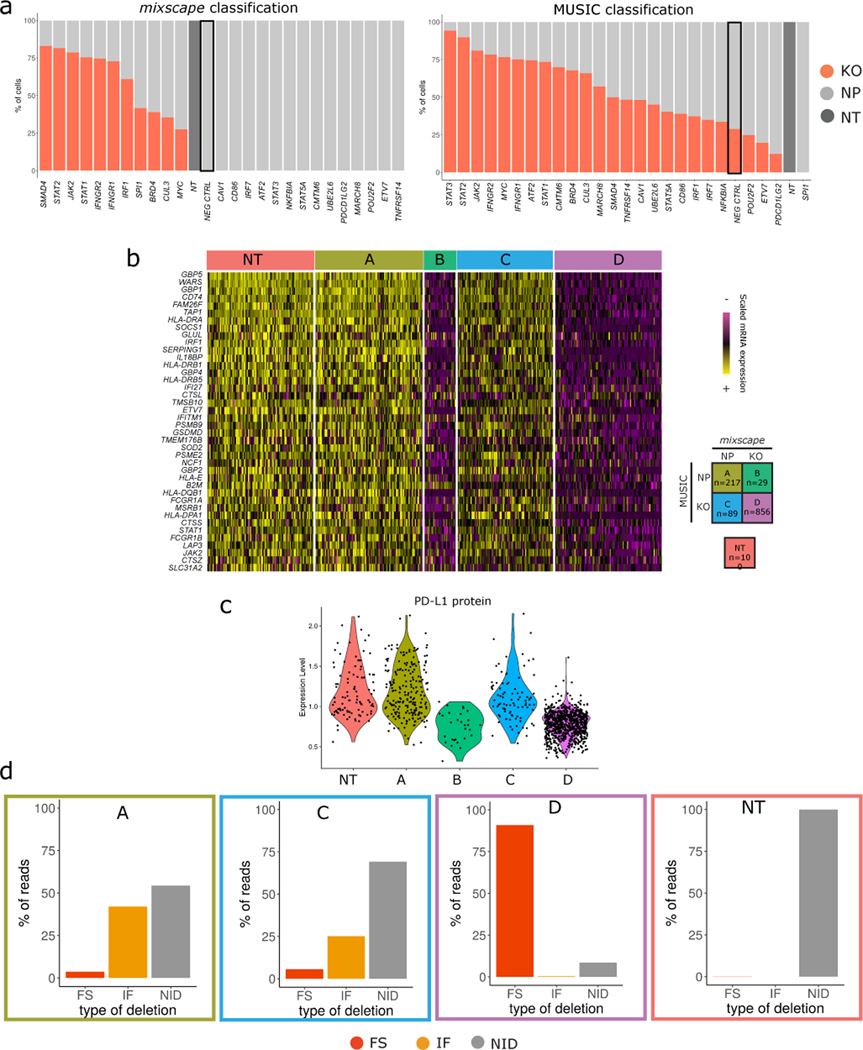
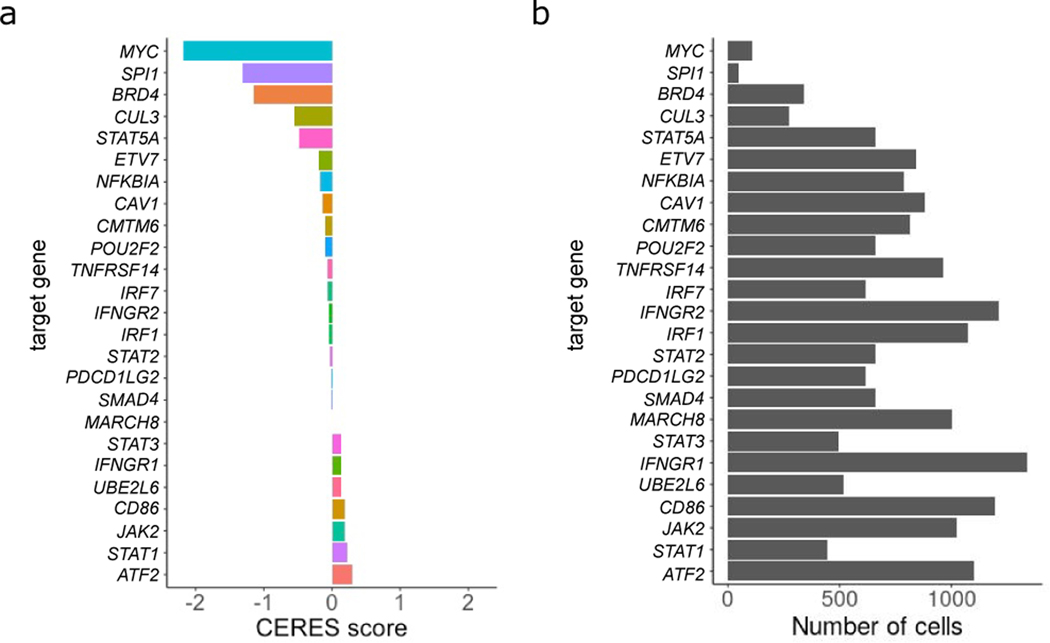
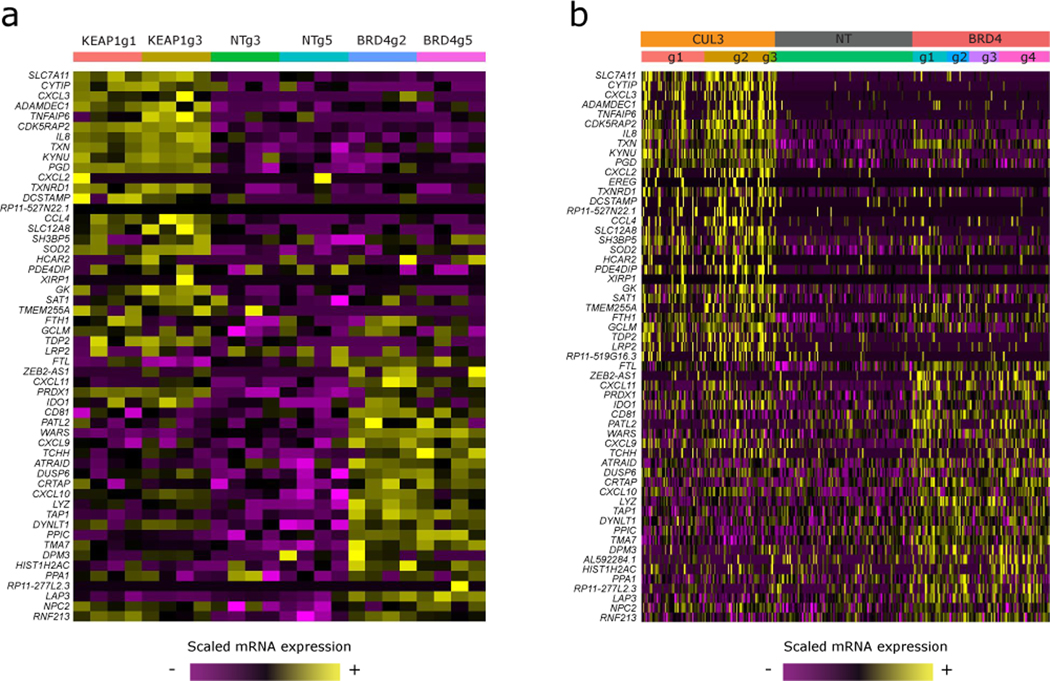
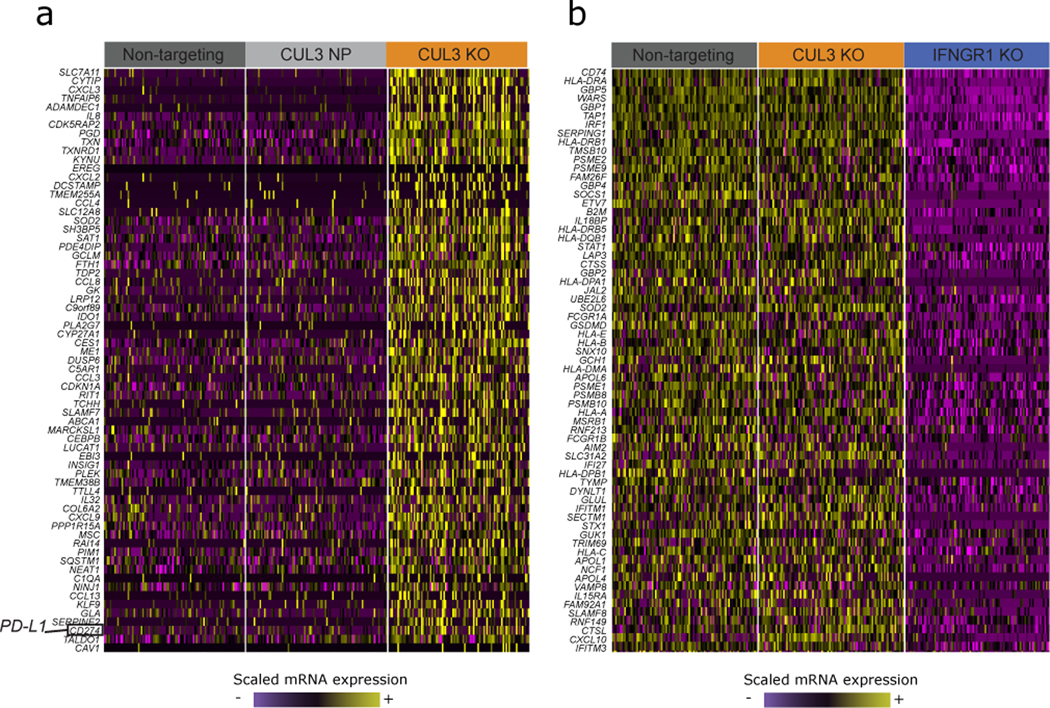
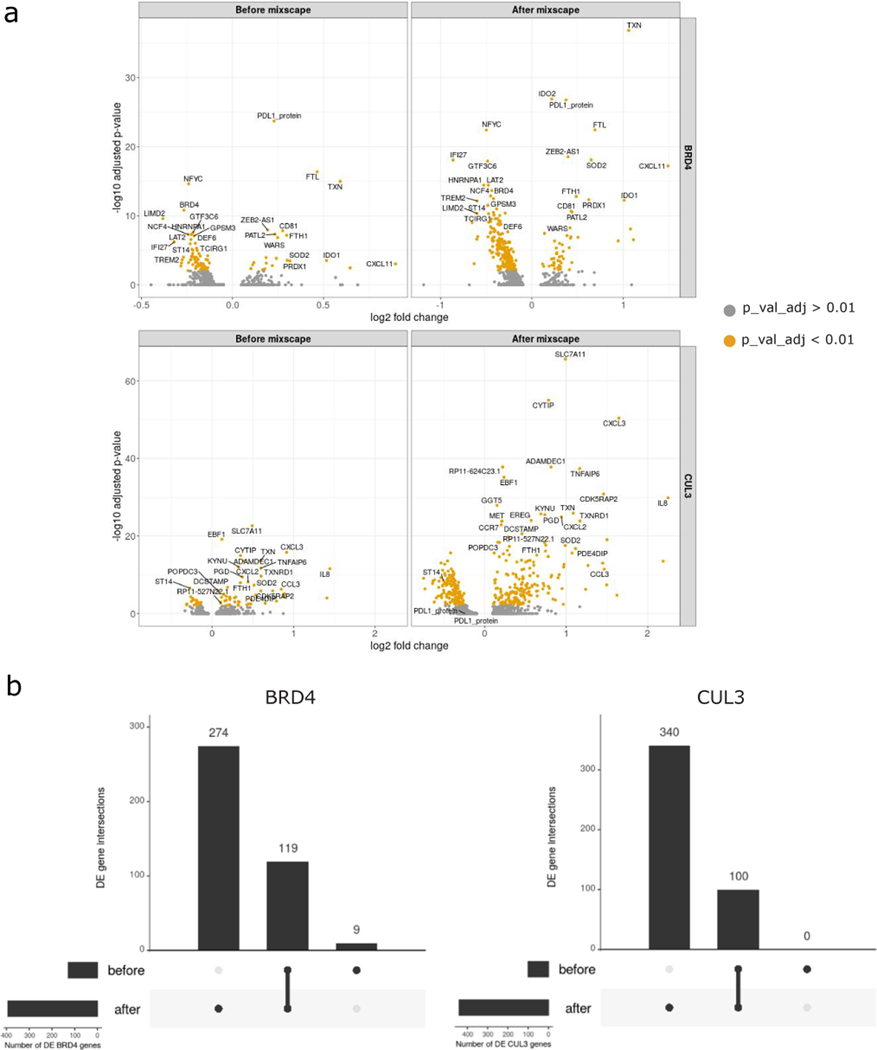
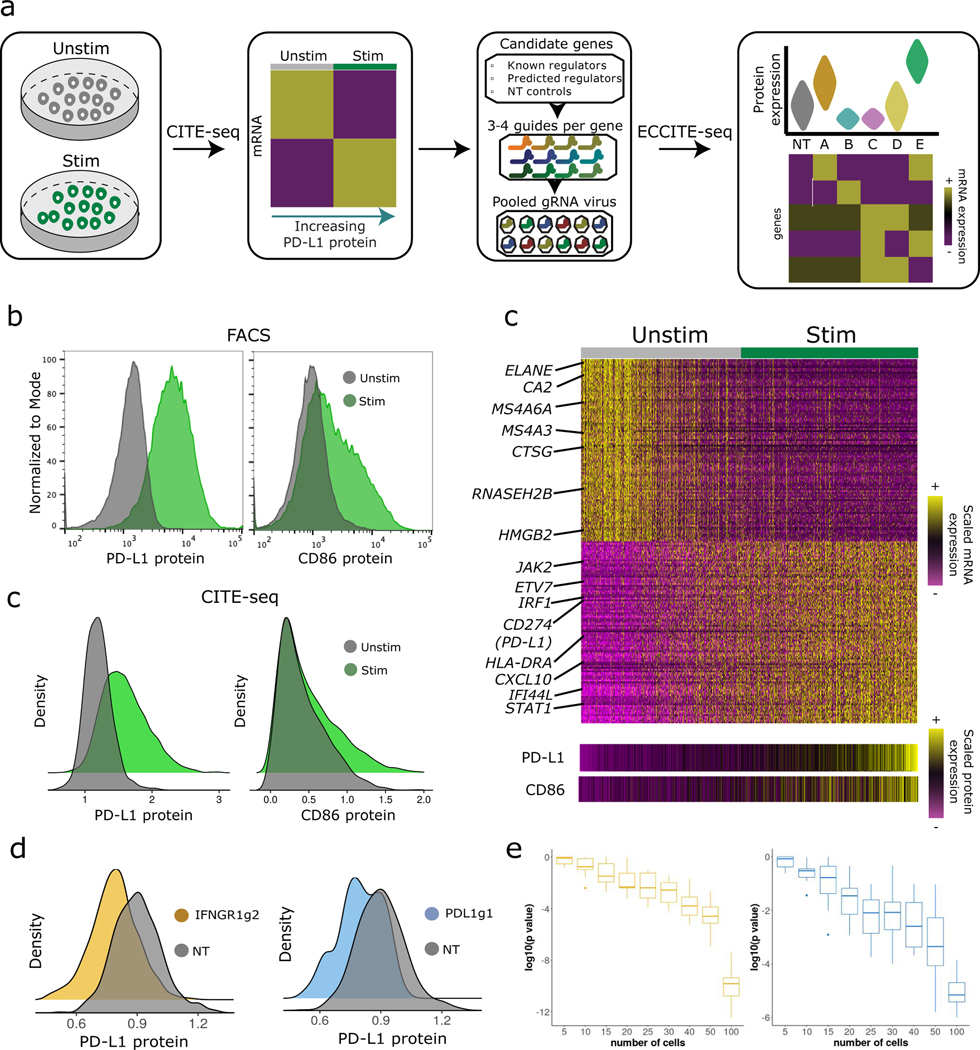
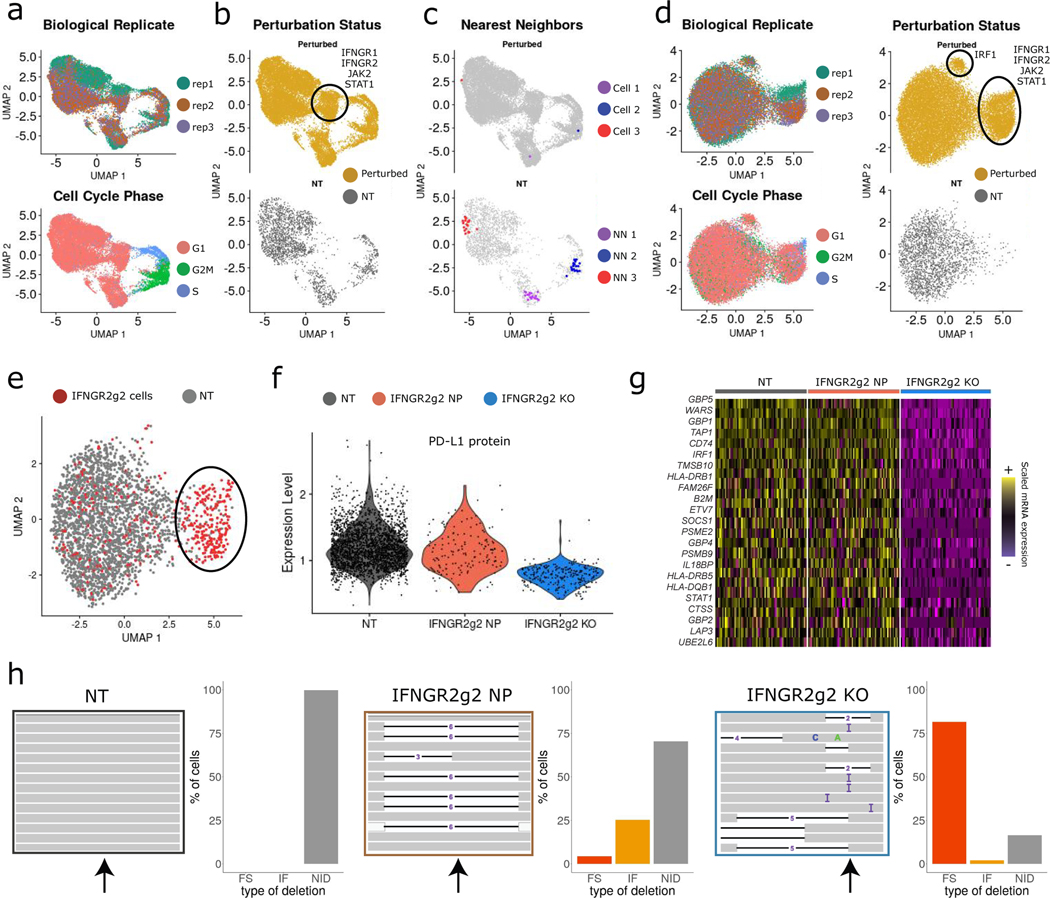
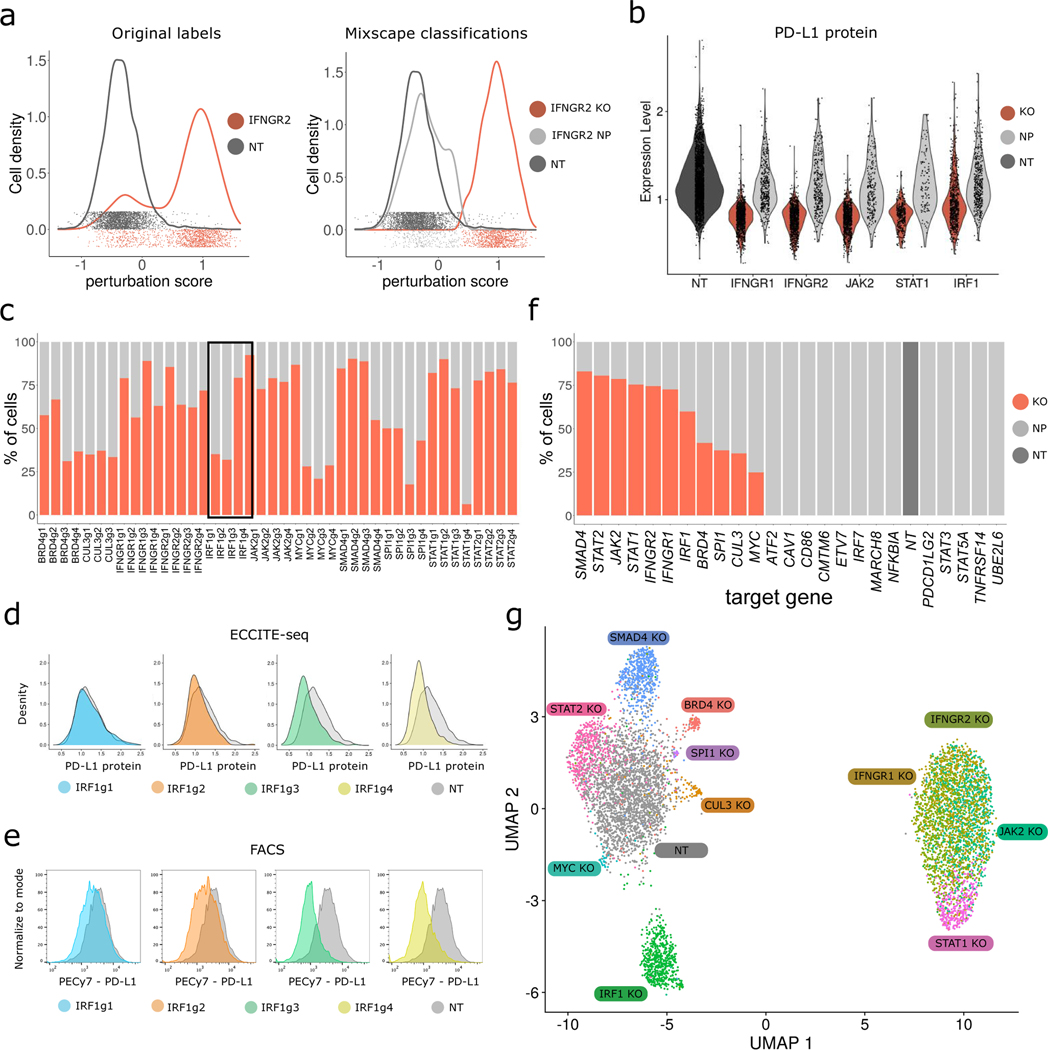
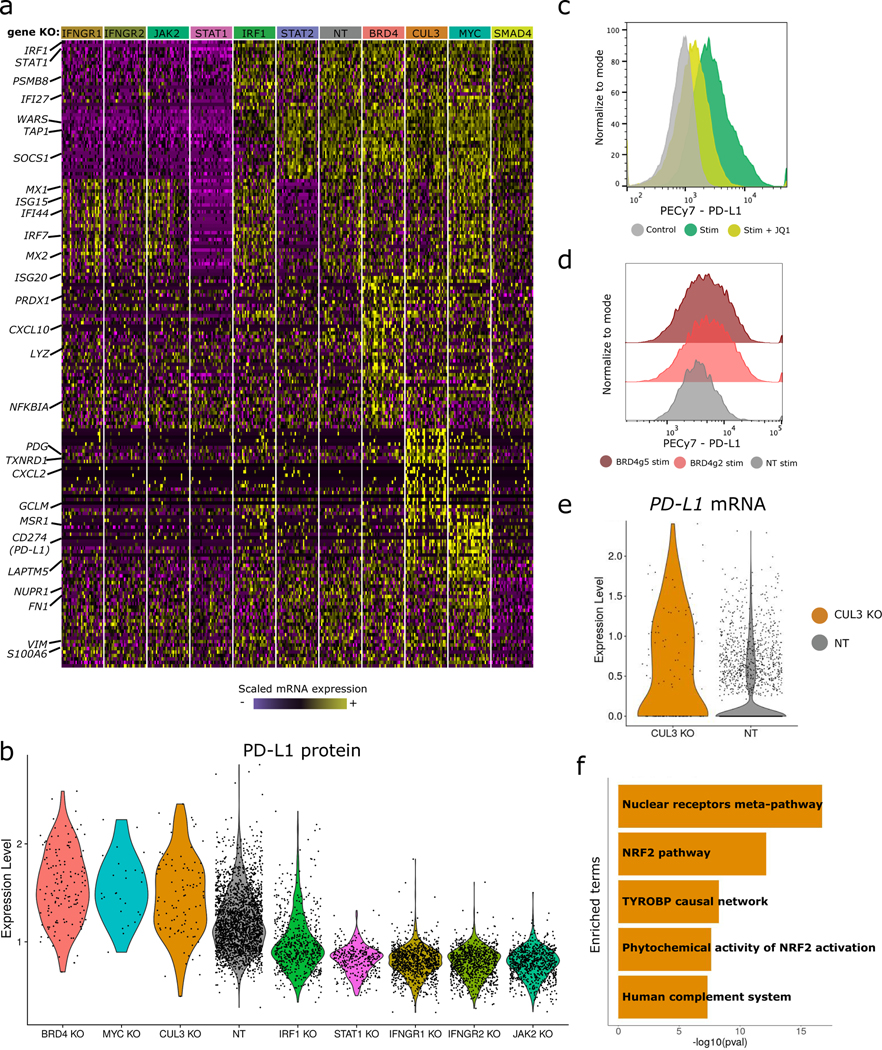
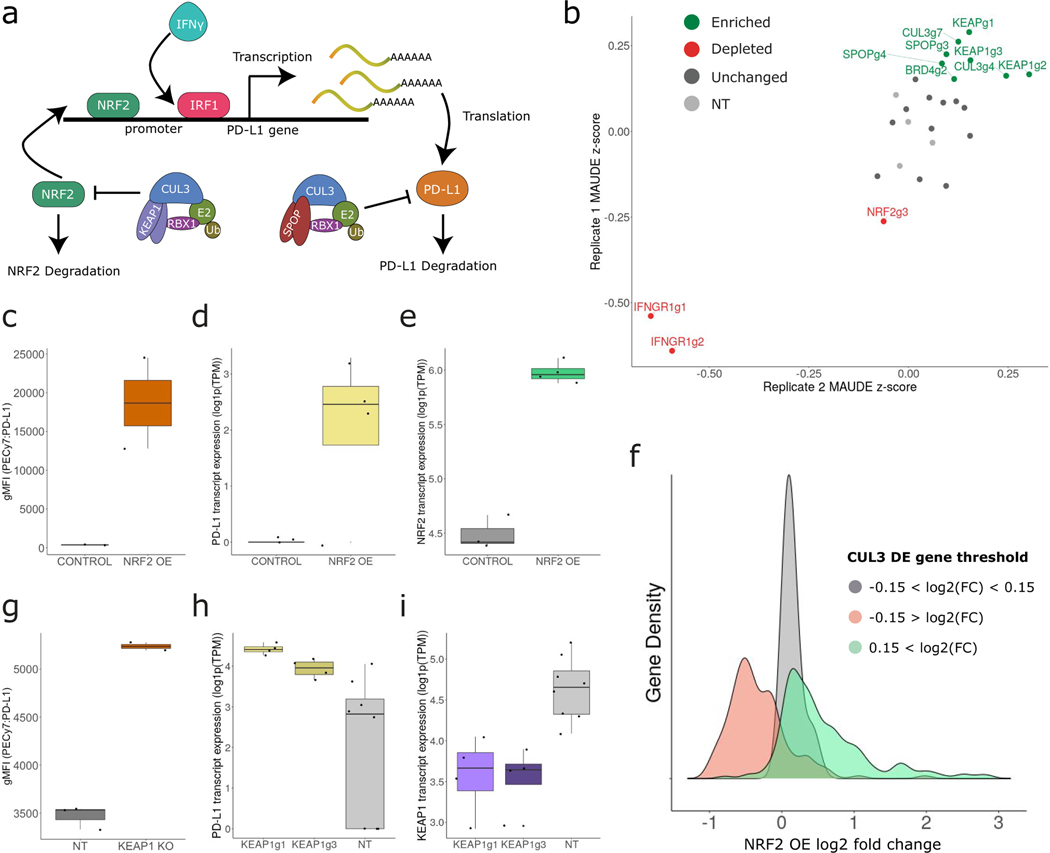
The expression of inhibitory immune checkpoint molecules, such as programmed death-ligand (PD-L)1, is frequently observed in human cancers and can lead to the suppression of T cell-mediated immune responses. Here, we apply expanded CRISPR-compatible (EC)CITE-seq, a technology that combines pooled CRISPR screens with single-cell mRNA and surface protein measurements, to explore the molecular networks that regulate PD-L1 expression. We also develop a computational framework, mixscape, that substantially improves the signal-to-noise ratio in single-cell perturbation screens by identifying and removing confounding sources of variation. Applying these tools, we identify and validate regulators of PD-L1 and leverage our multimodal data to identify both transcriptional and post-transcriptional modes of regulation. Specifically, we discover that the Kelch-like protein KEAP1 and the transcriptional activator NRF2 mediate the upregulation of PD-L1 after interferon (IFN)-γ stimulation. Our results identify a new mechanism for the regulation of immune checkpoints and present a powerful analytical framework for the analysis of multimodal single-cell perturbation screens.


Figures

Extended Data Fig. 1
Extended Data Fig. 1. Unwanted sources of variation drive mRNA-based clustering (related to Figure 2).
(A) UMAP visualization of the ECCITE-seq dataset based on cellular transcriptomes. Clusters are driven by different sources of variation shown in different colors (cell cycle state, CRISPR perturbation, stress). Figure is similar to Figure 2A, but with labels for the ER-stress cluster. (B) Single-cell heatmap showing the up-regulation of a specific gene module in the ER-stress cluster. EnrichR analysis demonstrates that this gene set is enriched (adjusted p-value < 5*10−20) for ‘response to endoplasmic reticulum stress”. (C) Similar to (A) but computed using only NT cells. This demonstrates that confounding sources of heterogeneity are present even in the absence of perturbation
Extended Data Fig. 2
Extended Data Fig. 2. Identifying optimal parameters for calculating perturbation signature.
(A)Scatterplots showing the per cell correlation of mixscape classification posterior probabilities between k =20 and k=3, k=10, k=30 and k=200. (B) Mixscape classification agreement k=20 and all other k. (C)Same as in (A) only this time comparing finding neighbors before and after integration. In both cases k was set to 20. (D)Same as in (B) only this time showing classification agreement between before and after integration.
Extended Data Fig. 3
Extended Data Fig. 3. Calculating local perturbation signatures controls for unwanted sources of variation.
Similar to Figure 2D, but the cells from each individual perturbation are specifically highlighted. In addition to some perturbations which form specific clusters (e.g. IRF1), other perturbations (e.g. BRD4 and SMAD4) exhibit weaker evidence of sub-clustering, suggesting that improved analysis strategies would help to reveal their perturbation state.
Extended Data Fig. 4
Extended Data Fig. 4. Mixscape models targeted cells as a heterogeneous mixture.
For each cell, we calculated a perturbation score (Supplementary Methods) representing its strength of perturbation compared to the average of NT controls. We calculated this not only for targeted cells, but also for cells expressing NT gRNA in order to estimate the variance in the control population. Here, we show the distribution of perturbation scores as a function of mixscape classification (similar to Figure 3A). Dots on the x-axis represent single-cell perturbation scores and are colored to match the mixscape classifications. Non-perturbed cell densities (NP, light grey) overlap with the non-targeting control cell densities (NT, dark grey).
Extended Data Fig. 5
Extended Data Fig. 5. Benchmarking mixscape against MIMOSCA.
(A) Top: Barplots showing the % of KO (red) and NP (light grey) cells within each gRNA class as classified by mixscape, and MIMOSCA (Bottom). To assess the potential for overfitting, prior to running the dataset, we randomly sampled 1,000 cells expressing NT gRNA and re-labeled them as a new targeted gene class, representing a negative control (NEG CTRL, marked with a black box). Only mixscape correctly classifies all of these cells as NP. (B) Single-cell mRNA expression heatmap with IFNGR2g2 cells being grouped by mixscape and MIMOSCA classification. Cells classified by both methods as KO (Class ‘A’) exhibit downregulation of IFNγ pathway genes, while cells classified by both methods as ND (Class ‘D’) resemble NT controls. When mixscape classifies cells as NP and MIMOSCA classifies as KO (Class C), cells resemble NT controls, suggesting that the mixscape classification is correct. Class B (2 cells total) was removed for visualization due to low cell number. (C) Violin plots showing PD-L1 protein expression in IFNGR2g2 cells grouped by their MIMOSCA and mixscape classification (see legend in (B)). Class C cells resemble NT controls, suggesting that the mixscape classification is correct. (D) Barplot showing the % of reads with no INDELS (grey), inframe (orange) and frameshift (red) mutations across all MIMOSCA and mixscape IFNGR2g2 cell classifications. Class C cells resemble NT controls, suggesting that the mixscape classification is correct (n==20,729 cells over 3 viral transduction replicates).
Extended Data Fig. 6
Extended Data Fig. 6. Benchmarking mixscape against MUSIC.
(A) Top: Barplots showing the % of KO (red) and NP (light grey) cells within each gRNA class as classified by mixscape, and MUSIC (Bottom). To assess the potential for overfitting, prior to running the dataset, we randomly sampled 1,000 cells expressing NT gRNA and re-labeled them as a new targeted gene class, representing a negative control (NEG CTRL, marked with a black box). Only mixscape correctly classifies all of these cells as NP. (B) Single-cell mRNA expression heatmap with IFNGR2g2 cells being grouped by mixscape and MUSIC classification. Cells classified by both methods as KO (Class ‘A’) exhibit downregulation of IFNγ pathway genes, while cells classified by both methods as ND (Class ‘D’) resemble NT controls. When mixscape classifies cells as NP and MUSIC classifies as KO (Class C), cells resemble NT controls. When mixscape classifies cells as KO and MUSIC classifies as NP, cells exhibit evidence of perturbation. Therefore, groups B and C suggest that when the methods disagree, the mixscape classification is correct. (C) Violin plots showing PD-L1 protein expression in IFNGR2g2 cells grouped by their MUSIC and mixscape classification. Groups B and C suggest that when the methods disagree, the mixscape classification is correct. (D) Barplot showing the % of reads with no INDELS (grey), inframe (orange) and frameshift (red) mutations across all MUSIC and mixscape IFNGR2g2 cell classifications. Groups B and C suggest that when the methods disagree, the mixscape classification is correct (n==20,729 cells over 3 viral transduction replicates).
Extended Data Fig. 7
Extended Data Fig. 7. Number of detected cells in ECCITE-seq correlates with gene essentiality scores.
(A) Barplot showing the CERES scores for each target gene class generated from AVANA CRISPR screens on THP-1 cells. Low CERES scores for MYC, SPI1, BRD4 and CUL3 suggests these genes are essential for cell survival. (B) Barplot showing the number of cells recovered from each target gene class in the ECCITE-seq experiment. For target genes with low CERES scores we only recover a small number of cells most likely due to decreased survival of KO cells (n==20,729 cells over 3 viral transduction replicates).
Extended Data Fig. 8
Extended Data Fig. 8. Bulk RNA-seq on single gRNA KO samples validates ECCITE-seq findings.
(A) Heatmap showing expression of CUL3 and BRD4 KO signature genes as identified by ECCITE-seq DE on bulk RNA-seq samples. (B) Same as in (A) only this time showing the CUL3 and BRD4 KO cells from the ECCITE-seq experiment. Cells are split into groups based on their gRNA ID.
Extended Data Fig. 9
Extended Data Fig. 9. CUL3 KO cells have a unique transcriptomic signature.
(A)Single-cell mRNA expression heatmap showing that CUL3 KO cells upregulate a module of genes in comparison to NT and CUL3 NP cells (including the PD-L1 transcript (CD274), highlighted on the heatmap).(B) Single-cell mRNA expression heatmap showing that the CUL3 transcriptomic signature is not IFNγ-related, suggesting CUL3 is acting through an alternative pathway to regulate PD-L1 at the transcriptional level. For both (B) and (C) heatmaps, lists of genes were obtained using FindMarkers() function in Seurat (Wilcoxon Rank sum test). mRNA counts are log-normalized and scaled (z-score).
Extended Data Fig. 10
Extended Data Fig. 10. Mixscape increases the signal to noise ratio by removing “escaping” cells.
(A) Volcano plots showing DE genes before and after mixscape classification for BRD4 and CUL3 KO cells.(B) UpSet plot showing the intersection between DE genes from before and after mixscape classification.
Figure 1.
Figure 1.. CITE-seq and ECCITE-seq identify regulators of PD-L1 protein expression.
a) Experimental design schematic. NT, non-targeting. b) Expression of PD-L1 (left) and CD86 (right) protein in stimulated (green, n=20,000 cells) and control (grey, n=20,000 cells) THP-1 cells, as measured by flow cytometry and (c) CITE-seq. d) Single-cell heatmap showing the z-scored expression of 200 genes whose expression correlates with CD86 and PD-L1 protein expression (Supplementary Note). e) ECCITE-seq measurements of PD-L1 protein expression in cells that received gRNAs targeting PD-L1 and IFNGR1, and non-targeting controls. f) Power analysis to estimate the number of cells necessary to detect statistically significant shifts in protein expression across two different gRNAs (IFNGR1g2 and PDL1g1). A one-sided Wilcox Rank sum test was used. Each boxplot summarizes ten random sampling draws of the indicated number of cells and the log-transformed p-values generated through differential protein expression (DE) analysis using Wilcox Rank sum test. DE was performed using the same number of sampled IFNGR2g1, PDL1g1 and non-targeting control cells. Boxplots: middle line is the median, the lower and upper hinges correspond to the first and third quartiles, the upper whisker extends from the hinge to the largest value no further than 1.5 × IQR from the hinge (IQR = inter-quartile range) and the lower whisker extends from the hinge to the smallest value at most 1.5 × IQR of the hinge.
Figure 2.
Figure 2.. Calculating perturbation signature removes confounding variation.
a) UMAP visualization of the ECCITE-seq dataset based on cellular transcriptomes. Cells are colored by transduction replicate and cell cycle state. b) Same as in (a). Cells are split and colored by perturbation status (NT; non-targeted). Circle denotes a perturbation-specific cluster. c) Same as in (b). Top: example of three distinct cells expressing an IRF1 gRNA (red, blue, purple). Bottom: their 20 nearest NT neighbors (NN). Grey dots: all other cells. d) UMAP visualization based on perturbation signatures. Ovals denote perturbation-specific clusters. e) UMAP visualization showing IFNGR2g2 and NT cells. Oval denotes a group of putative IFNGR2g2 KO cells that cluster separately, but a subset of targeted cells appears to be non-perturbed (NP). f) Violin plot showing PD-L1 protein expression in NT, NP, and KO cells. IFNGR2g2 KO cells exhibit low PD-L1 protein levels while IFNGR2g2 NP and NT cells express PD-L1 at identical levels. g) Single-cell mRNA heatmap showing the IFNγ pathway-related gene expression in NT, NP, and KO cells. Gene expression is scaled (z-scored) across all single cells. For visualization purposes we downsampled our dataset to include 150 cells from each class. h) Interactive Genome Viewer (IGV) screenshot of a representative sample of reads mapping at theIFNGR2 gene locus (chr21: 34787276–34787299) targeted by IFNGR2g2 gRNA. CRISPR-induced INDELs are seen as black lines. Arrow indicates cut site. Barplote showing the % of IFNGR2 reads with no INDELS (NID), in-frame (IF) and frameshift (FS) mutations across NT (n=2,386), IFNGR2g2 NP and KO cells (n=278).
Figure 3.
Figure 3.. Mixscape removes cells that escape perturbation.
a) Distribution of perturbation scores (Supplementary Note) for NT (non-targeted, grey) and IFNGR2 (red) cells. IFNGR2 cells are a mixture of two Gaussian distributions reflecting non-perturbed (NP) and KO cells. Classifying cells with mixscape resolves this heterogeneity. b) Violin plot showing PD-L1 protein expression based on mixscape classification. Only KO cells show a reduction in PD-L1 protein levels when compared to NT control cells. c) Barplot showing the percentage of targeted cells classified as KO and NP by mixscape for each gRNA (n=20,729 cells over 3 viral transduction replicates). Black box highlights three gRNAs targeting IRF1 gene locus. d) ECCITE-seq measurements of PD-L1 protein expression for cells expressing four distinct gRNAs targeting IRF1, and NT controls. e) Flow cytometry measurements of PD-L1 protein expression for the same populations as in (d). IRF1g1=7,500, IRF1g2=9,000, IRF1g3=5,300, IRF1g4=5,800 and NT=2600 cells. f) Barplot summarizing the percentage of KO and NP cells in each target gene class (n=20,729 cells over 3 viral transduction replicates). g) UMAP visualization of all 7,421 NT and KO cells after running Linear Discriminant Analysis (LDA) (Supplementary Note), revealing perturbation-specific clustering.
Figure 4.
Figure 4.. BRD4 and CUL3 are negative regulators of PD-L1 expression.
a) Single-cell mRNA expression heatmap showing 20 differentially expressed genes for each mixscape-classified perturbation. For visualization purposes we downsampled our dataset to include 30 cells from each class in the heatmap. b) Violin plots of PD-L1 protein expression for all identified regulators. BRD4 (p-value=4.37e−28), CUL3 (p-value=2.81e−11) and MYC (p-value=4.51e−7) are negative regulators, while the remaining are positive (p-value < 1e−6 in all cases, two-sided Wilcox Rank sum). NT, non-targeted. c) Flow cytometry measurements of PD-L1 protein expression across experimental conditions. JQ1 inhibitor treatment (24 hours, 1μM) reduces stimulation-induced PD-L1 expression. Control=20,000, stim=20,000 and JQ1+stim=20,000 cells. d) Flow cytometry measurements of PD-L1 protein expression in BRD4 gRNA expressing cells, validating our ECCITE-seq findings. BRD4g2=9,100, BRD4g5=15,000 and NT=4,800 cells. e) Violin plots showing elevated expression of PD-L1 transcript in CUL3 KO cells, in comparison to non-targeting controls. f) Barplot summarizing gene set enrichment analysis results for 300 genes upregulated in CUL3 KO cells. Analysis was performed using the Human WikiPathways database from the EnrichR package and shows strong enrichment for the NRF2 pathway.
Figure 5.
Figure 5.. CUL3-KEAP1 complex indirectly regulates PD-L1 through NRF2.
a) Schematic representation describing two complementary modes of CUL3-mediated PD-L1 regulation. The CUL3-SPOP complex directly regulates PD-L1 protein stability through ubiquitination. The CUL3-KEAP1 complex regulates NRF2 protein stability, indirectly modulating NRF2-mediated PD-L1 transcription. b) Validation pooled CRISPR screen results (2 biological replicates) targeting KEAP1, SPOP, CUL3, BRD4, IFNGR1 and NRF2 (including 4 non-targeting gRNAs). gRNAs targeting KEAP1, SPOP, CUL3 and BRD4 (green) were enriched in cells expressing high levels of PD-L1 protein while NRF2 and IFNGR1 gRNAs were depleted (red) NT, non-targeted. c) Boxplots showing the PD-L1 protein geometric mean fluorescence intensity (gMFI) (n =2 for each boxplot), (d) PD-L1 transcript and (e) NRF2 transcript levels (log1p(TPM)) in control (n = 3) and NRF2 overexpression (OE) (n = 4) cells. f) Density plot showing the average log2 fold change of three CUL3 KO cell DE gene subsets in the NRF2 OE dataset. g) Boxplots showing the PD-L1 protein geometric mean fluorescence intensity (gMFI) (n=2 KEAP1 KO and n=3 NT), (h) PD-L1 transcript and (i) KEAP1 transcript levels (log1p(TPM)) in NT (n = 8) and KEAP1 KO (n = 8) cells. In c-e and g-i boxplots the middle line is the median, the lower and upper hinges correspond to the first and third quartiles, the upper whisker extends from the hinge to the largest value no further than 1.5 × IQR from the hinge (IQR = inter-quartile range) and the lower whisker extends from the hinge to the smallest value at most 1.5 × IQR of the hinge.

References

    1. Greenwald RJ, Freeman GJ, Sharpe AH. The B7 family revisited. Annu Rev Immunol. 2005;23: 515–548. - PubMed
    1. Pardoll DM. The blockade of immune checkpoints in cancer immunotherapy. Nat Rev Cancer. 2012;12: 252–264. - PMC - PubMed
    1. Dong H, Strome SE, Salomao DR, Tamura H, Hirano F, Flies DB, et al. Tumor-associated B7-H1 promotes T-cell apoptosis: A potential mechanism of immune evasion. Nat Med. 2002. doi: 10.1038/nm730 - DOI - PubMed
    1. Zou W, Chen L. Inhibitory B7-family molecules in the tumour microenvironment. Nat Rev Immunol. 2008;8: 467–477. - PubMed
    1. Freeman GJ, Long AJ, Iwai Y, Bourque K, Chernova T, Nishimura H, et al. Engagement of the PD-1 immunoinhibitory receptor by a novel B7 family member leads to negative regulation of lymphocyte activation. J Exp Med. 2000;192: 1027–1034. - PMC - PubMed

METHODS-ONLY REFERENCES

    1. Ashland OR: Becton, Dickinson and Company. FlowJo TM Software, Version 10.6.2. 2020.
    1. Butler A, Hoffman P, Smibert P, Papalexi E, Satija R. Integrating single-cell transcriptomic data across different conditions, technologies, and species. Nat Biotechnol. 2018;36: 411–420. - PMC - PubMed
    1. Dang Y, Jia G, Choi J, Ma H, Anaya E, Ye C, et al. Optimizing sgRNA structure to improve CRISPR-Cas9 knockout efficiency. Genome Biol. 2015;16: 280. - PMC - PubMed
    1. Meier JA, Zhang F, Sanjana NE. GUIDES: sgRNA design for loss-of-function screens. Nat Methods. 2017. doi: 10.1038/nmeth.4423 - DOI - PMC - PubMed
    1. Ran FA, Hsu PD, Wright J, Agarwala V, Scott DA, Zhang F. Genome engineering using the CRISPR-Cas9 system. Nat Protoc. 2013;8: 2281–2308. - PMC - PubMed

Publication types

MeSH terms