. 2021 Apr;53(4):511-520.
doi: 10.1038/s41588-021-00798-y. Epub 2021 Mar 1.

Transcription factor competition at the γ-globin promoters controls hemoglobin switching

Affiliations

Transcription factor competition at the γ-globin promoters controls hemoglobin switching

Nan Liu et al. Nat Genet. 2021 Apr.

Erratum in

Abstract

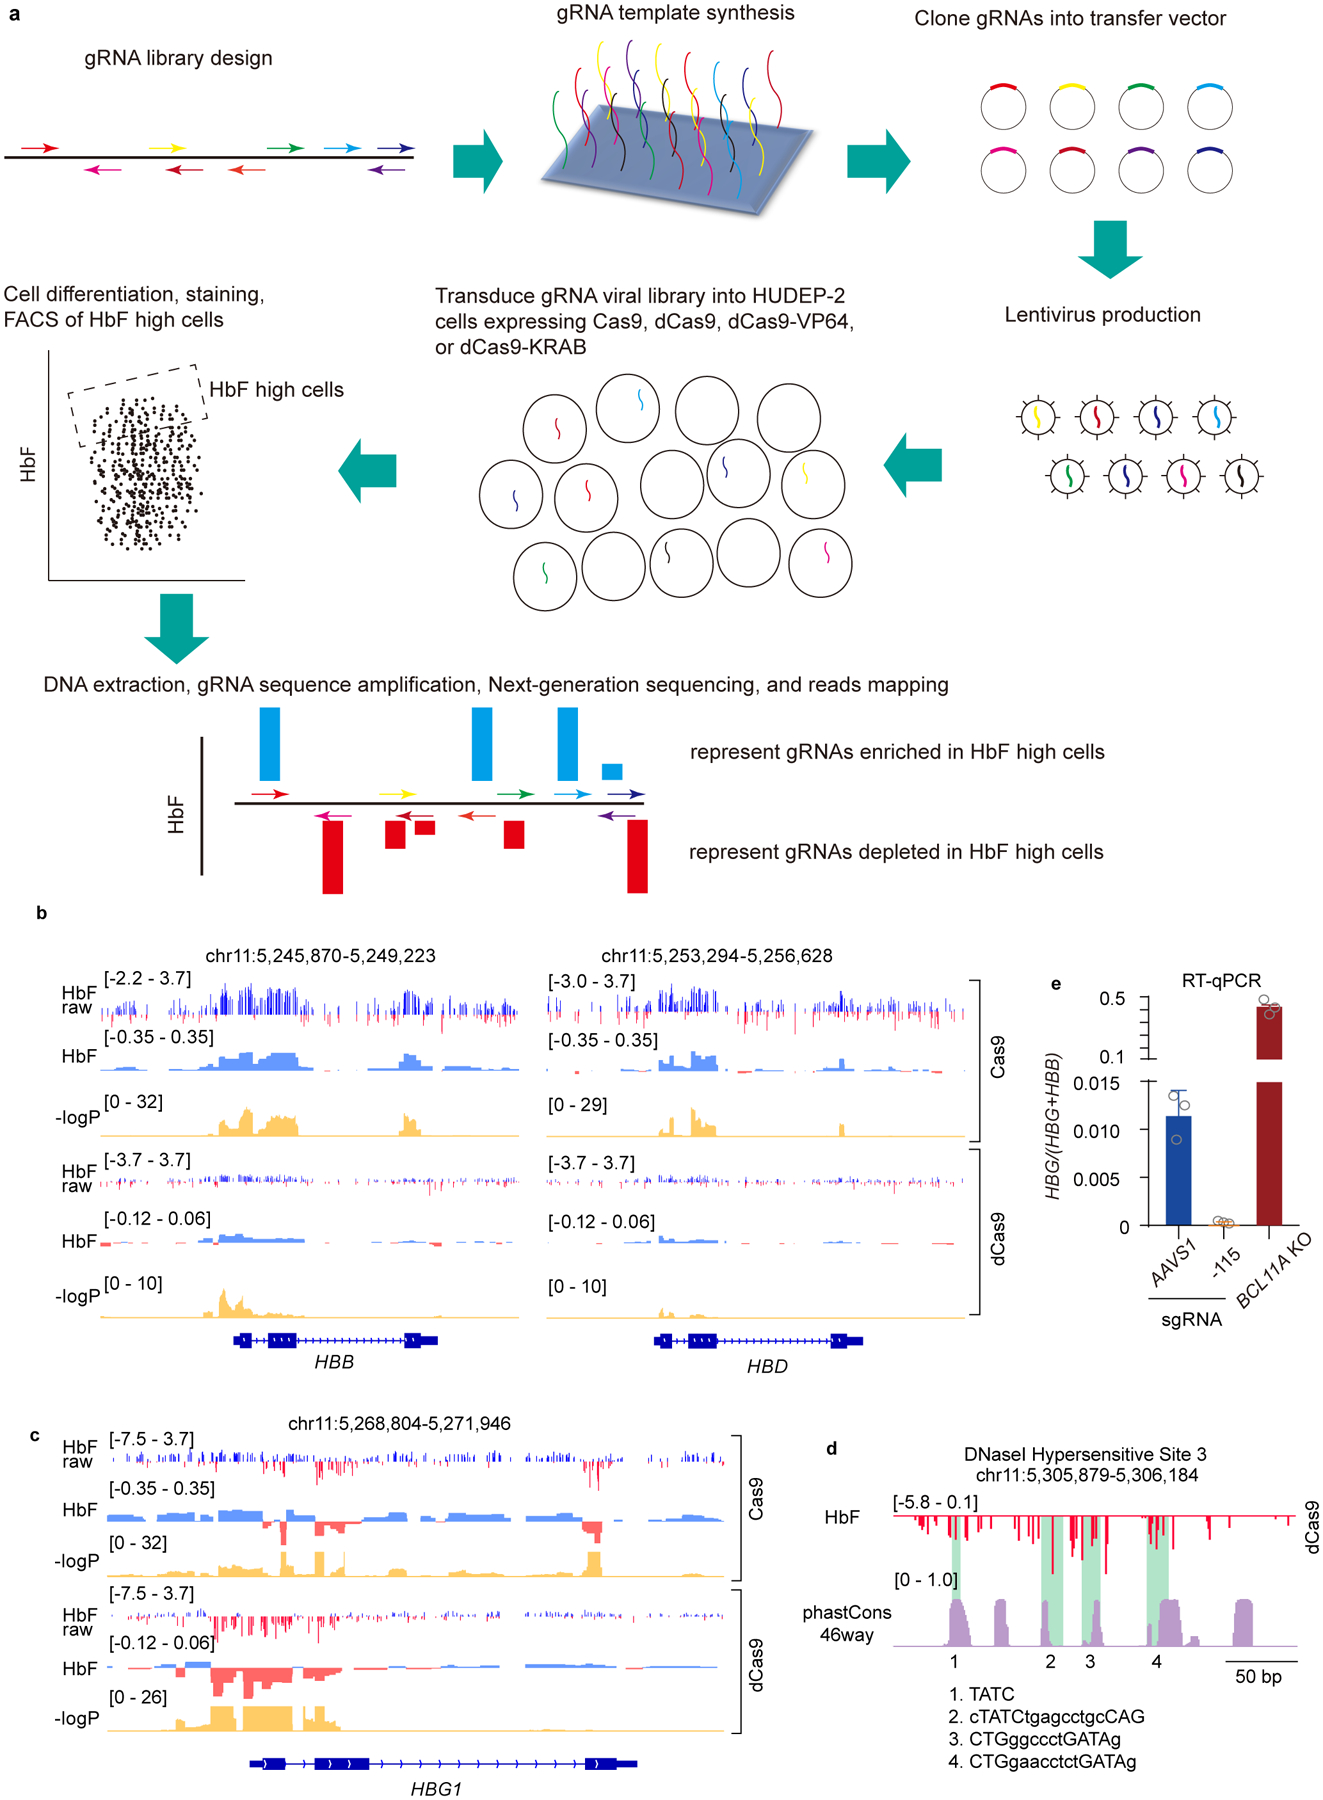
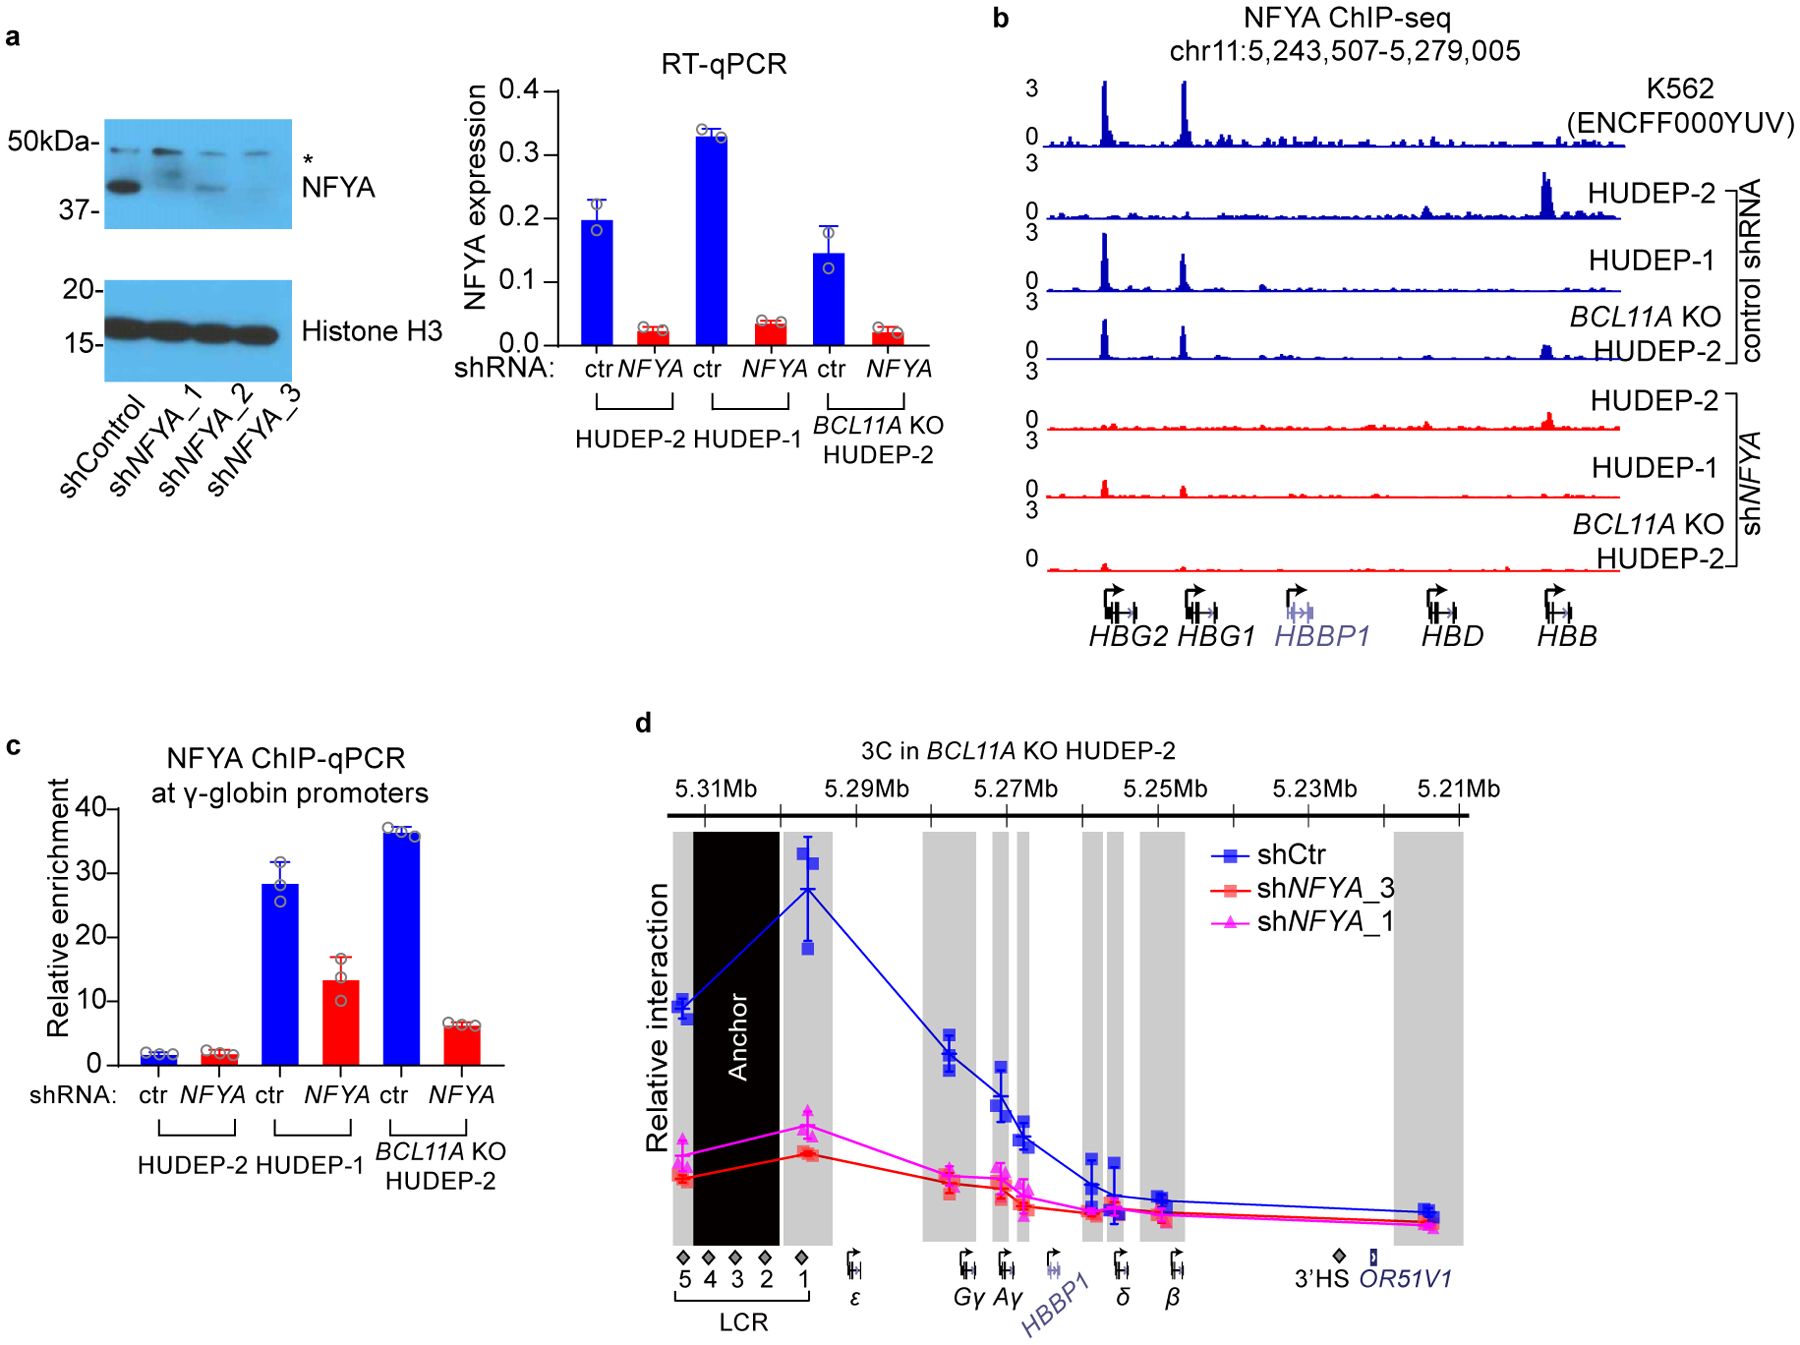
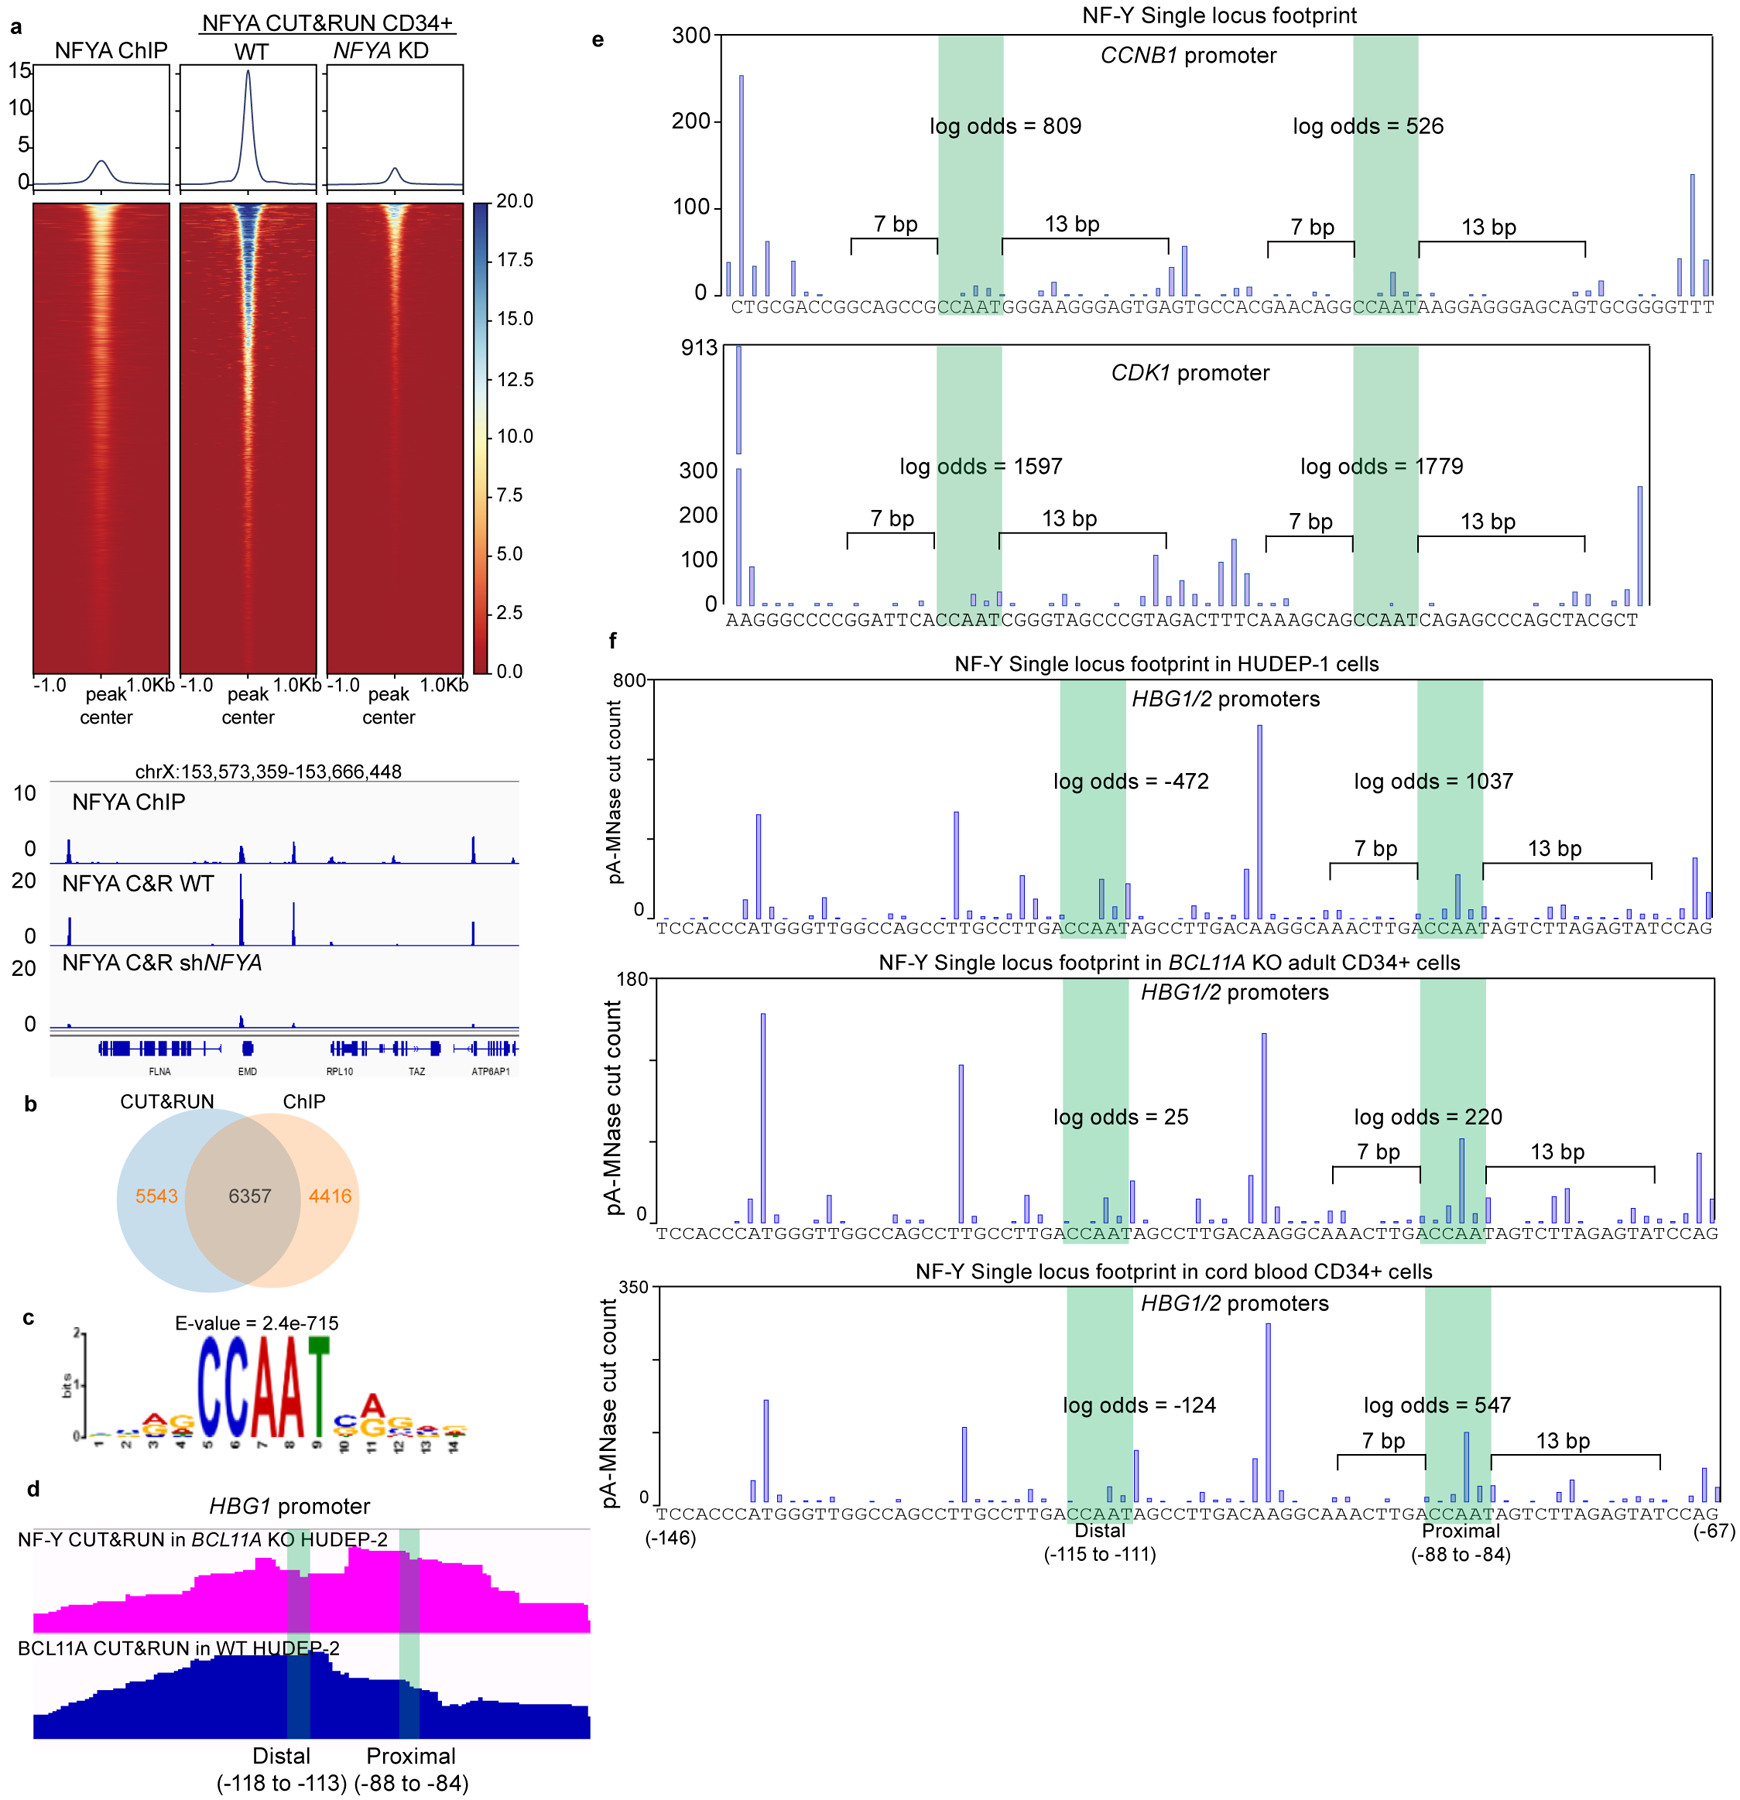
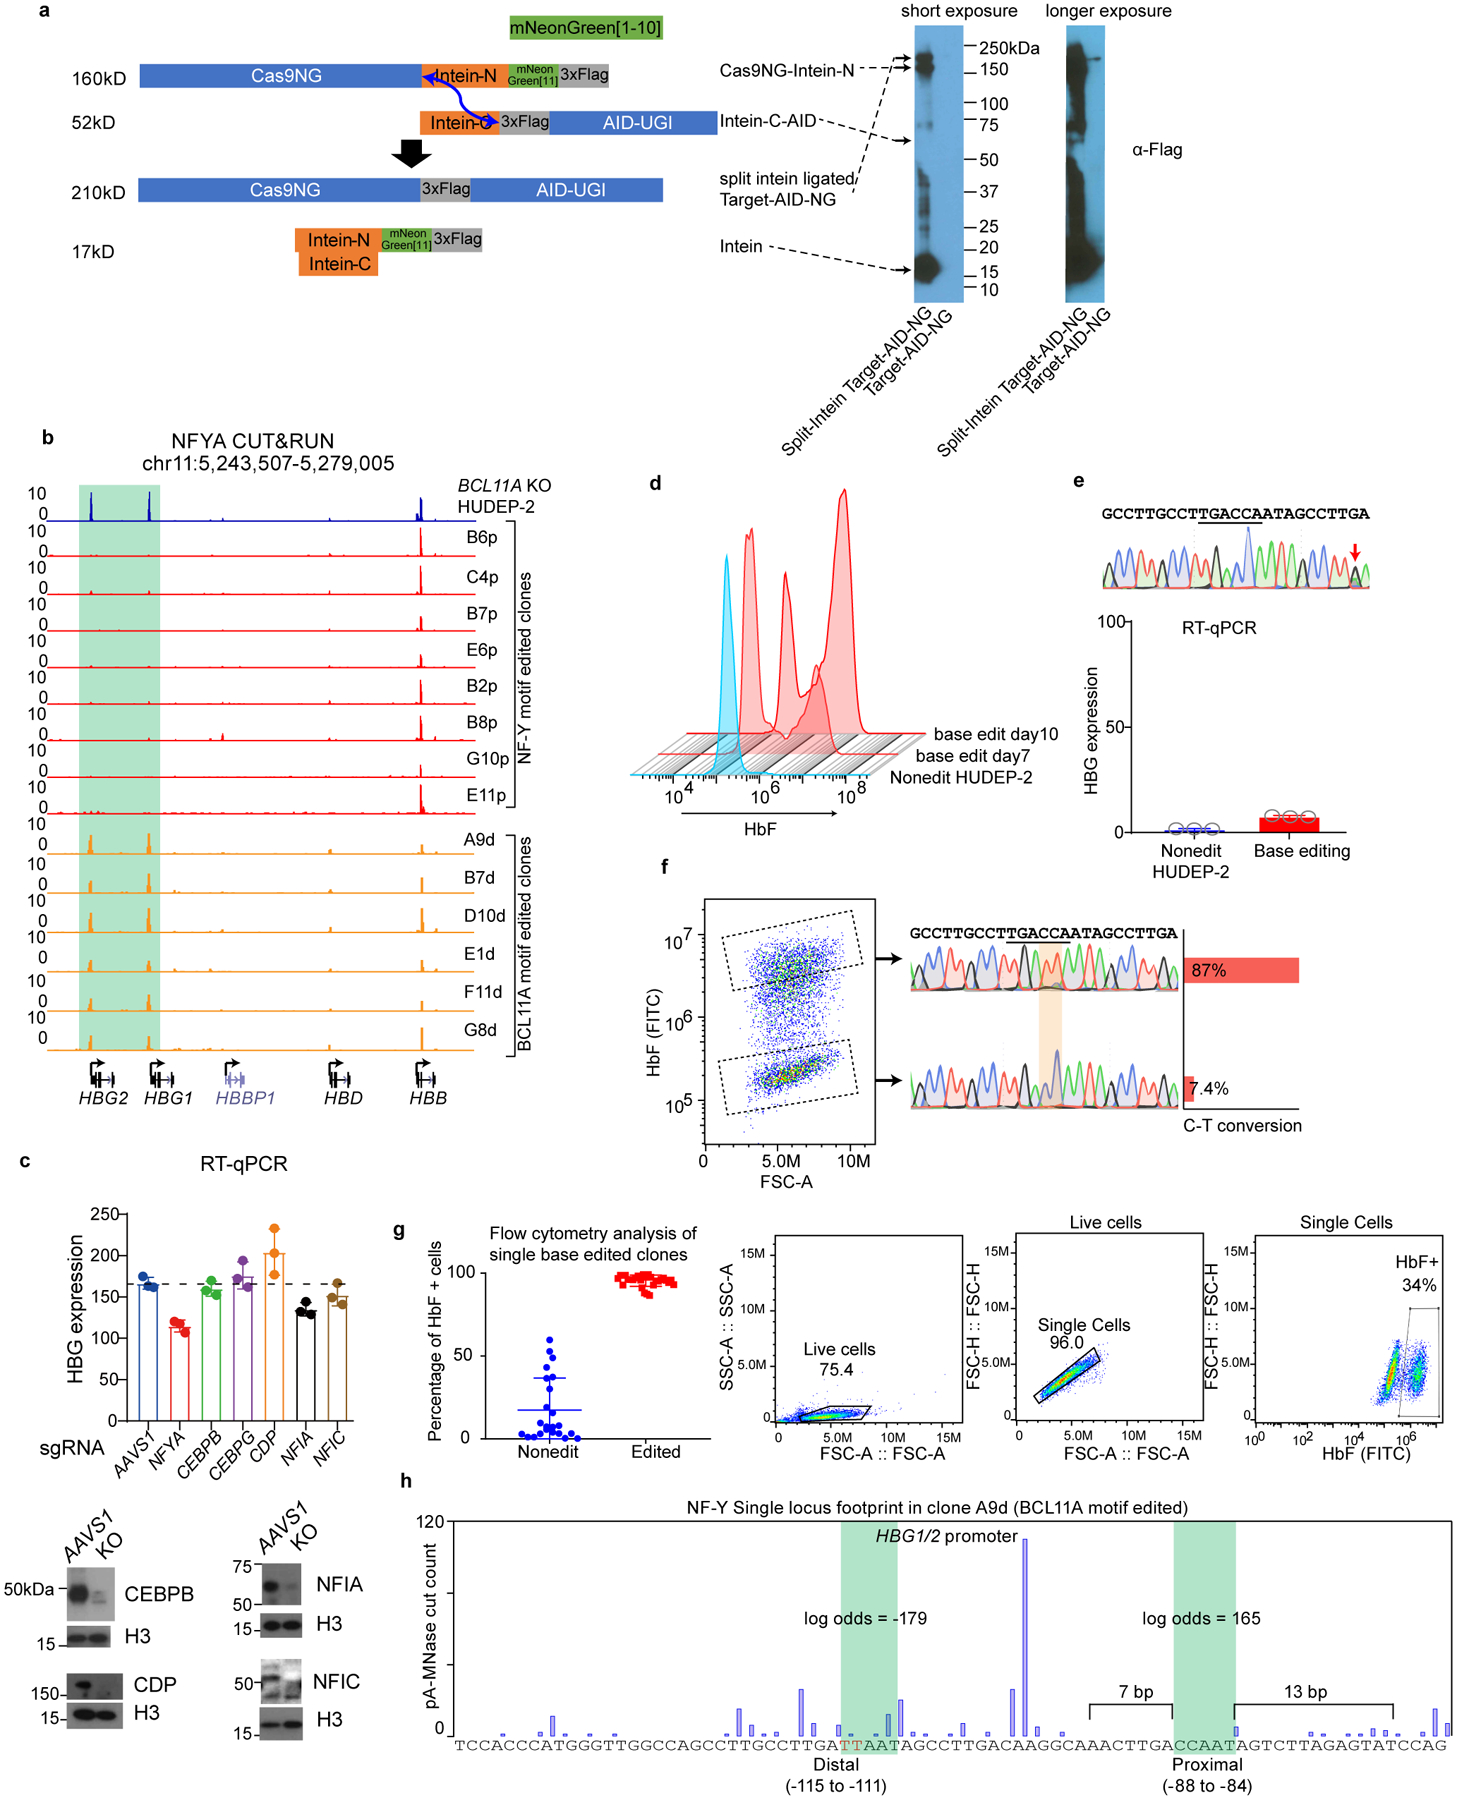
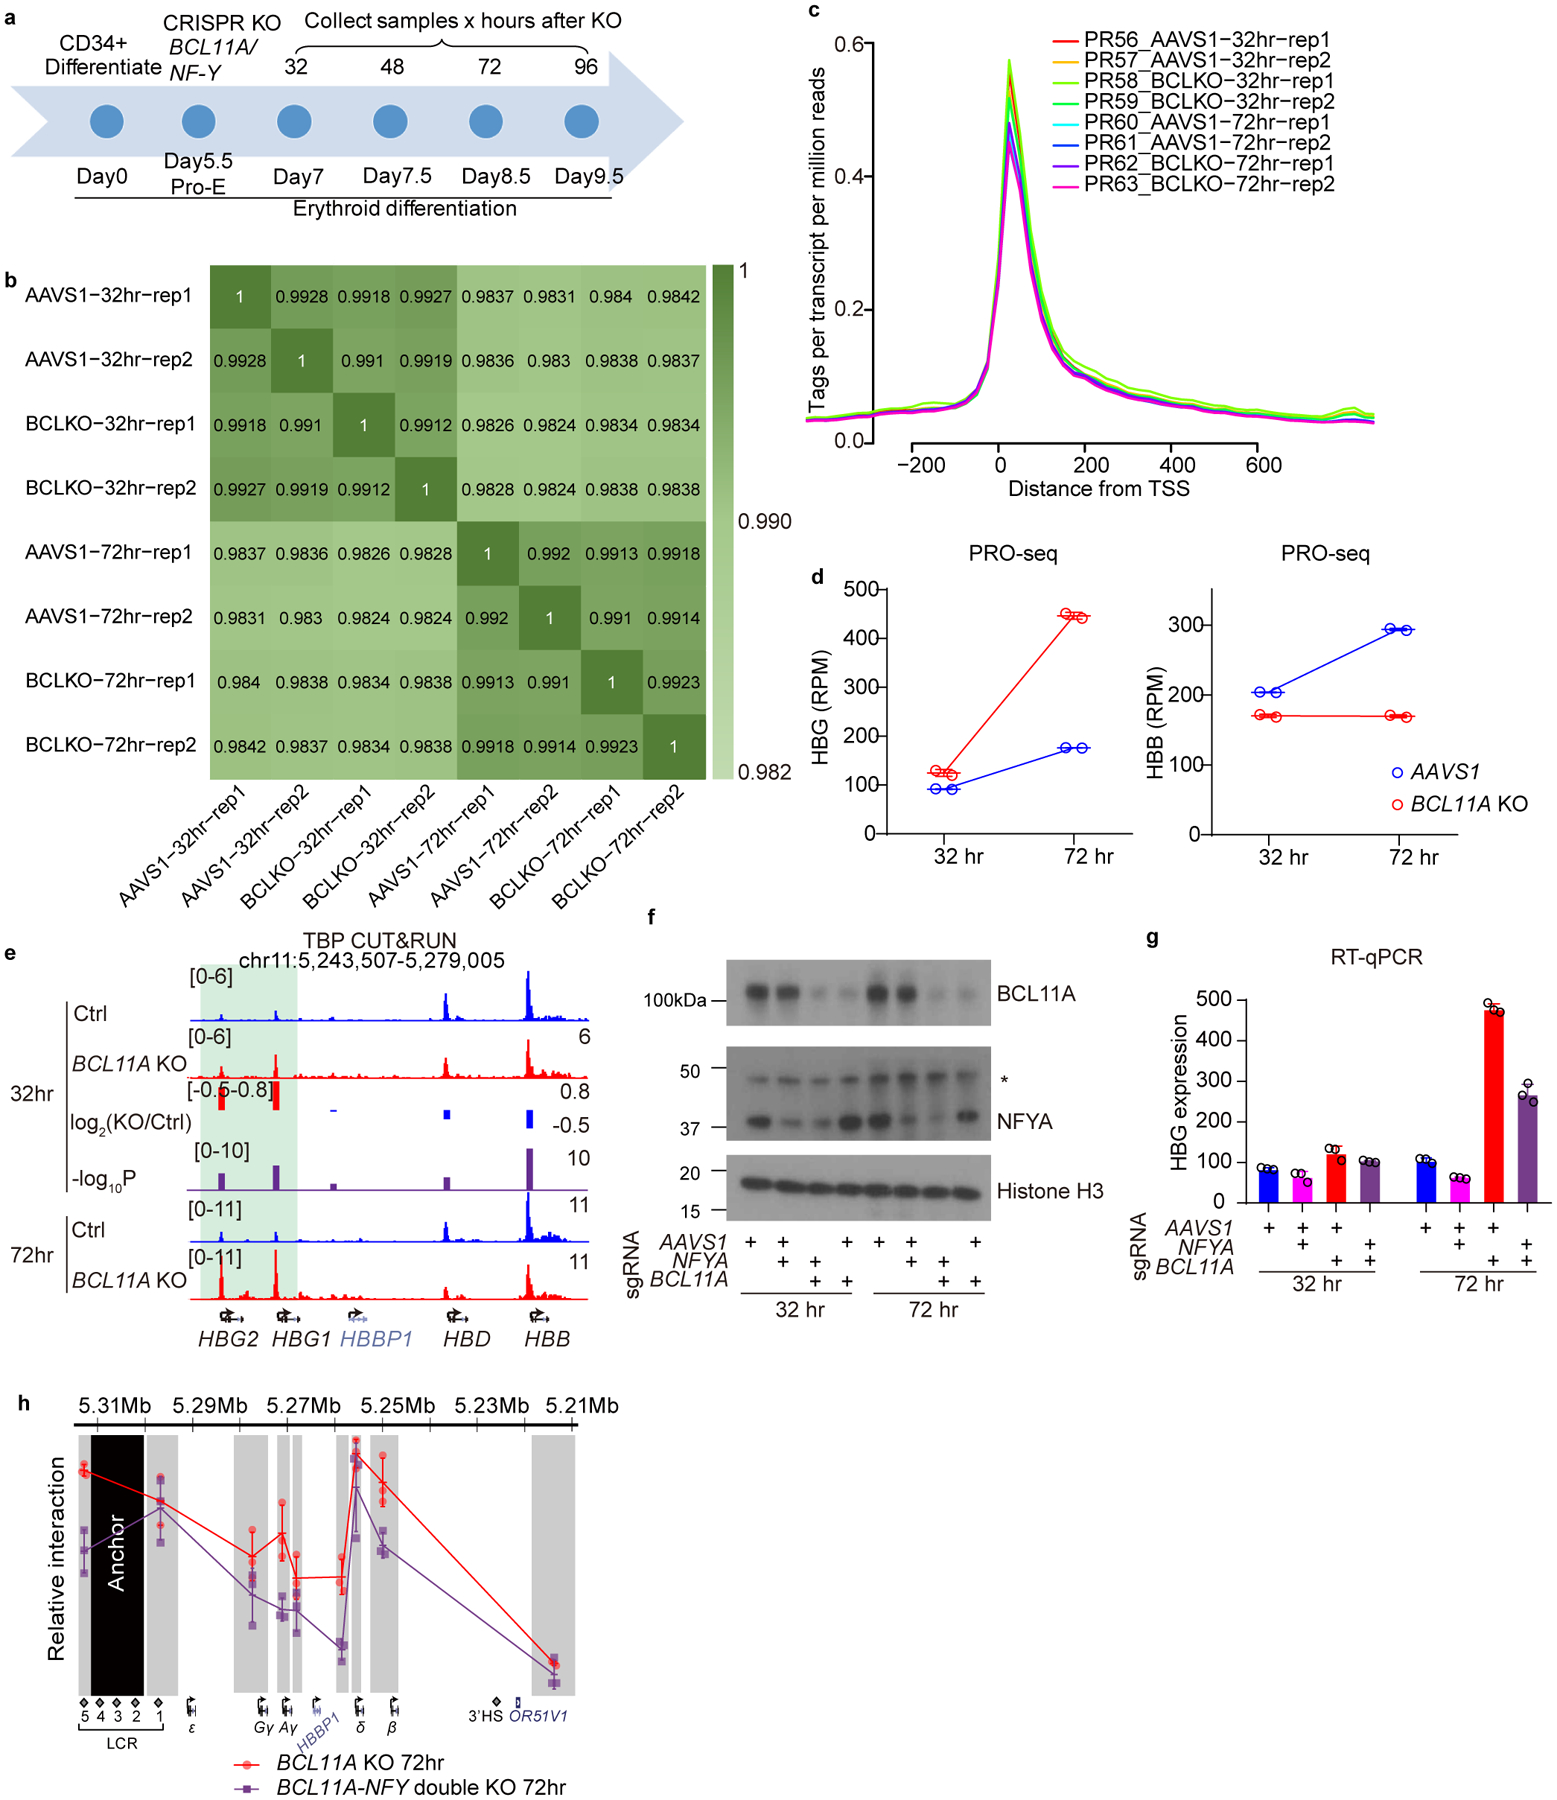
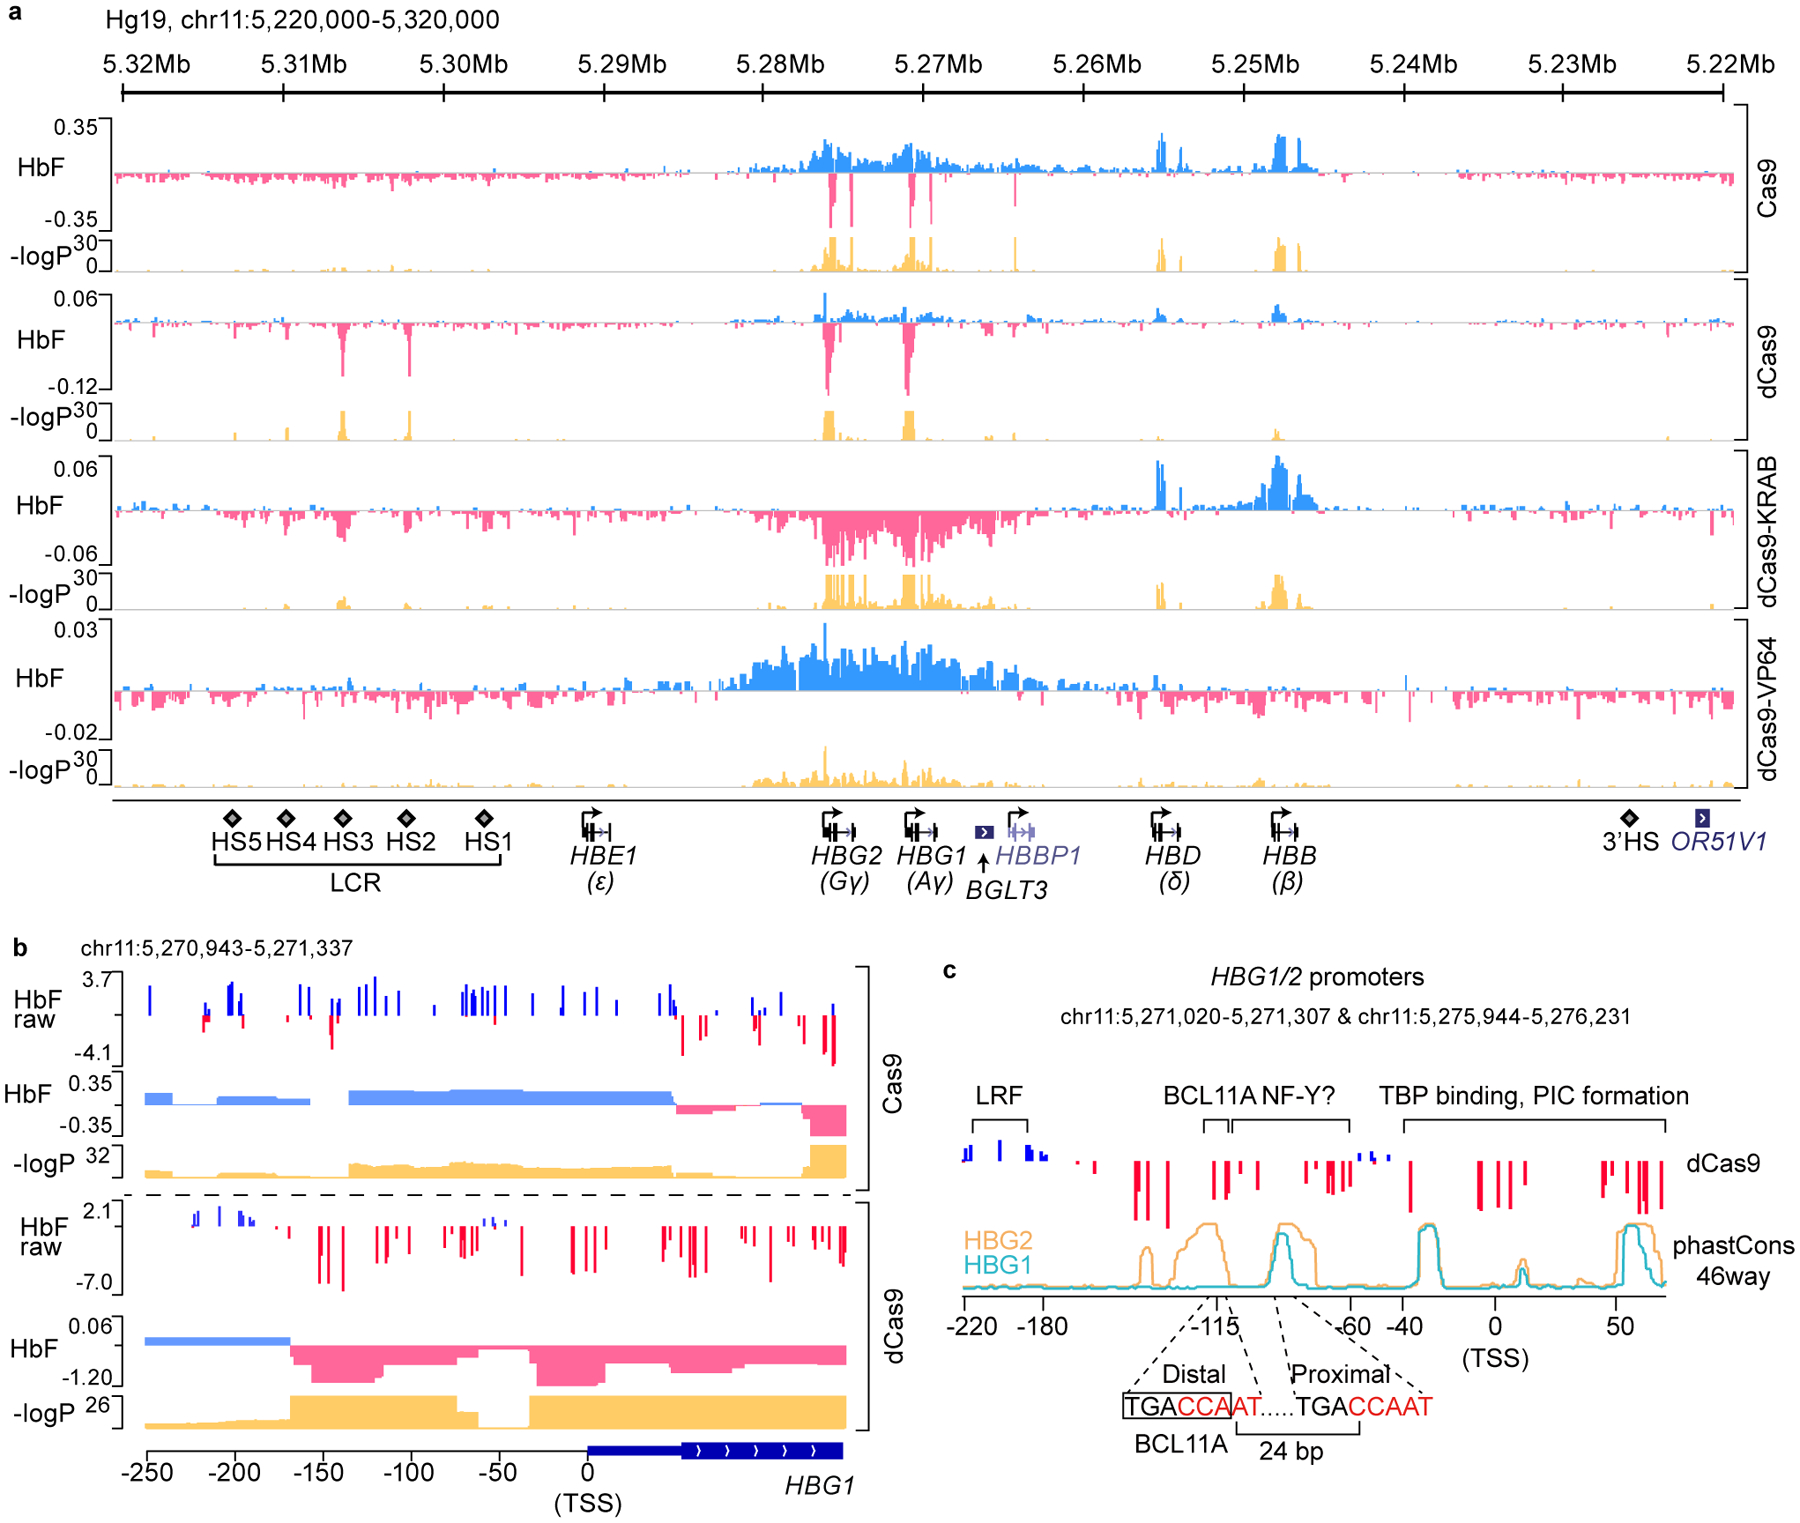
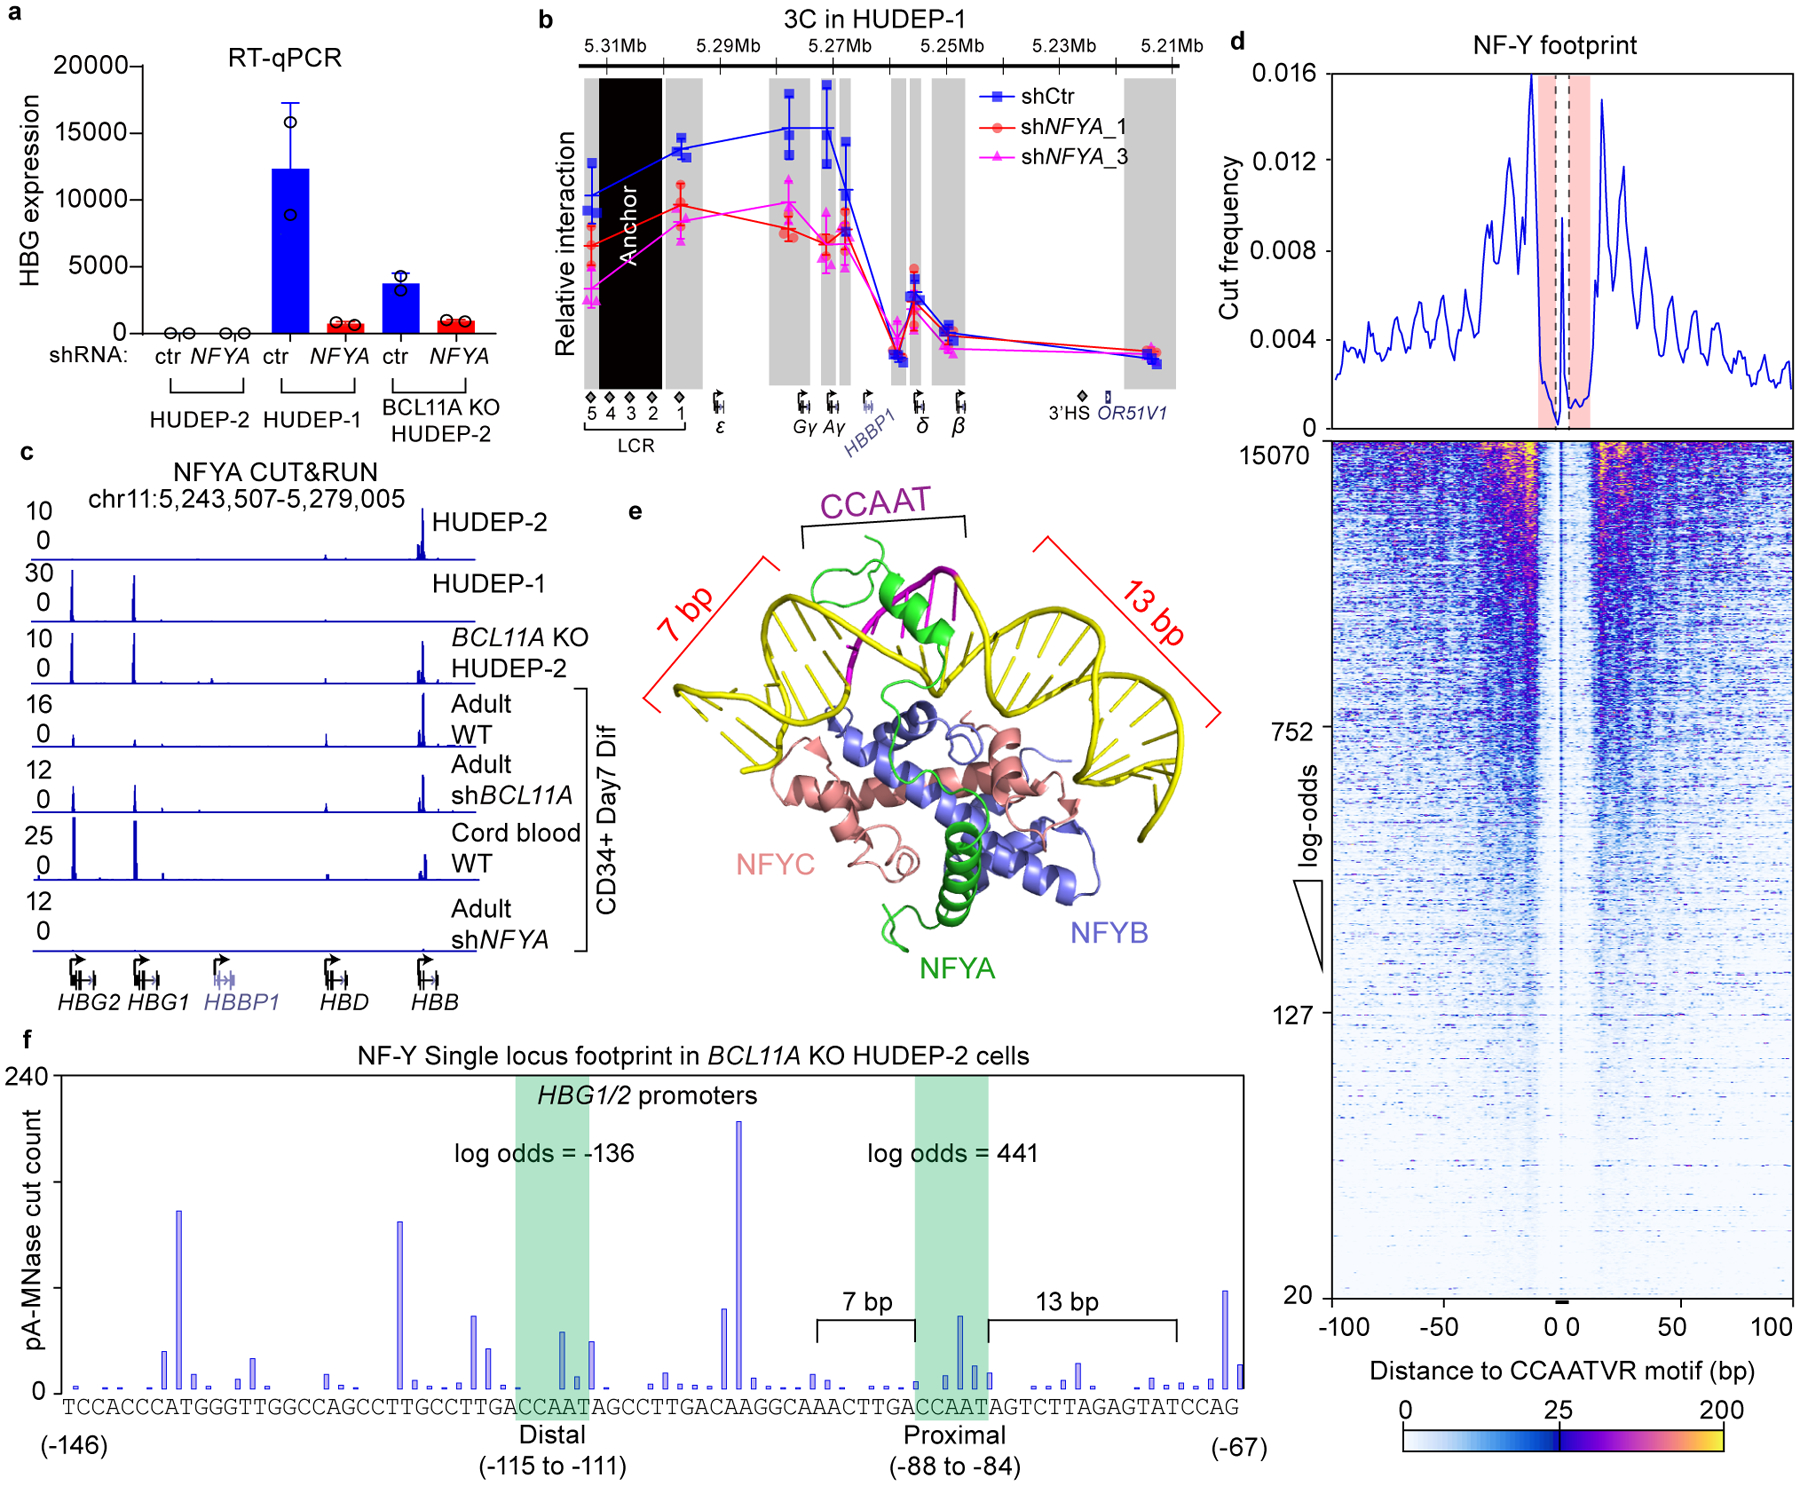
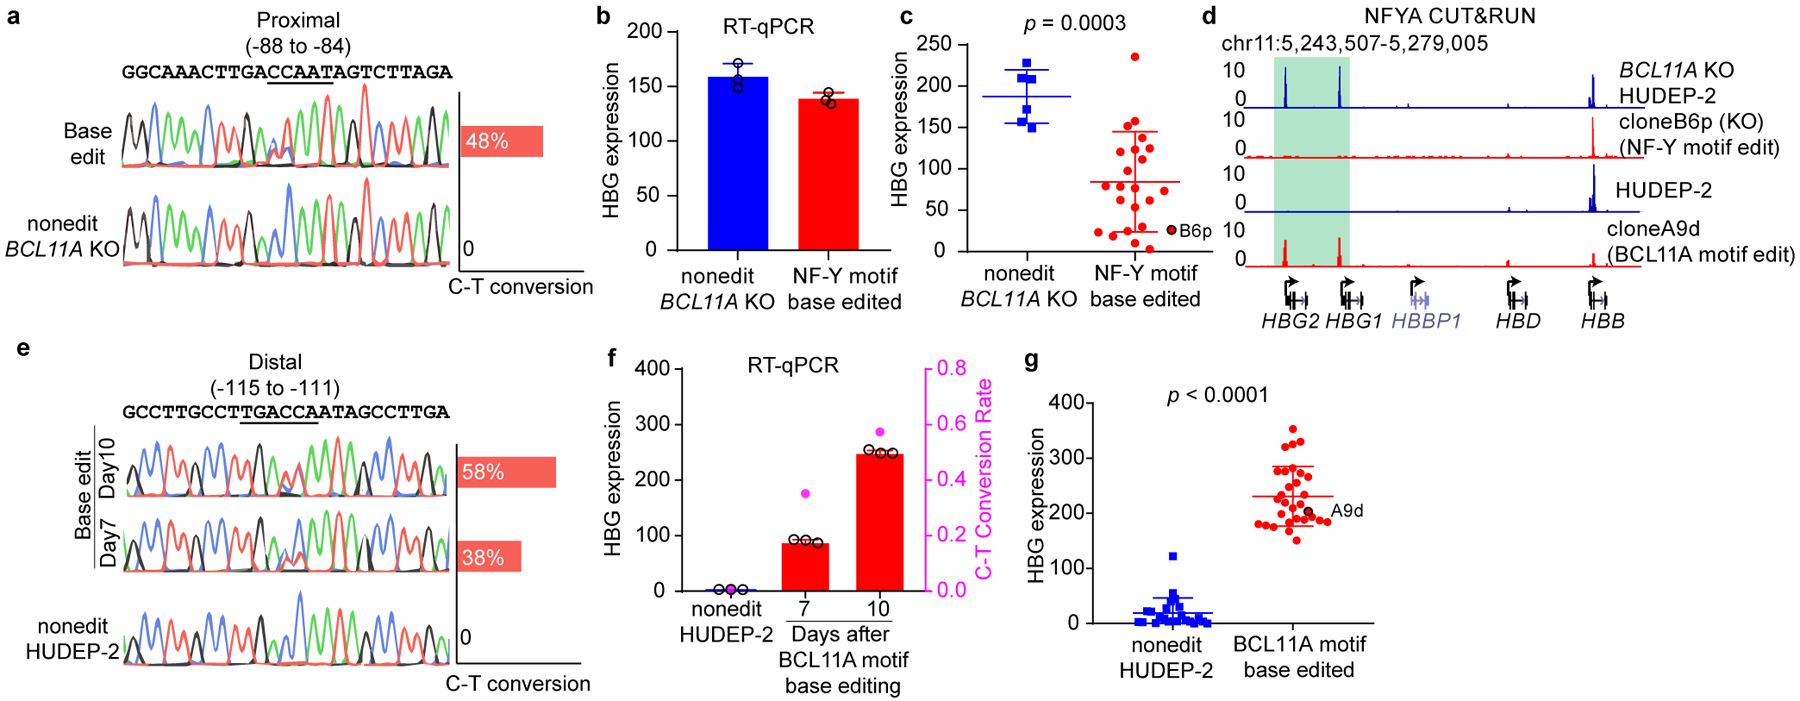
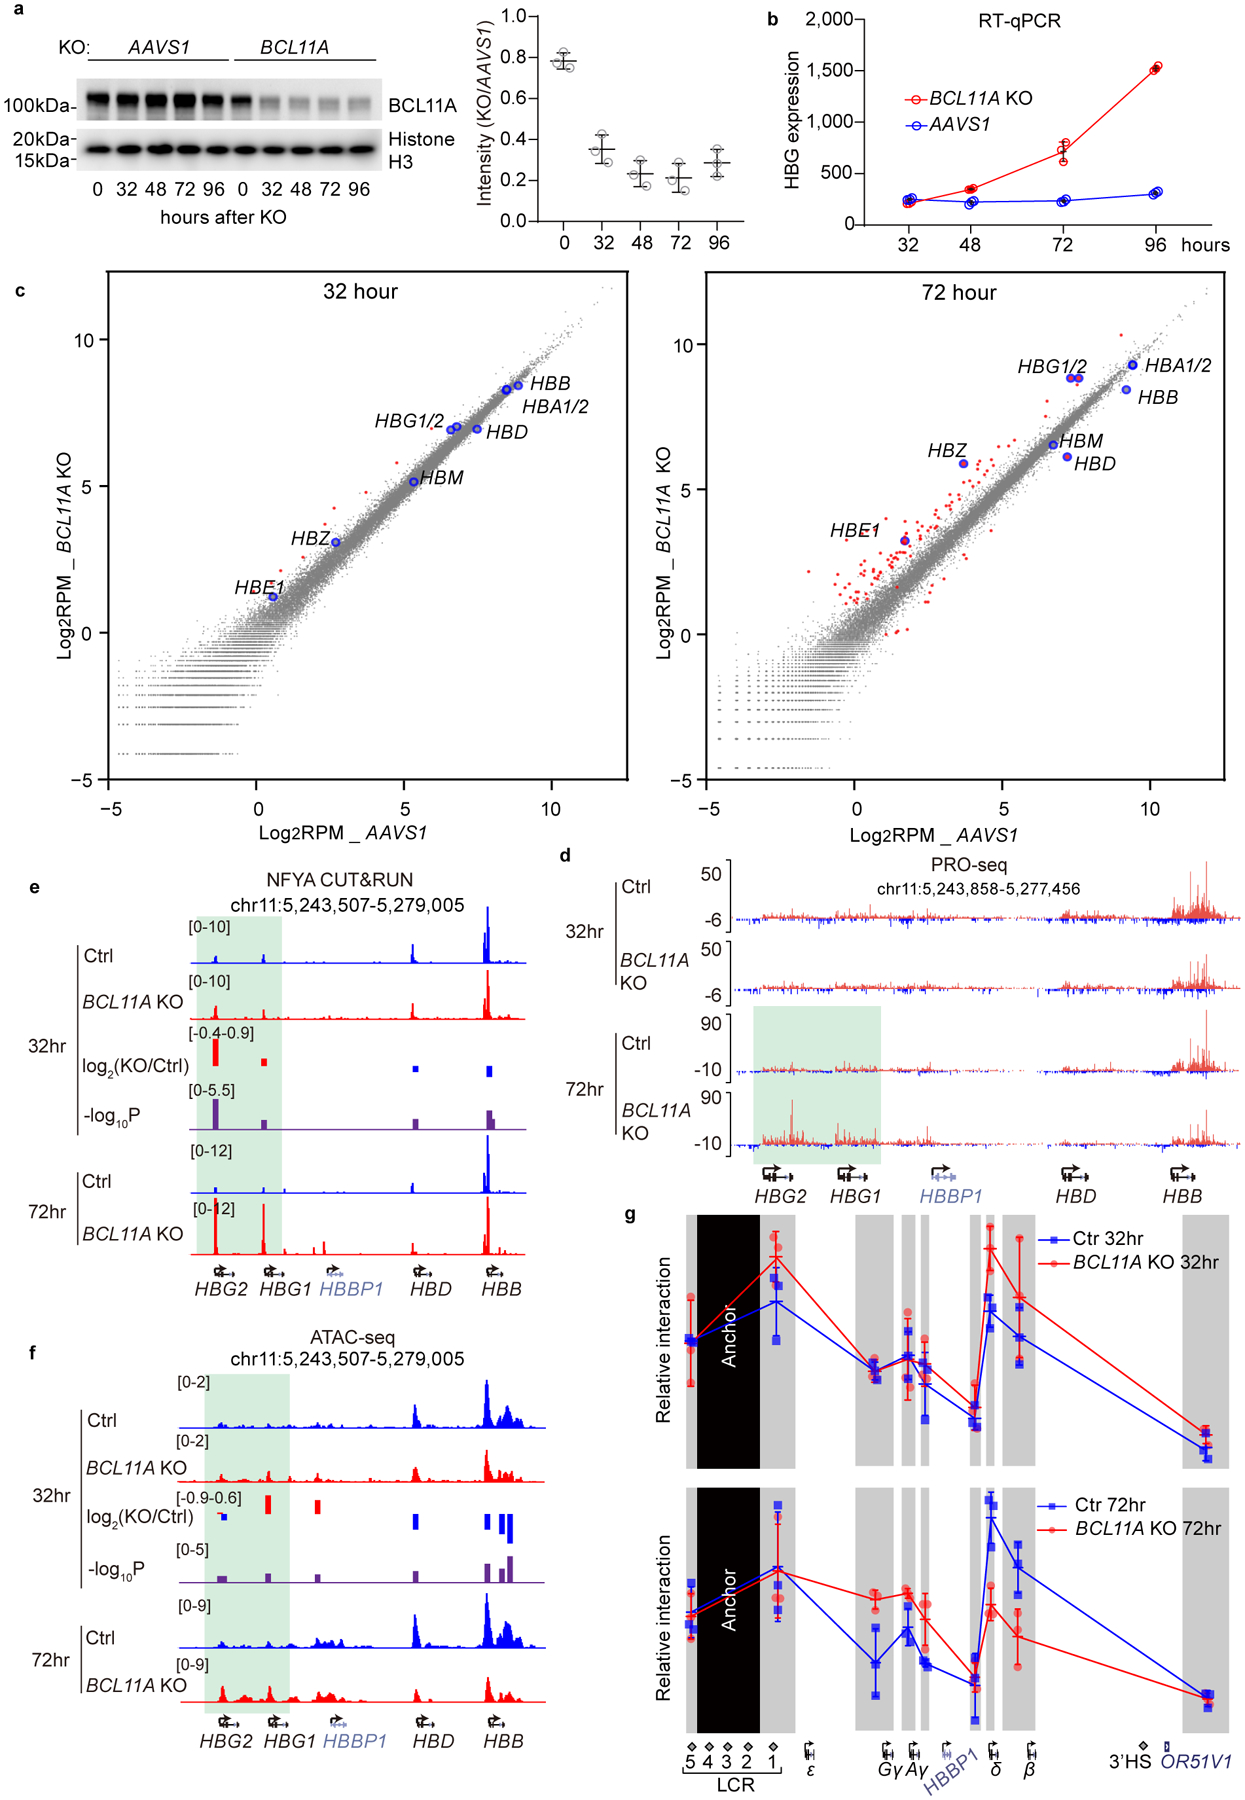
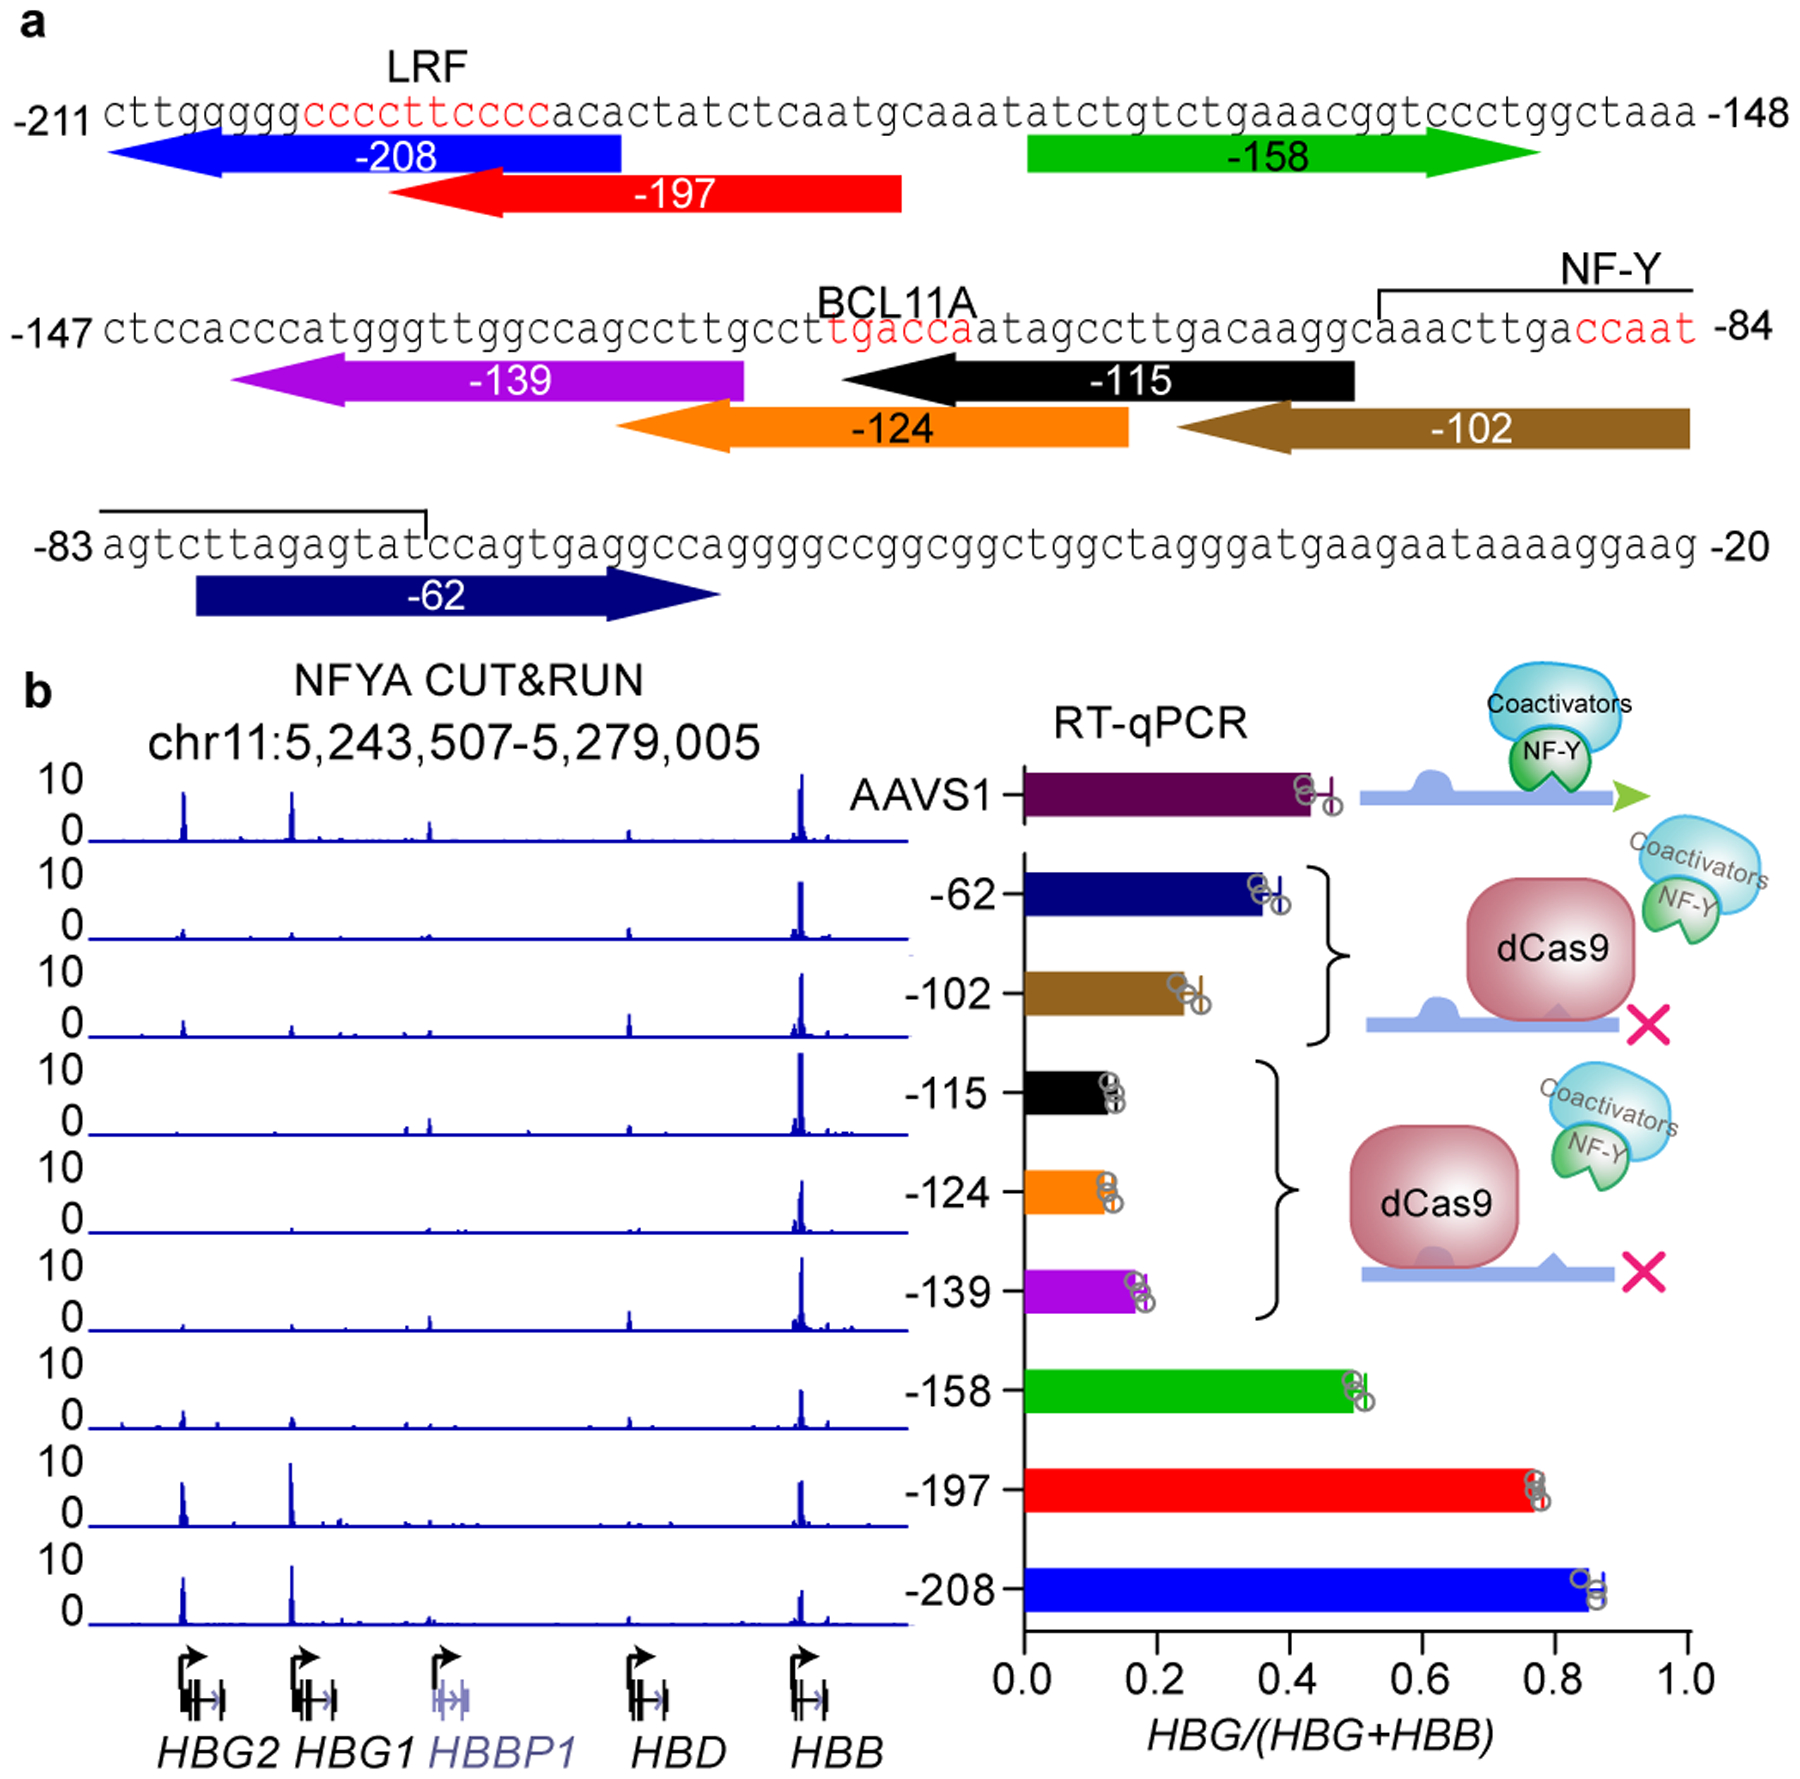
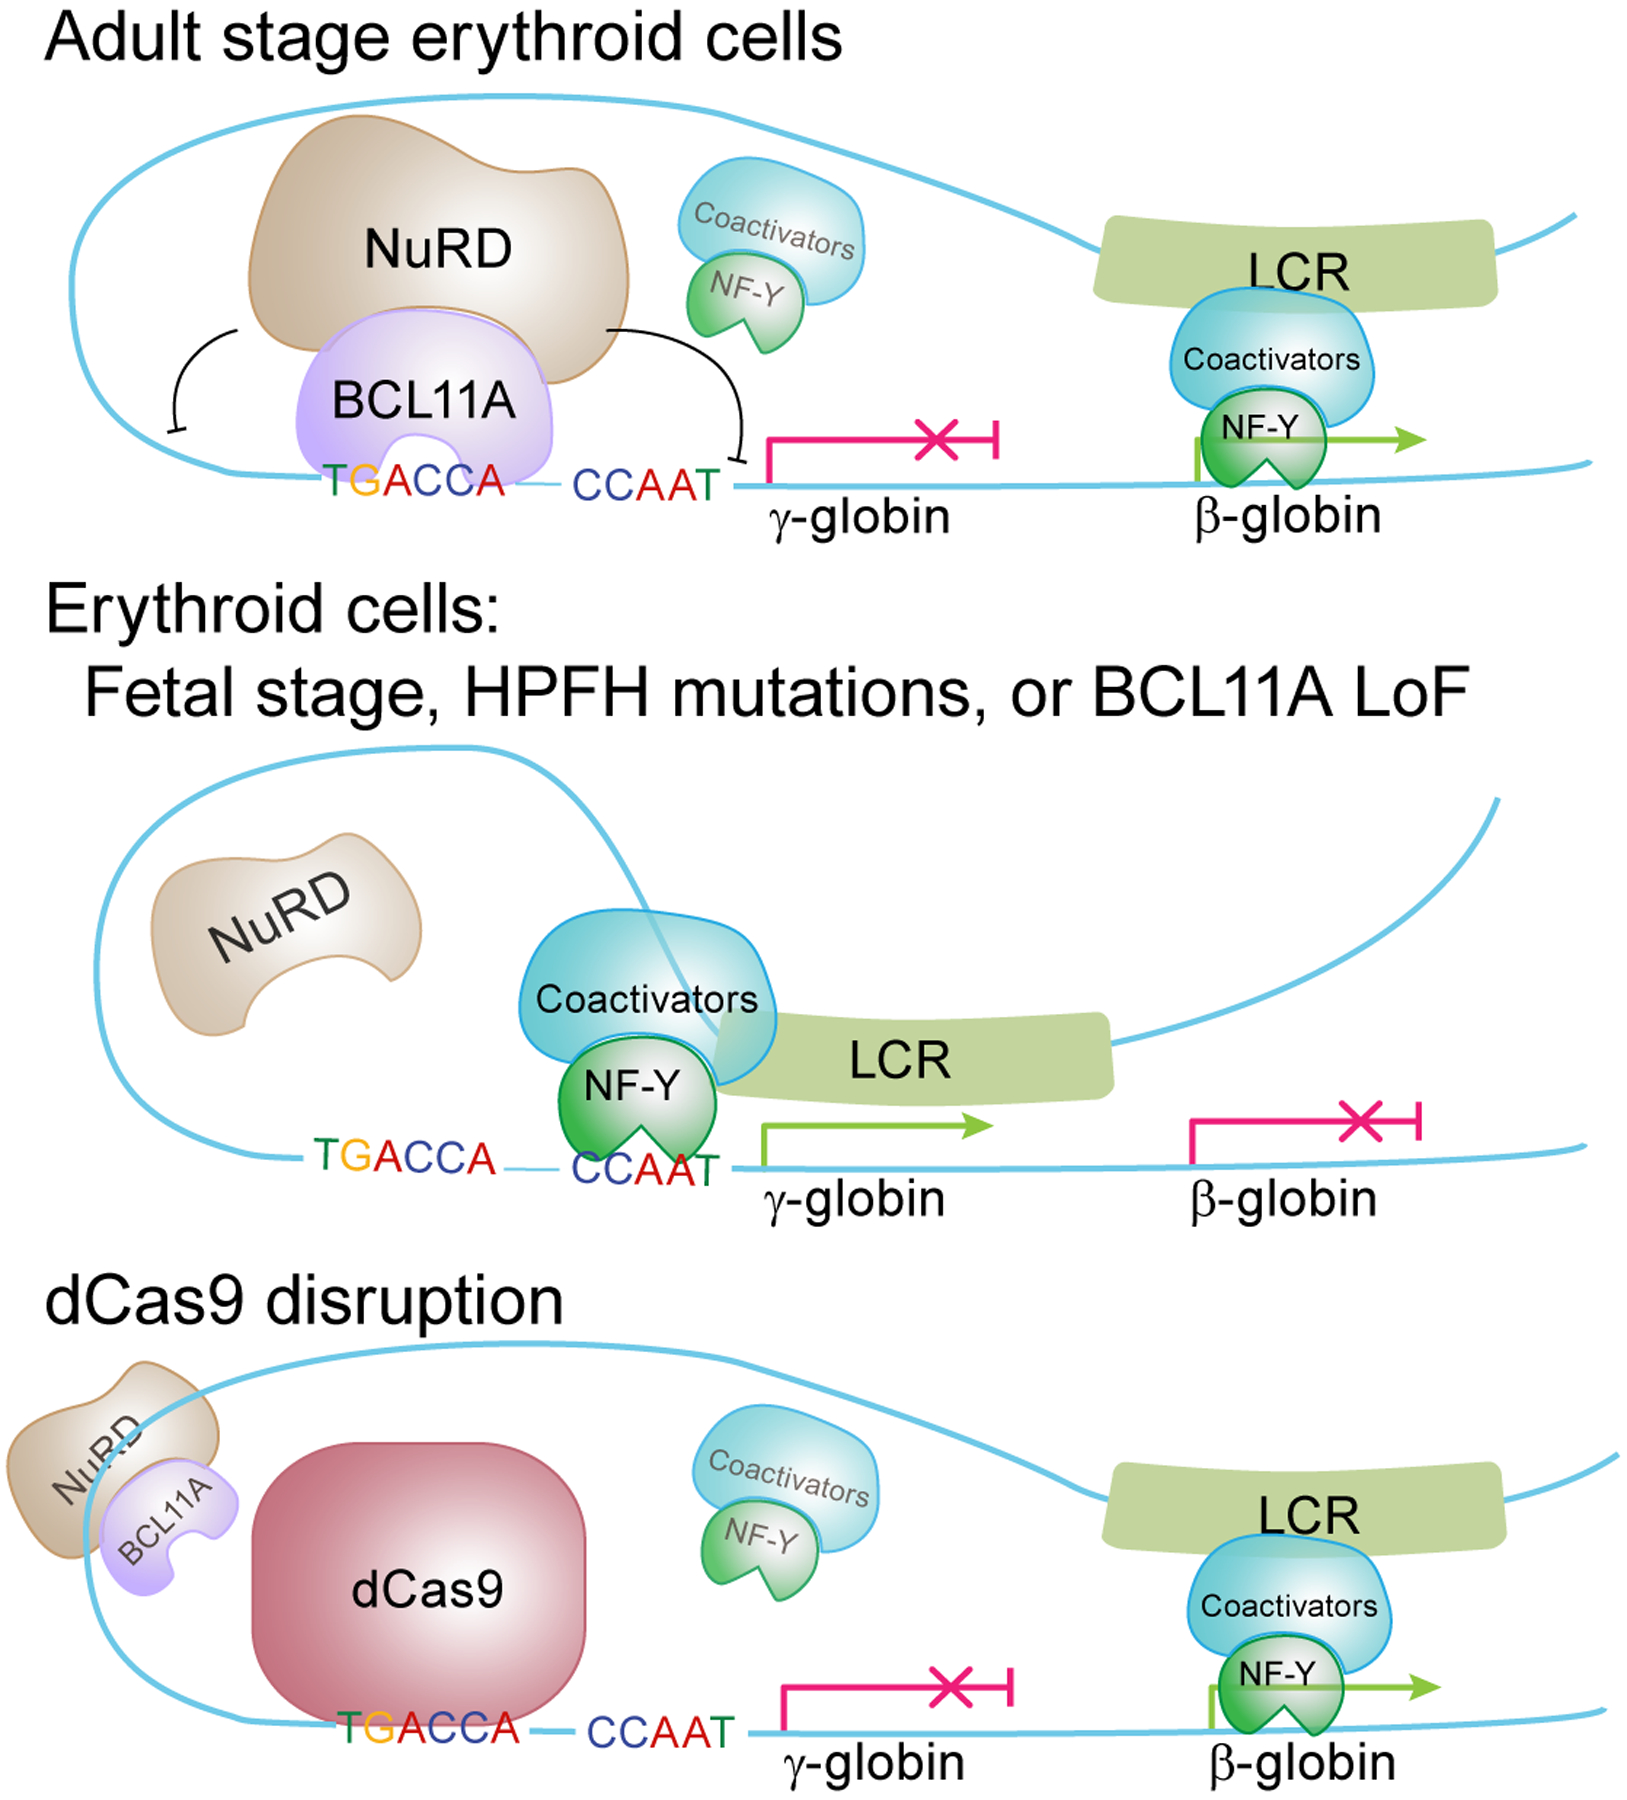
BCL11A, the major regulator of fetal hemoglobin (HbF, α2γ2) level, represses γ-globin expression through direct promoter binding in adult erythroid cells in a switch to adult hemoglobin (HbA, α2β2). To uncover how BCL11A initiates repression, we used CRISPR-Cas9, dCas9, dCas9-KRAB and dCas9-VP64 screens to dissect the γ-globin promoters and identified an activator element near the BCL11A-binding site. Using CUT&RUN and base editing, we demonstrate that a proximal CCAAT box is occupied by the activator NF-Y. BCL11A competes with NF-Y binding through steric hindrance to initiate repression. Occupancy of NF-Y is rapidly established following BCL11A depletion, and precedes γ-globin derepression and locus control region (LCR)-globin loop formation. Our findings reveal that the switch from fetal to adult globin gene expression within the >50-kb β-globin gene cluster is initiated by competition between a stage-selective repressor and a ubiquitous activating factor within a remarkably discrete region of the γ-globin promoters.


Conflict of interest statement

Competing interests

The authors declare no competing interests.

Figures

Extended Data Fig. 1
Extended Data Fig. 1. Dense perturbation of the β-globin locus
(a) Flow chart of the dense perturbation experiment design. (b) Zoomed in view of the dense perturbation results at HBB and HBD genes. gRNAs that target the exons are enriched in Cas9 experiment. HbF raw score is enrichment of individual gRNAs in HbF-high compared to unsorted population at end of erythroid maturation, plotted as log2 fold change. HbF score shows deconvoluted underlying genomic regulatory signal with corresponding p-values shown on −log10 scale. (c) Zoomed in view of the dense perturbation results at HBG1 gene. Not that gRNAs that target the exons are depleted in Cas9 experiment. (d) Zoomed in view of the dCas9 dense perturbation result at HS3 of the LCR aligned to PhastCons46way scores. The four regions highlighted in green contain GATA1 or GATA1-TAL1 composite motifs (CTG[N8–9]GATA), with the sequences shown below. (e) RT-qPCR showing that dCas9/sgRNA binding at −115 of γ-globin promoters reduced γ-globin expression in HUDEP-2 cells. Note that the γ-globin is only expressed at a basal level in cells expressing AAVS1 control sgRNA. The result is shown as mean (SD) of three technical replicates. Statistical tests of the beta coefficients were performed empirically through bootstrapping and two-tailed tests. Multiple hypothesis testing was accounted for with the Benjamini-Hochberg (BH) procedure.
Extended Data Fig. 2
Extended Data Fig. 2. NFYA binds to γ-globin promoters and is required for LCR-γ-globin interaction
(a) Left, western blot gel showing validation of NFYA knockdown efficiency (cropped). All three shRNAs tested showed efficient depletion of NFYA. Right, validation of NFYA knockdown efficiency at mRNA level using RT-qPCR. shRNA3 exhibited efficient knockdown of NFYA mRNA in all three cells tested and was used thereafter. The result is shown as mean (SD) of two technical replicates. (b) ChIP-seq tracks of NFYA in HUDEP-2, HUDEP-1, BCL11A KO HUDEP-2 cells with or without NFYA knockdown. (c) ChIP-qPCR validation of NFYA binding at the γ-globin promoters in HUDEP-1 and BCL11A KO HUDEP-2 cells. No strong binding was detected in HUDEP-2 cells which does not express γ-globin. The result is shown as mean (SD) of three technical replicates. (d) Chromosome Conformation Capture qPCR in BCL11A KO HUDEP-2 cells with or without NFYA knockdown. EcoRI fragment encompassing HS2–4 of the LCR was used as anchor point to evaluate LCR-globin interaction. The result is shown as mean (SD) of three technical replicates.
Extended Data Fig. 3
Extended Data Fig. 3. NF-Y binds to the proximal CCAAT in the γ-globin promoters
(a) Upper panel, heatmap comparison of NFYA ChIP-seq in HUDEP-2 cells, NFYA CUT&RUN in primary human CD34+ derived erythroid cells with or without NFYA knockdown. Lower panel, comparing the signal of the above three experiments at a representative genomic region. (b) Venn diagram showing the overlap between NFYA CUT&RUN and ChIP-seq peaks. (c) Motif analysis from 5000 random peaks of NFYA CUT&RUN identifies CCAAT as the highest ranked motif. E-value is reported by MEME. (d) Zoomed in view of BCL11A CUT&RUN in HUDEP-2 and NFYA CUT&RUN in BCL11A KO HUDEP-2 cells at the -globin promoters. Distal (−118 to −113) indicates the distal TGACCA motif that BCL11A binds, and proximal (−88 to −84) indicates the proximal CCAAT motif. (e) Single locus footprint of NF-Y at the CCNB1 promoter (upper) and CDK1 promoter (lower). Both CCAAT motifs show strong NF-Y footprints in the two promoters. (f) Single locus footprint of NF-Y at the γ-globin promoters in HUDEP-1 (upper), BCL11A KO adult CD34+ derived erythroid cells (middle) and cord blood CD34+ derived erythroid cells. Only the proximal motif shows NF-Y footprint.
Extended Data Fig. 4
Extended Data Fig. 4. Base editing of the BCL11A and NF-Y motif
(a) Left, split-intein mediated ligation of Cas9NG-Intein-N and Intein-C-AID, producing full-length Target-AID-NG. Blue arrow indicates the ligation sites. Right, immunoblot validating the expression of each component and the ligation products. The ligation is incomplete, but the level of ligated product is much higher than the original vector (cropped). (b) NFYA binding at the γ-promoters diminished in all the NF-Y motif-edited clones (red), and increased in all the BCL11A motif-edited clones (orange), as revealed by NFYA CUT&RUN. NF-Y motif editing was carried out in BCL11A KO HUDEP-2 cells while BCL11A motif editing was carried out in wild-type HUDEP-2 cells. (c) Upper, RT-qPCR analysis of γ-globin expression after acute depletion of C/EBPβ, C/EBPγ, CDP, NFIA and NFIC. Lower, immunoblot validating protein depletion (cropped). BCL11A KO HUDEP-2 cells were differentiated for 3 days after nucleofection. The result is shown as mean (SD) of three technical replicates. (d) Flow cytometry analysis of HbF levels for BCL11A base-edited clones at day 7 and 10. Longer editing resulted in higher base editing rate (Figure 3e) and higher percentage of HbF positive cells. (e) A control base editing experiment in which a nucleotide 9 bp away from the BCL11A motif was edited. Sanger sequencing confirmed C-T conversion. (f) Left, FACS of BCL11A motif base-edited bulk cells into high and low HbF populations. The C-T conversion rate of BCL11A motif in each population was measured by Sanger sequencing and quantified with TIDER. HbF high cells show 87% conversion and HbF low cells show only 7.4% conversion. (g) Left, flow cytometry analysis of HbF level in individual clones derived from BCL11A motif base editing. Data is showed as mean (SD) of multiple independent clones. Nonedit: n=23, base edited: n=30. Right, gating strategy. (h) Single locus footprint of NF-Y at the γ-promoters in clone A9d, a BCL11A motif-edited clone.
Extended Data Fig. 5
Extended Data Fig. 5. Acute depletion of BCL11A leads to rapid binding of NF-Y
(a) Schematic diagram of primary human CD34+ differentiation and acute depletion of BCL11A using CRISPR/Cas9. (b) Pairwise correlation of PRO-seq experiments. All the experiments in each time point showed high degree of correlation, indicating very minor transcriptional fluctuation upon BCL11A depletion. (c) Average PRO-seq signal at −200 to +600 bp relative to TSS exhibited promoter pausing of PolII. (d) Quantification of PRO-seq reads on HBG1/2 and HBB genes after 32 or 72 hrs of BCL11A acute depletion. The y-axis shows Reads Per Million (RPM) for HBG1+HBG2 or HBB. The result is shown as mean (SD) of two biologically independent samples (independent cell cultures and CRISPR KO). (e) CUT&RUN of TBP in CD34+ cells undergoing erythroid differentiation after 32 or 72 hrs of BCL11A acute depletion. The result shown is representative of two biological replicates. Quantification of KO/Ctrl and the corresponding p-values are reported by MAnorm. (f) Western blot for BCL11A and NFYA in adult primary human CD34+ derived erythroid cells upon KO of NFYA, BCL11A or both (cropped). (g) RT-qPCR analysis of γ-globin expression in adult primary human CD34+ derived erythroid cells upon KO of NFYA, BCL11A or both. Knockout of NFYA after 72 hours decreases γ-globin expression. The result is shown as mean (SD) of three technical replicates. (h) Chromosome Conformation Capture qPCR in adult primary human CD34+ derived erythroid cells, comparing BCL11A KO and BCL11A/NF-Y double KO. EcoRI fragment encompassing HS2–4 of the LCR was used as anchor point to evaluate LCR-globin interaction. The result is shown as mean (SD) of three technical replicates.
Figure 1.
Figure 1.. dCas9 dense perturbation reveals an activator element at the γ-globin promoters
(a) Dense perturbation of genomic sequences around the β-globin gene cluster by pooled gRNA library in Cas9, dCas9, dCas9-KRAB or dCas9-VP64 expressing HUDEP-2 cells. gRNA enrichment in HbF-high cells was used to deconvolute underlying genomic regulatory signal (with “HbF” track displaying beta coefficient). Corresponding p-values are shown on −log10 scale. (b) A zoomed-in view of the dense perturbation results at the γ-globin (HBG1) promoter and first exon. “HbF raw” scores were calculated as enrichment of reads for each sgRNA in HbF-high compared to the unsorted population at end of erythroid maturation (shown as log2 fold change). “HbF” track depicts the deconvoluted regulatory signal as beta coefficient with associated p-values below. Minor ticks indicate value of zero. The result at the HBG2 promoter was the same as the sequences share 99.3% identity. (c) Schematic structure of γ-globin promoters. The binding sites of LRF/ZBTB7A, BCL11A, and TBP are indicated. Sequence conservation of HBG1 and HBG2 promoters across 46 vertebrates (phastCons46way) are shown as cyan and orange lines, respectively. Two CCAAT boxes that are potential binding sites of NF-Y are highlighted in red. The distal TGACCA motif through which BCL11A represses γ-globin expression is delineated with a rectangle. Statistical tests of the beta coefficients were performed empirically through bootstrapping and two-tailed tests. Multiple hypothesis testing was accounted for with the Benjamini-Hochberg (BH) procedure.
Figure 2.
Figure 2.. NF-Y activates γ-globin through direct binding to the proximal CCAAT
(a) RT-qPCR analysis of γ-globin expression in HUDEP-2, HUDEP-1, BCL11A KO HUDEP-2 cells with and without NFYA knockdown. The result is shown as mean (SD) of two technical replicates and representative of two biological replicates. HPRT1 was used throughout as an endogenous control to normalize between samples. (b) Chromosome Conformation Capture qPCR in HUDEP-1 cells with or without NFYA knockdown to evaluate LCR-globin interaction. EcoRI fragment encompassing HS2–4 of the LCR was used as anchor point. Each grey box indicates a restriction fragment. The result is shown as mean (SD) of three technical replicates. (c) NFYA CUT&RUN in HUDEP-2, HUDEP-1, BCL11A KO HUDEP-2 cells and in primary human CD34+ cells derived erythroid cells (four lower tracks are: adult, adult with BCL11A knockdown, fetal, and adult with NFYA knockdown). CUT&RUN tracks in HUDEP cells are representatives of multiple biological replicates. CUT&RUN in CD34+ cells with CRISPR editing yielded similar results (see Figure 4). (d) Motif footprint analysis of NFYA CUT&RUN. (Upper) Average cut probability of each base surrounding and within CCAATVR motifs was plotted. The core CCAAT motif lies within the dashed lines. Motif flanking regions (7 bp upstream and 11 bp downstream) are shaded red and were protected from nuclease digestion. (Lower) Heat map of NF-Y footprints at all the NF-Y peaks with a log-odds higher than 20. Each row represents one NF-Y binding site, ranked by log-odds value. Color key is shown at the bottom. (e) Structure of NF-Y/DNA complex adapted from and generated with PyMOL. Note that DNA bending is induced by NF-Y binding and flanking sequences are wrapped around NF-Y through histone-fold domains of NFYB and NFYC. NFYA is responsible for motif recognition. (f) Single locus cut profile at the γ-globin promoters, generated using NFYA CUT&RUN in BCL11A KO HUDEP-2 cells. The proximal CCAAT motif but not the distal one revealed a footprint of NF-Y. The log-odds of NF-Y binding are labeled.
Figure 3.
Figure 3.. Base editing of the NF-Y motif reduces γ-globin expression
(a) Sanger sequencing confirmed base editing of the NF-Y motif in the γ-globin promoters. Quantification of editing efficiency is shown as bar graph on the right. The editing is performed in BCL11A KO HUDEP-2 cells. (b) RT-qPCR showing the γ-globin expression level in bulk cells after NF-Y motif editing. The result is shown as mean (SD) of three technical replicates. (c) RT-qPCR analysis of γ-globin expression in multiple independent clones derived from NF-Y motif base editing. Data is showed as mean (SD) of multiple independent clones. Nonedit: n=6, base edited: n=27. Two-tailed, unpaired t-test, t=4.010, df=32. Clone B6p (circled) was used for CUT&RUN analysis in Figure 3d. (d) NFYA CUT&RUN in BCL11A KO HUDEP-2, NF-Y motif edit clone B6p (in BCL11A KO background), HUDEP-2, and BCL11A motif edit clone A9d (wild-type background). (e) Sanger sequencing confirmed base editing of the BCL11A motif in the γ-globin promoters. Quantification of editing frequency is shown as bar graph on the right. The editing is performed in wild-type HUDEP-2 cells. (f) RT-qPCR showing the γ-globin expression level in bulk cells after BCL11A motif editing. Cells collected at different time points showed different degrees of editing. The result is shown as mean (SD) of three technical replicates. C-T conversion rates are shown as the right y-axis. (g) RT-qPCR analysis of γ-globin expression in multiple independent clones derived from BCL11A motif base editing. Data is showed as mean (SD) of multiple independent clones. Nonedit: n=23, base edited: n=30. Two-tailed, unpaired t-test, t=17.11, df=51. Clone A9d (circled) was used for CUT&RUN analysis in Figure 3d.
Figure 4.
Figure 4.. NF-Y rapidly activates γ-globin after acute depletion of BCL11A
(a) Left, western blot showing the level of BCL11A after CRISPR/Cas9 mediated acute BCL11A KO at different time points in adult primary human CD34+ cells undergoing erythroid differentiation (cropped). Right, quantification of BCL11A depletion of the left experiment using ImageJ. The result is a representative of two biological replicates. The control cells were edited with AAVS1 sgRNA. (b) RT-qPCR analysis of γ-globin expression level at different time points after acute depletion of BCL11A. Data is showed as mean (SD) of three technical replicates. (c) Scatter plot of PRO-seq data at 32 hrs (left) and 72 hrs (right) after acute depletion of BCL11A. The x-axis represents log2RPM (reads per million) of each gene in control experiments (AAVS1) and the y-axis represents log2RPM of each gene in BCL11A KO experiments. Each dot represents a gene. Globin genes are enlarged and highlighted in blue circles. Genes that are significantly different between control and KO (log2FC(KO/Ctrl) <−1 or >1) are highlighted in red. The results are shown as means of two biological replicates. (d) PRO-seq tracks at the β-globin locus. Transcripts of positive and negative strands are shown in different colors. γ-globin remained repressed in BCL11A KO at 32 hrs. Derepression became evident at 72 hrs, as highlighted in green. (e,f) NFYA CUT&RUN (e) and ATAC-seq (f) in CD34+ cells undergoing erythroid differentiation after 32 or 72 hrs of BCL11A acute depletion. Quantification of KO/Ctrl and the corresponding p-values are reported by MAnorm. (g) Chromosome Conformation Capture qPCR in CD34+ cells undergoing erythroid differentiation after 32 (upper) or 72 (lower) hrs of BCL11A acute depletion. EcoRI fragment encompassing HS2–4 of the LCR was used as anchor point to evaluate LCR-globin interaction. The result is shown as mean (SD) of three technical replicates and is a representative of two biological replicates.
Figure 5.
Figure 5.. NF-Y binding is affected by steric hindrance at the γ-globin promoters
(a) The sequence of γ-globin promoters. The eight sgRNAs used for dCas9 disruption experiment are shown below the sequence and color coded. The numbers (−208, etc) represent the distances between TSS and positions of the 17th nucleotide of each sgRNA. The position of LRF, BCL11A and NF-Y motifs are labeled in red. The flanking sequences of NF-Y motif is also involved in NF-Y binding. (b) Right, RT-qPCR analysis of the percentage of γ-globin in BCL11A KO HUDEP-2 cells expressing dCas9 with different sgRNAs. Data is showed as mean (SD) of three technical replicates and a representative of two biological replicates. Left, NFYA CUT&RUN in these cells. The cartoon indicates the deduced protein binding at the promoters.
Figure 6.
Figure 6.. A simplified model for hemoglobin switching
Competitive binding between NF-Y and BCL11A controls hemoglobin switching. In fetal stage erythroid cells, or cells with HPFH mutations or lacking BCL11A, NF-Y binds to the γ-globin promoters and activates expression. In adult stage erythroid cells, BCL11A prevents NF-Y binding and represses γ-globin in concert with NuRD. LRF/ZBTB7A independently recruits NuRD and represses γ-globin through binding to the −200 bp region of the γ-globin promoters (not illustrated in the model). dCas9 binding at the BCL11A motif is sufficient to disrupt NF-Y binding and repress γ-globin expression. When γ-globin is silenced, NF-Y may bind to β-globin and regulate its expression. Other known positive regulators of β-globin including GATA1, KLF1, LDB1, etc are not shown.

References

    1. Hay D et al. Genetic dissection of the α-globin super-enhancer in vivo. Nat. Genet 48, 895–903 (2016). - PMC - PubMed
    1. Carter D, Chakalova L, Osborne CS, Dai Y & Fraser P Long-range chromatin regulatory interactions in vivo. Nat. Genet 32, 623–626 (2002). - PubMed
    1. Tolhuis B et al. Looping and interaction between hypersensitive sites in the active beta-globin locus. Mol. Cell 10, 1453–65 (2002). - PubMed
    1. Palstra RJ et al. The β-globin nuclear compartment in development and erythroid differentiation. Nature Genetics vol. 35 190–194 (2003). - PubMed
    1. Chada K, Magram J & Costantini F An embryonic pattern of expression of a human fetal globin gene in transgenic mice. Nature 319, 685–689 (1986). - PubMed

Publication types

MeSH terms