

Adaptive mesh refinement and coarsening for diffusion-reaction epidemiological models
- PMID: 33649692
- PMCID: PMC7905202
- DOI: 10.1007/s00466-021-01986-7
Adaptive mesh refinement and coarsening for diffusion-reaction epidemiological models
Abstract
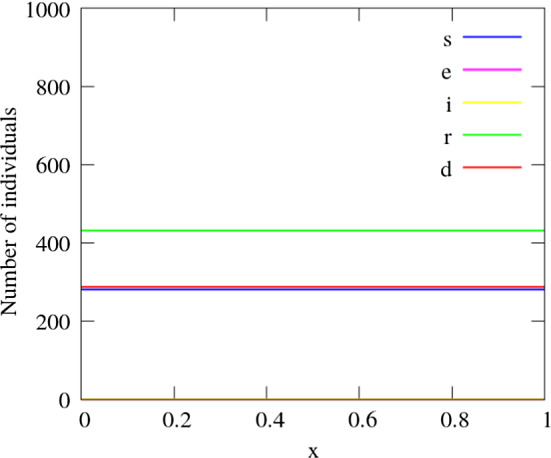
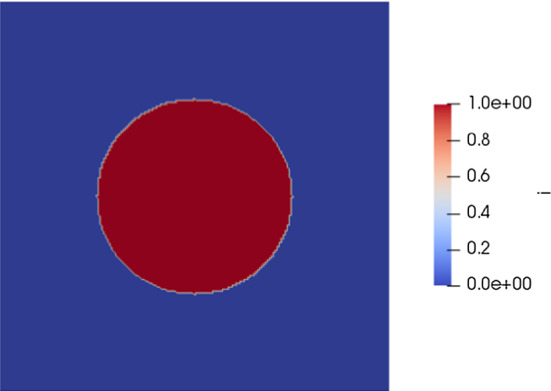
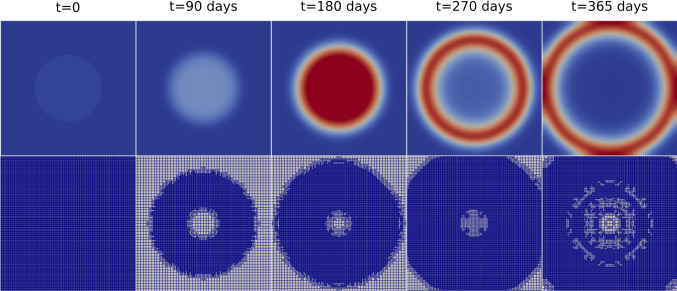
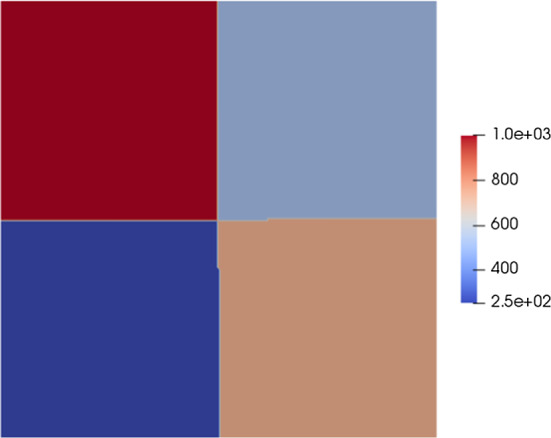
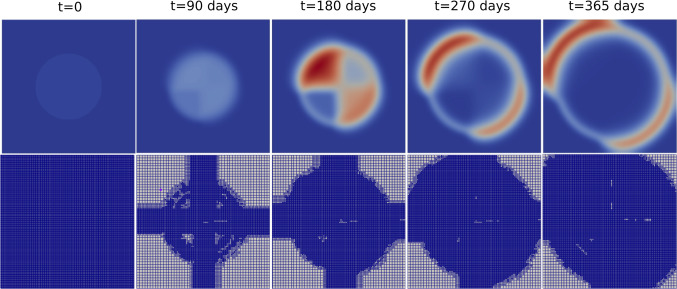
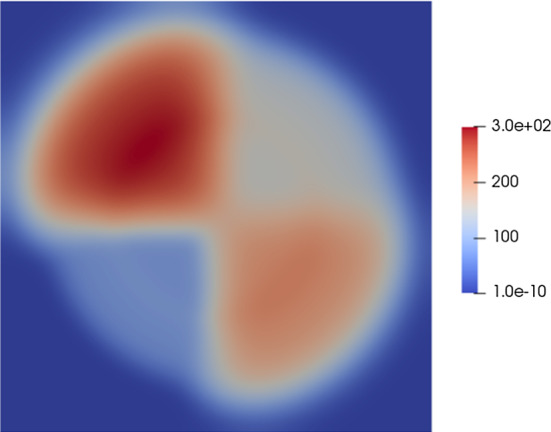
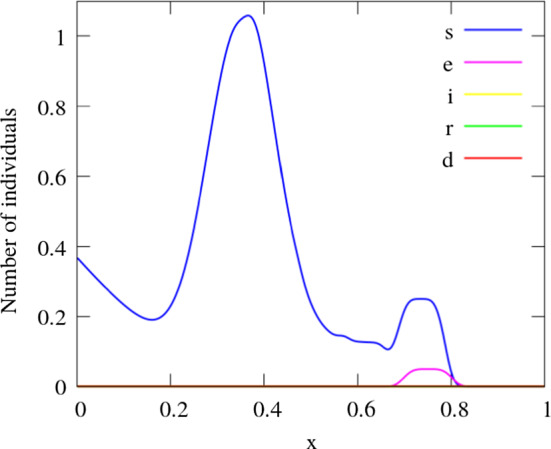
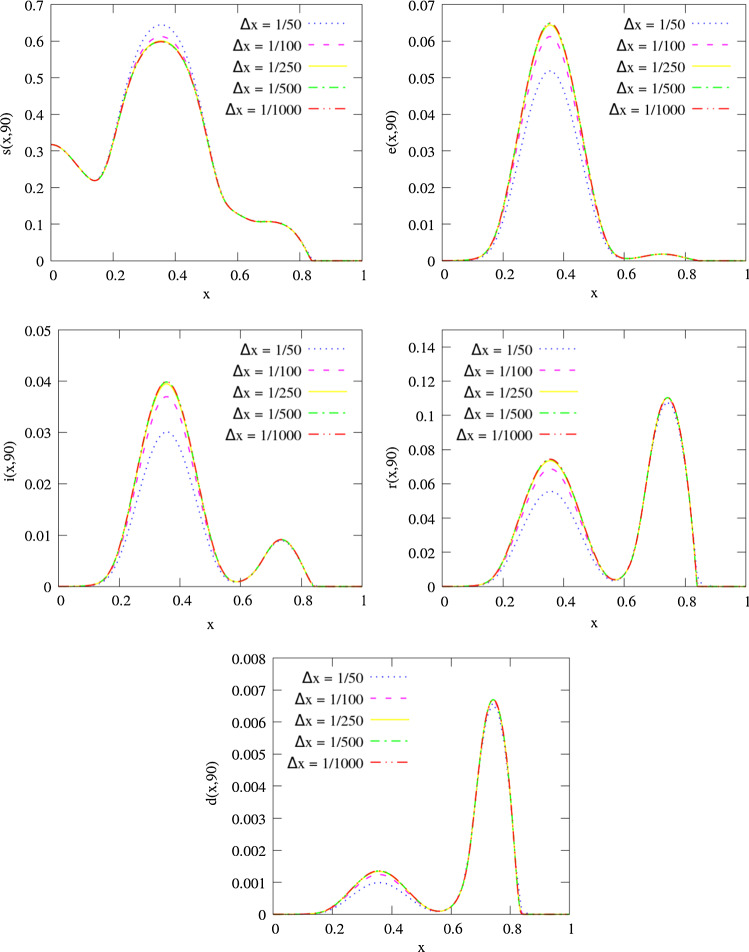
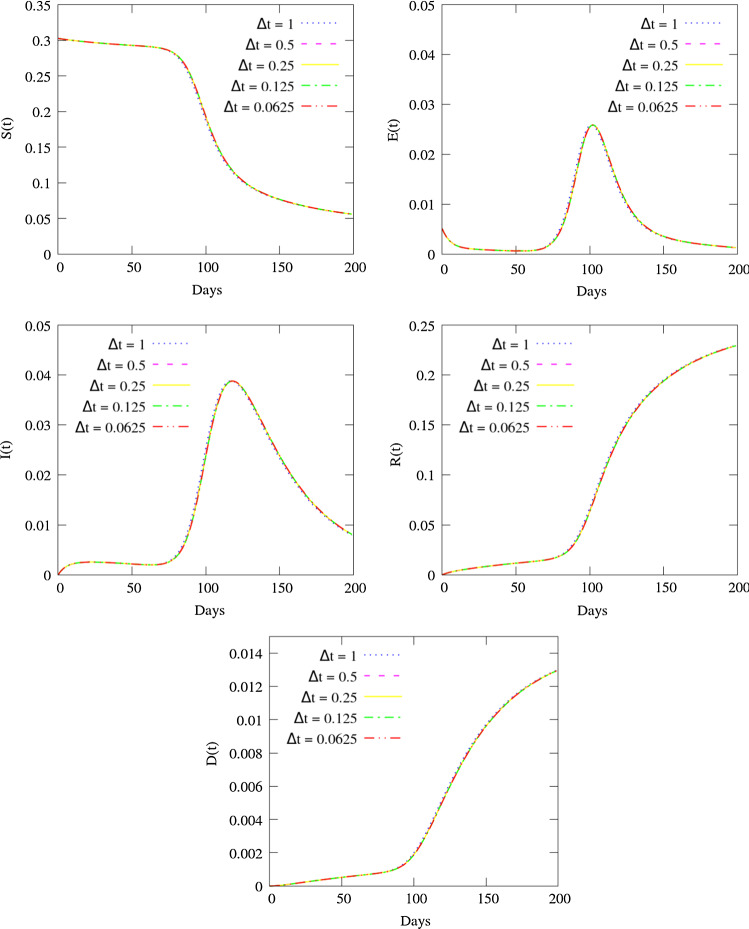
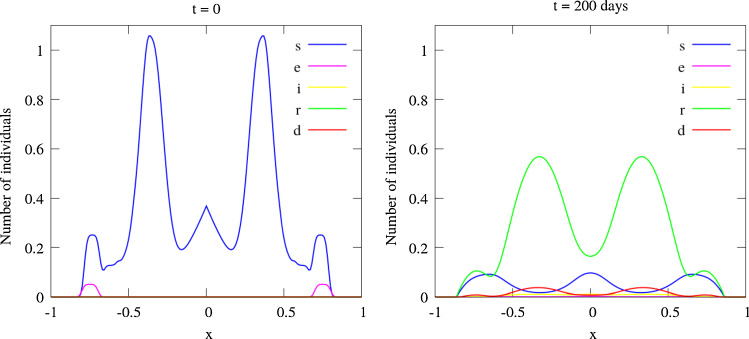
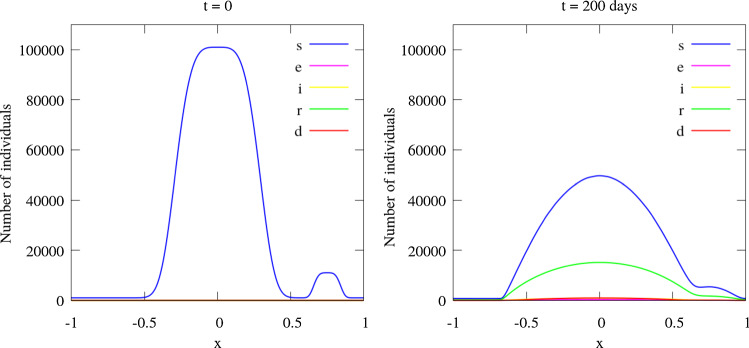
The outbreak of COVID-19 in 2020 has led to a surge in the interest in the mathematical modeling of infectious diseases. Disease transmission may be modeled as compartmental models, in which the population under study is divided into compartments and has assumptions about the nature and time rate of transfer from one compartment to another. Usually, they are composed of a system of ordinary differential equations in time. A class of such models considers the Susceptible, Exposed, Infected, Recovered, and Deceased populations, the SEIRD model. However, these models do not always account for the movement of individuals from one region to another. In this work, we extend the formulation of SEIRD compartmental models to diffusion-reaction systems of partial differential equations to capture the continuous spatio-temporal dynamics of COVID-19. Since the virus spread is not only through diffusion, we introduce a source term to the equation system, representing exposed people who return from travel. We also add the possibility of anisotropic non-homogeneous diffusion. We implement the whole model in libMesh, an open finite element library that provides a framework for multiphysics, considering adaptive mesh refinement and coarsening. Therefore, the model can represent several spatial scales, adapting the resolution to the disease dynamics. We verify our model with standard SEIRD models and show several examples highlighting the present model's new capabilities.
Keywords: Adaptive mesh refinement and coarsening; COVID-19; Compartmental models; Diffusion–reaction; Partial differential equations.
© The Author(s), under exclusive licence to Springer-Verlag GmbH, DE part of Springer Nature 2021.
Figures


References
-
- Ainsworth M, Oden JT. A posteriori error estimation in finite element analysis. New York: Wiley; 2011.
-
- Alnæs MS, Blechta J, Hake J, Johansson A, Kehlet B, Logg A, Richardson C, Ring J, Rognes ME, Wells GN. The fenics project version 1.5. Arch Numer Soft. 2015 doi: 10.11588/ans.2015.100.20553. - DOI
-
- Balay S, Abhyankar S, Adams MF, Brown J, Brune P, Buschelman K, Dalcin L, Dener A, Eijkhout V, Gropp WD, Karpeyev D, Kaushik D, Knepley MG, May DA, McInnes LC, Mills RT, Munson T, Rupp K, Sanan P, Smith BF, Zampini S, Zhang H, Zhang H (2019) PETSc Web page. https://www.mcs.anl.gov/petsc
-
- Bangerth W, Hartmann R, Kanschat G. Deal. II—a general-purpose object-oriented finite element library. ACM Trans Math Softw. 2007;33(4):24.
LinkOut - more resources
Full Text Sources
Other Literature Sources