. 2021 Apr;45(4):42.
doi: 10.3892/or.2021.7993. Epub 2021 Mar 2.

STK31 upregulation is associated with chromatin remodeling in gastric cancer and induction of tumorigenicity in a xenograft mouse model

Affiliations

STK31 upregulation is associated with chromatin remodeling in gastric cancer and induction of tumorigenicity in a xenograft mouse model

Dong Hyuck Bae et al. Oncol Rep. 2021 Apr.

Abstract

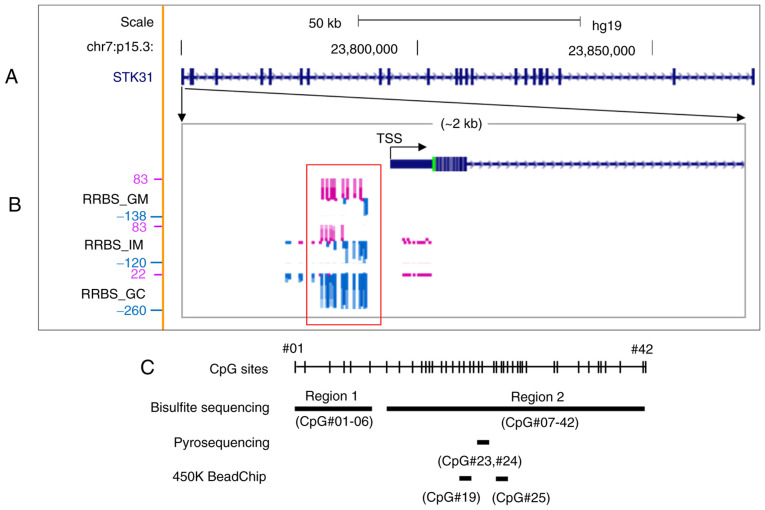
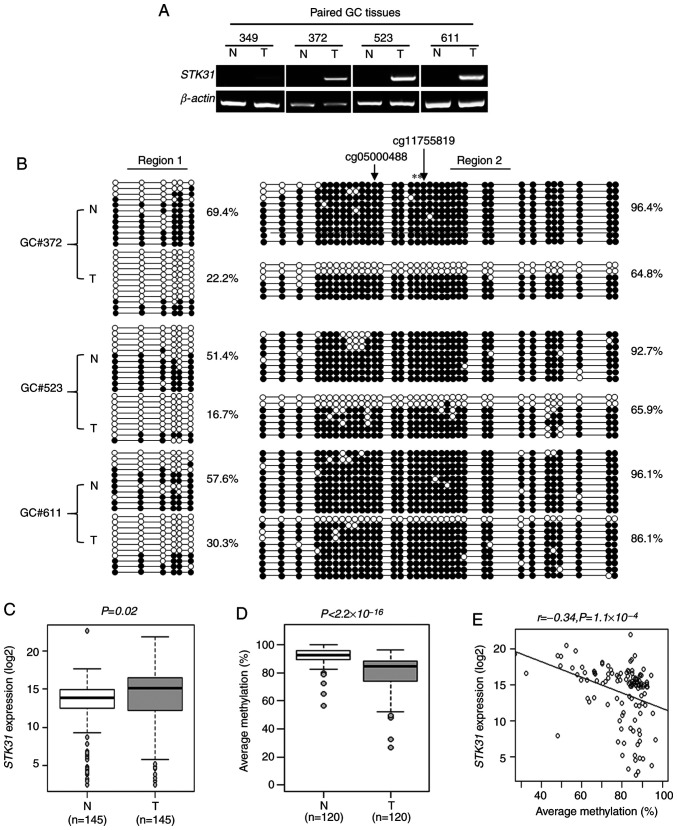
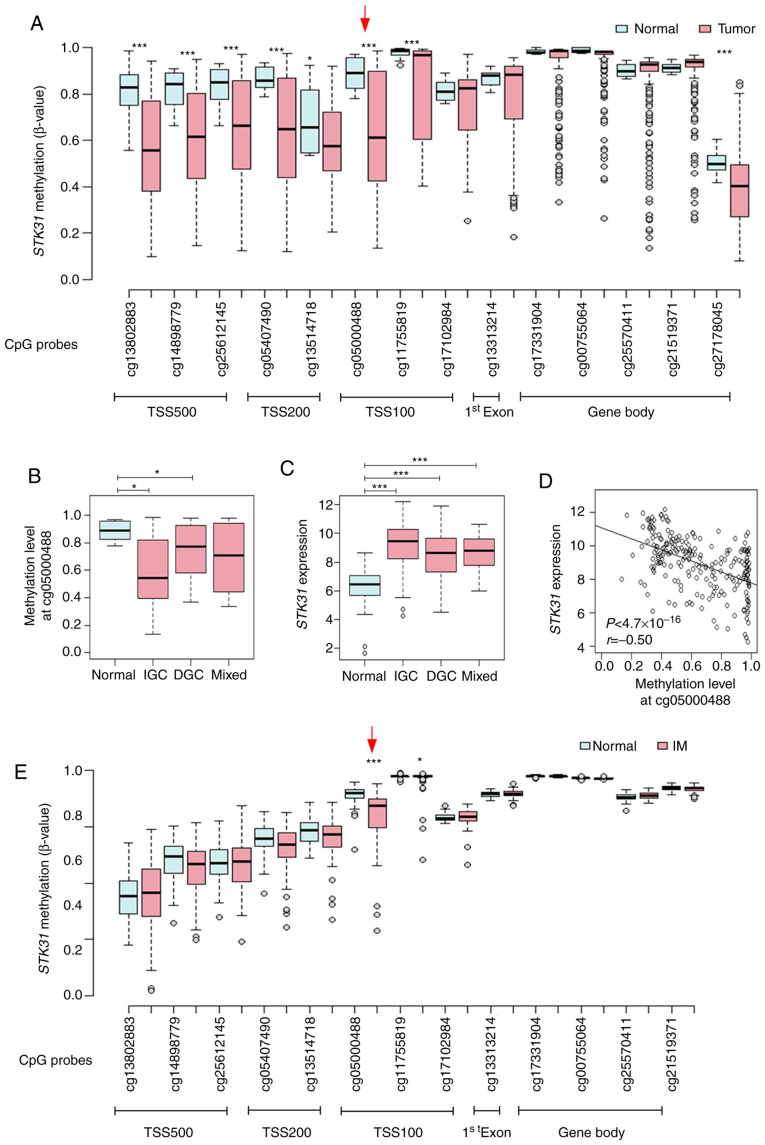
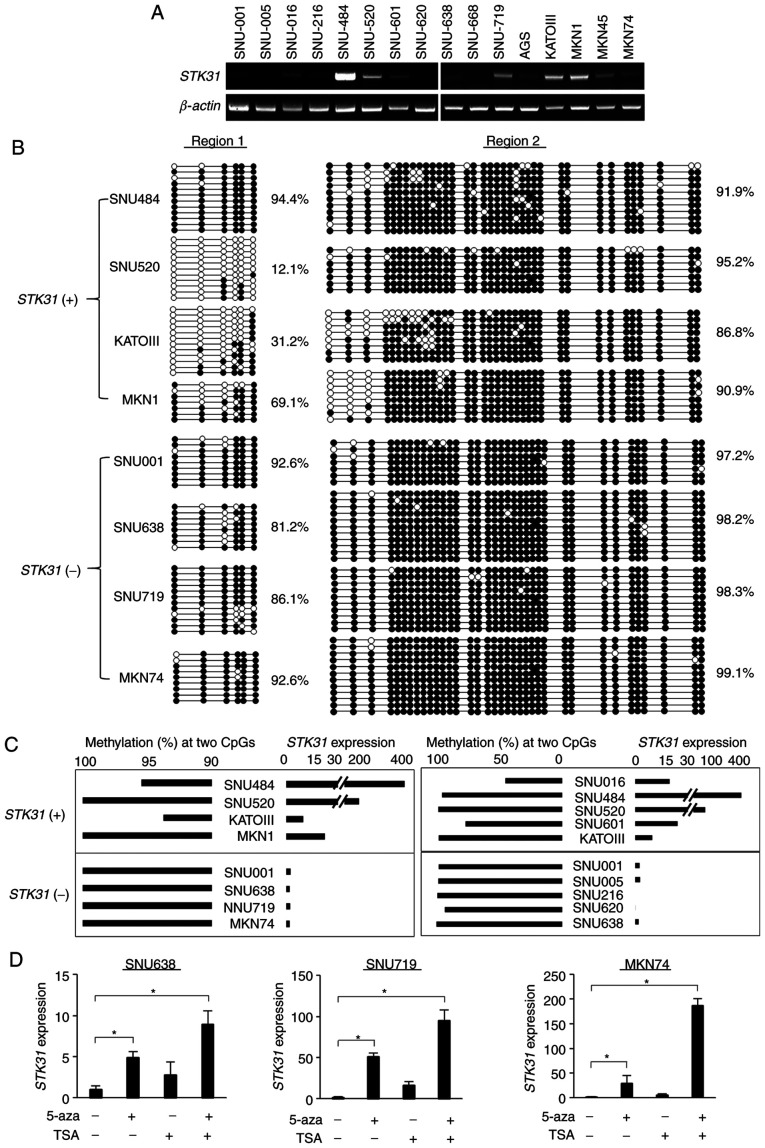
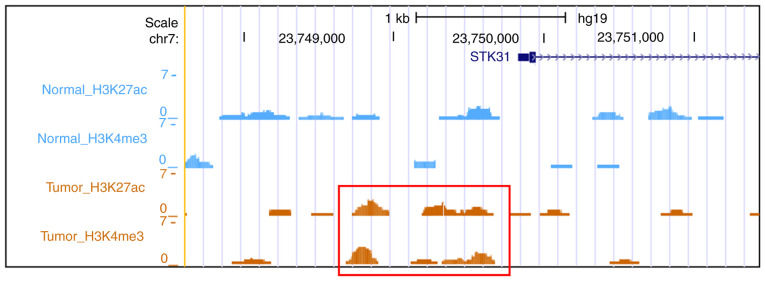
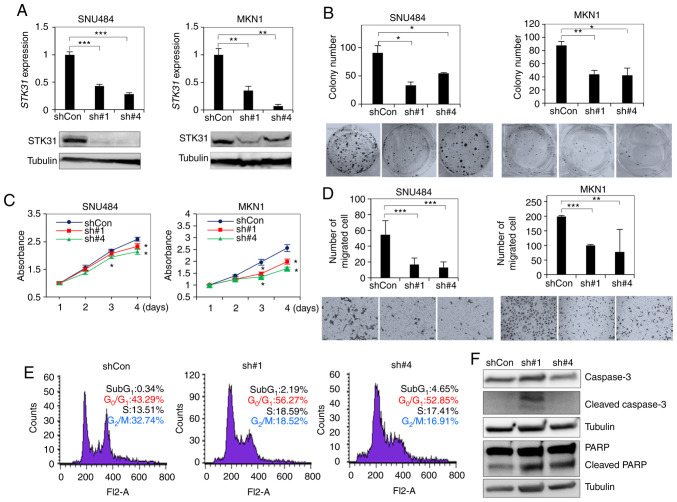
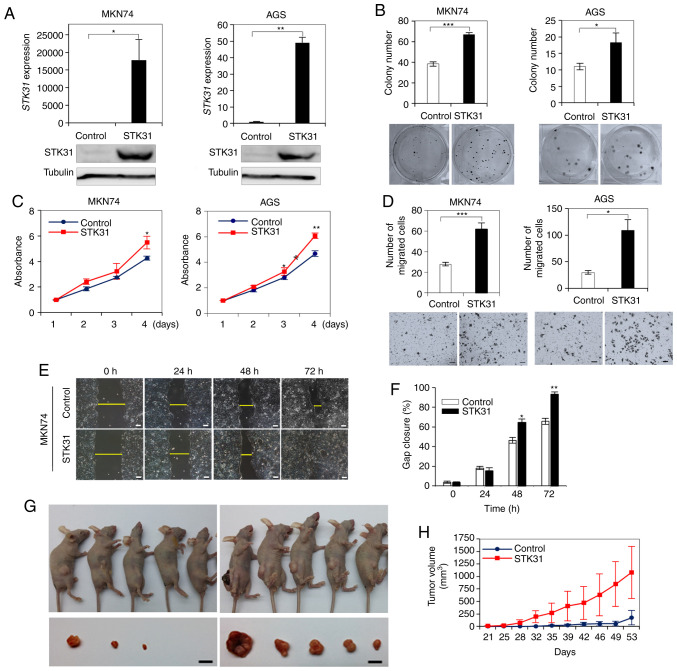
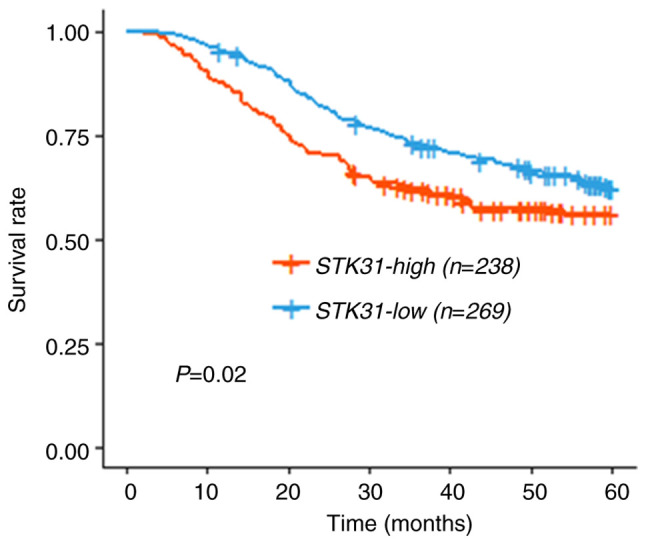
Pathological changes in the epigenetic landscape of chromatin are hallmarks of cancer. Our previous study showed that global methylation of promoters may increase or decrease during the transition from gastric mucosa to intestinal metaplasia (IM) to gastric cancer (GC). Here, CpG hypomethylation of the serine/threonine kinase STK31 promoter in IM and GC was detected in a reduced representation bisulfite sequencing database. STK31 hypomethylation, which resulted in its upregulation in 120 cases of primary GC, was confirmed. Using public genome‑wide histone modification data, upregulation of STK31 promoter activity was detected in primary GC but not in normal mucosae, suggesting that STK31 may be repressed in gastric mucosa but activated in GC as a consequence of hypomethylation‑associated chromatin remodeling. STK31 knockdown suppressed the proliferation, colony formation and migration activities of GC cells in vitro, whereas stable overexpression of STK31 promoted the proliferation, colony formation, and migration activities of GC cells in vitro and tumorigenesis in nude mice. Patients with GC in which STK31 was upregulated exhibited significantly shorter survival times in a combined cohort. Thus, activation of STK31 by chromatin remodeling may be associated with gastric carcinogenesis and also may help predict GC prognosis.

Keywords: serine/threonine kinase 31; gastric cancer; DNA hypomethylation; chromatin remodeling; prognosis.


Conflict of interest statement

The authors declare that they have no competing interests.

Figures

Figure 1.
Figure 1.
Methylation profile of the STK31 promoter in cells of a clinical tissue isolated by laser capture microdissection. (A) Gene structure of STK31 on human chromosome 7p15.3. The map was modified from the UCSC Genome Browser (hg19, genome.ucsc.edu). The distance from TSS to transcription end site is ~122.4 kb. Thick black bars denote exons. (B) RRBS methylome profiles in an enlargement of the STK31 promoter region (~2 kb) in paired GM, IM and GC cells by mirroring the UCSC Genome Browser. The height of each vertical line indicates methylation score for individual CpGs. Methylation and non-methylation scores are displayed as purple and blue bars, respectively. The red rectangle highlights differentially methylated region in GM compared with IM or GC. (C) Strategy for analysis. Bisulfite sequencing was performed for Regions 1 (6 CpGs, −386 to −198 nucleotides from TSS) and 2 (39 CpGs, −171 to 249 nucleotides). Pyrosequencing was performed for CpG#23 (+54 nucleotidea from TSS) and #24 (+58 from TSS). Positions of CpG probes CpG#19 (cg05000488, −46 from TSS) and CpG#25 (cg11755819, +67 from TSS) are shown, proximal to the STK31 TSS from 450K HumanMethylation BeadChip. STK, serine/threonine kinase; TSS, transcription start site; RRBS, reduced representation bisulfite sequencing; GM, gastric mucosa; IM, intestinal metaplasia; GC, gastric cancer.
Figure 2.
Figure 2.
STK31 expression and bisulfite sequencing analysis of clinical tissue samples. (A) RT-qPCR analysis of STK31 in four paired gastric T and N tissue samples. β-actin was used as an internal control. (B) Bisulfite sequencing analysis was performed with three paired GC and N tissue samples. Black and white circles indicate methylated and non-methylated CpG sites, respectively. Each row represents a single clone. Mean percentages of CpG sites methylated in each sample are shown. Asterisks indicate CpG sites (CpG#23 and #24) used for pyrosequencing. Arrows indicate CpG probes from 450K BeadChip. (C) STK31 expression in 145 paired N and GC samples from the CNUH cohort. RT-qPCR was performed and expression levels were normalized to β-actin. (D) STK31 methylation in paired samples from the CNUH cohort. Pyrosequencing was performed at two CpG sites. The average value for methylation was calculated for each sample. (E) Pearson's correlation analysis between STK31 methylation and expression levels in the CNUH cohort. STK, serine/threonine kinase; RT-q, reverse transcription-quantitative; T, tumor; N, non-tumor; CNUH, Chungnam National University Hospital.
Figure 3.
Figure 3.
Correlation between STK31 promoter methylation and expression levels in primary gastric tumors or STK31 promoter methylation in IM from the public database. (A) Methylation status at CpG sites proximal to the STK31 promoter. β-values at 14 CpG sites from TSS500, TSS200, TSS100, exon 1 and the gene body were retrieved from 450K HumanMethylation BeadChip data for 29 gastric mucosa samples (normal) and 214 gastric tumors including IGC (n=140), DGC (n=57) and mixed-type GC (n=17) from the TCGA database. Red arrow indicates cg05000488, the CpG site in TSS100 at which correlation with STK31 expression levels was examined. (B) STK31 methylation status at cg05000488 was examined in normal tissue, IGC, DGC and mixed-type GC. P-values were determined using the Wilcoxon rank-sum test and corrected for multiple comparisons by Bonferroni method (n=3). (C) STK31 expression was examined. Pairwise P-values were calculated using Student's t-test and corrected for multiple comparisons by Bonferroni method (n=3). (D) Pearson's correlation analysis between methylation at cg05000488 and STK31 expression levels in the TCGA cohort. (E) Methylation status at CpG sites proximal to the STK31 promoter in IM. β-values at 13 CpG sites were retrieved from 450K BeadChip data for 39 normal and 76 IM samples from public data GSE103186 (17). P-values were determined using Student's t-test. *P<0.05, ***P<0.001. STK, serine/threonine kinase; IM, intestinal metaplasia; TSS, transcription start site; IGC, intestinal-type gastric cancer; DGC, diffuse-type gastric cancer; TCGA, The Cancer Genome Atlas.
Figure 4.
Figure 4.
STK31 expression and bisulfite sequencing analysis of GC cell lines. (A) RT-qPCR analysis of 16 GC cell lines. (B) Analysis of bisulfite sequencing. A total of eight GC cell lines were categorized based on relative STK31 expression (determined by RT-qPCR) as strong (+) or weak/silenced (−). (C) Association between STK31 expression and mean methylation at CpG#23 and #24. Methylation status was based on bisulfite sequencing and pyrosequencing analysis. (D) Restoration of STK31 mRNA levels following treatment with 5-aza and/or TSA. STK31 expression levels were assessed by RT-qPCR and normalized to β-actin. Data are presented as the mean ± SD of three independent experiments. Pairwise P-values were calculated using Student's t-test and corrected for multiple comparison by Bonferroni method. *P<0.05. STK, serine/threonine kinase; GC, gastric cancer; RT-q, reverse transcription-quantitative; 5-aza, 5-aza-2-deoxycytidine; TSA, trichostatin A.
Figure 5.
Figure 5.
Histone modifications at STK31 promoters in paired normal and GC tissue. Public data for histone modifications in paired tissue, as determined by nano-scale chromatin immunoprecipitation-sequencing (22), were downloaded and processed. H3K4me3 and H3K27ac peak regions from five paired normal and gastric tumor tissue samples were merged and visualized with the UCSC Genome Browser (hg19). Red rectangle highlights gain of promoter activity with increased H3K27ac and H3K4me3 at each promoter in primary GC. STK, serine/threonine kinase; GC, gastric cancer.
Figure 6.
Figure 6.
In vitro assay of STK31 expression levels in STK31-KD cells. (A) Establishment of STK31-KD cells by expression of shRNA. SNU484 and MKN01 cells were transfected with either of two lentiviral STK31 shRNAs (sh#1, sh#4) or scrambled-sequence shCon and cultured for 2 weeks. KD and control cells were compared by reverse transcription-quantitative PCR and western blotting. Tubulin was used as an internal control. (B) Colony formation assay. Transfected cells were plated on 6-well plates at 1×10³ cells per well. After 2 weeks, colonies were stained with crystal violet and counted. (C) Relative viability of STK31-KD cells over 4 days was measured using EZ-Cytox Cell Viability Assay kit and compared with empty vector control (PLKO). (D) Migration assay. Transfected cells were plated on Transwell chambers at 2×10⁴ cells per well. After 18–22 h, Transwell membranes were stained with crystal violet and cells were counted. (E) Cell cycle analysis of STK31-KD MKN1 cells. Following PI staining, cells were assessed by flow cytometry. (F) Western blot analysis of caspase-3 and PARP cleavage in MKN1 cells. Two membranes were used for PARP and Caspase-3. Pairwise P-values were calculated using Student's t-test and corrected for multiple comparison by Bonferroni method (n=2). *P<0.05, **P<0.01, ***P<0.001. STK, serine/threonine kinase; KD, knockdown; sh, short hairpin; Con, control.
Figure 7.
Figure 7.
In vitro and in vivo assay of STK31 expression in cells ectopically expressing STK31. (A) Establishment of STK31-expressing cells. Gastric cancer cell lines MKN74 and AGS were transfected with lentiviral STK31-expression vector. STK31 mRNA and protein expression levels was compared with cells transfected with an empty vector control (pCDH). Tubulin was used as an internal control. (B) Colony formation, (C) proliferation and (D) migration assays were performed. (E and F) Gap closure assay following STK31 overexpression in MKN74 cells at a density of 1×10⁶ cells. Scale bar, 100 µm. (G) Xenograft assay with transfected MKN74 cells. Mice were sacrificed at day 53 and tumor volumes were measured. Scale bar, 1 cm. (H) Tumor growth curves for STK31-expressing and control MKN74 cells in nude mice. P-values were determined using Student's t-test. *P<0.05, **P<0.01, ***P<0.001. STK, serine/threonine kinase.
Figure 8.
Figure 8.
Survival analysis for patients with gastric cancer based on STK31 expression data. Patient data from the Chungnam National University Hospital (n=145) and Samsung Medical Center (n=432) (23) cohorts were merged. Data were analyzed via Kaplan-Meier method and log-rank test. STK, serine/threonine kinase.

Similar articles

Cited by

References

    1. Bray F, Ferlay J, Soerjomataram I, Siegel RL, Torre LA, Jemal A. Global cancer statistics 2018: GLOBOCAN estimates of incidence and mortality worldwide for 36 cancers in 185 countries. CA Cancer J Clin. 2018;68:394–424. doi: 10.3322/caac.21492. - DOI - PubMed
    1. Orditura M, Galizia G, Sforza V, Gambardella V, Fabozzi A, Laterza MM, Andreozzi F, Ventriglia J, Savastano B, Mabilia A, et al. Treatment of gastric cancer. World J Gastroenterol. 2014;20:1635–1649. doi: 10.3748/wjg.v20.i7.1635. - DOI - PMC - PubMed
    1. Matsuoka T, Yashiro M. Biomarkers of gastric cancer: Current topics and future perspective. World J Gastroenterol. 2018;24:2818–2832. doi: 10.3748/wjg.v24.i26.2818. - DOI - PMC - PubMed
    1. Correa P. Human gastric carcinogenesis: A multistep and multifactorial process-First American Cancer Society Award Lecture on Cancer Epidemiology and Prevention. Cancer Res. 1992;52:6735–6740. - PubMed
    1. Jones PA, Baylin SB. The fundamental role of epigenetic events in cancer. Nat Rev Genet. 2002;3:415–428. doi: 10.1038/nrg816. - DOI - PubMed

MeSH terms

Substances