Review
. 2021 Jun;27(6):633-642.
doi: 10.1111/cns.13622. Epub 2021 Mar 1.

Animal models for the study of depressive disorder

Affiliations
Review

Animal models for the study of depressive disorder

Juhyun Song et al. CNS Neurosci Ther. 2021 Jun.

Abstract

Depressive disorder is one of the most widespread forms of psychiatric pathology, worldwide. According to a report by the World Health Organization, the number of people with depression, globally, is increasing dramatically with each year. Previous studies have demonstrated that various factors, including genetics and environmental stress, contribute to the risk of depression. As such, it is crucial to develop a detailed understanding of the pathogenesis of depressive disorder and animal studies are essential for identifying the mechanisms and genetic disorders underlying depression. Recently, many researchers have reported on the pathology of depression via various models of depressive disorder. Given that different animal models of depression show differences in terms of patterns of depressive behavior and pathology, the comparison between depressive animal models is necessary for progress in the field of the depression study. However, the various animal models of depression have not been fully compared or evaluated until now. In this paper, we reviewed the pathophysiology of the depressive disorder and its current animal models with the analysis of their transcriptomic profiles. We provide insights for selecting different animal models for the study of depression.

Keywords: depression; depression animal model; depressive behavior; functional analysis; transcriptomic analysis.


Figures

FIGURE 1
FIGURE 1
The neuroanatomical image of depression. This schematic image presents the important neurotransmitter pathway and the neuronal connection between different brain regions in depression. The nucleus accumbens plays as a critical connection hub in depression‐related brain regions. GABA (gamma‐aminobutyric acid) and Glu (glutamate), the neurotransmitters, contribute to the connective signal between the nucleus accumbens and the prefrontal cortex. Serotonin, which is secreted from the raphe nucleus of the brain stem, contributes to the limbic pathway and finally affects the hippocampus, related to cognitive function. Dopamine, another neurotransmitter, which is secreted from the ventral tegmentum area of the brain stem, influences the whole cerebral cortex region in the brain including the prefrontal cortex. See texts for the details. Red arrows indicate the serotonin pathway, and purple arrows indicate the dopamine pathway. Blue lines show the neuronal connection between different brain regions
FIGURE 2
FIGURE 2
Experimental models for the study of depression. (A) Chronic mild stress. In this model, the mice are exposed to a series of low‐intensity stressors at unpredictable times for 9 weeks. (B) Chronic social stress. In this model, depression is induced over 10 days by directly exposing the experimental mouse to a larger and aggressive mouse for 5 minutes a day and then housing across a transparent barrier to sustain sensory contact. (C) Physical pain. A spared nerve injury is surgically inflicted, resulting in depressive behaviors due to persistent neuropathic pain. (D) Learned helplessness. The mouse is exposed to unpredictable and inescapable electric footshocks for two consecutive days, after which the mouse shows a defect in its escape behavior and depressive symptoms
FIGURE 3
FIGURE 3
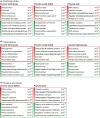
Gene ontology analysis of differentially expressed gene groups for each model. First, we selected the top 10000 genes for each model, based on their average signal (FPKM) from RNA sequencing data. If there was any sample with an FPKM value of zero, we removed the genes from further analysis. We selected the top 200 increased (red color box) and decreased genes (green color box) based on their fold changes between the depression model mouse and its corresponding control mouse. We then used these gene groups for gene ontology (GO) analysis with MSigDB (http://software.broadinstitute.org/gsea/msigdb/). Based on the p‐value, we selected the top 20 GO terms (Supplementary Table 6). We present the most significant five terms in this figure

Similar articles

Cited by

References

    1. Andrade L, Caraveo‐Anduaga JJ, Berglund P, et al. The epidemiology of major depressive episodes: results from the International Consortium of Psychiatric Epidemiology (ICPE) Surveys. Int J Methods Psychiatr Res. 2003;12(1):3‐21. - PMC - PubMed
    1. Hasler G, Drevets WC, Manji HK, Charney DS. Discovering endophenotypes for major depression. Neuropsychopharmacology. 2004;29(10):1765‐1781. - PubMed
    1. Brigitta B. Pathophysiology of depression and mechanisms of treatment. Dialogues Clin Neurosci. 2002;4(1):7‐20. - PMC - PubMed
    1. Gaiteri C, Ding Y, French B, Tseng GC, Sibille E. Beyond modules and hubs: the potential of gene coexpression networks for investigating molecular mechanisms of complex brain disorders. Genes Brain Behav. 2014;13(1):13‐24. - PMC - PubMed
    1. Lee P, Zhang M, Hong JP, et al. Frequency of painful physical symptoms with major depressive disorder in asia: relationship with disease severity and quality of life. J Clin Psychiatr. 2009;70(1):83‐91. - PubMed

Publication types