

Construction and validation of an autophagy-related long noncoding RNA signature for prognosis prediction in kidney renal clear cell carcinoma patients
- PMID: 33650306
- PMCID: PMC7982638
- DOI: 10.1002/cam4.3820
Construction and validation of an autophagy-related long noncoding RNA signature for prognosis prediction in kidney renal clear cell carcinoma patients
Abstract
Purpose: The purpose of this study was to identify autophagy-associated long noncoding RNAs (ARlncRNAs) using the kidney renal clear cell carcinoma (KIRC) patient data from The Cancer Genome Atlas (TCGA) database and to construct a prognostic risk-related ARlncRNAs signature to accurately predict the prognosis of KIRC patients.
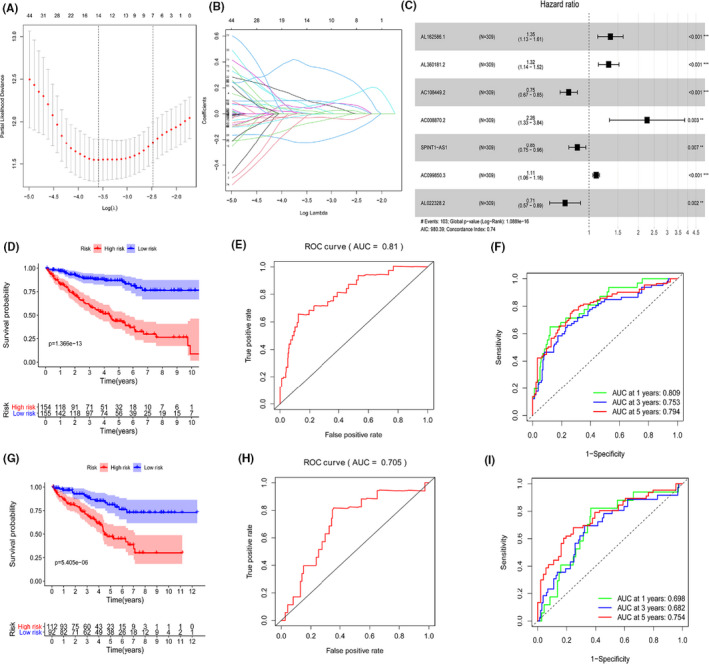
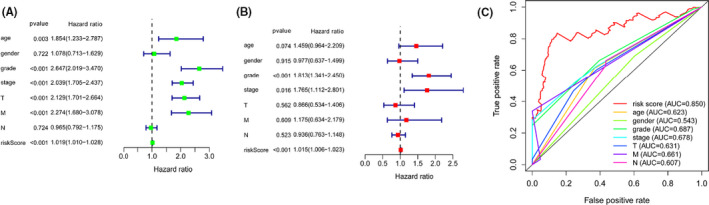
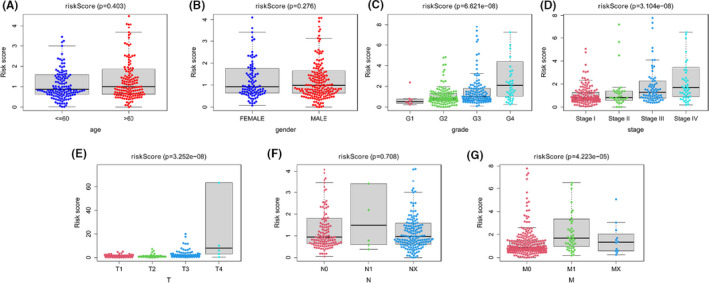
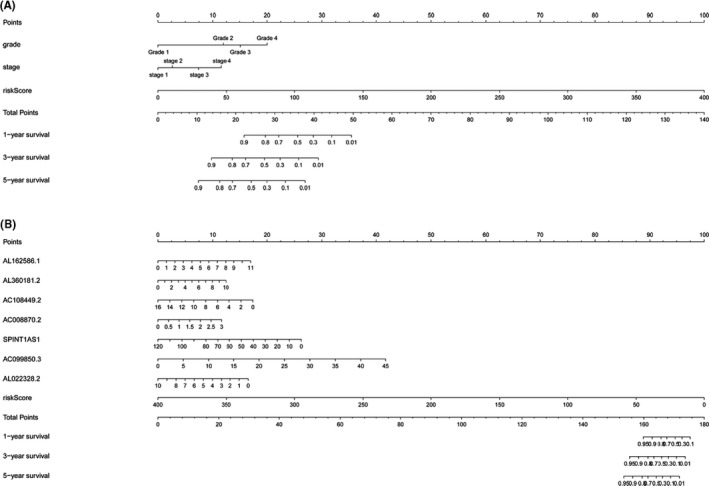
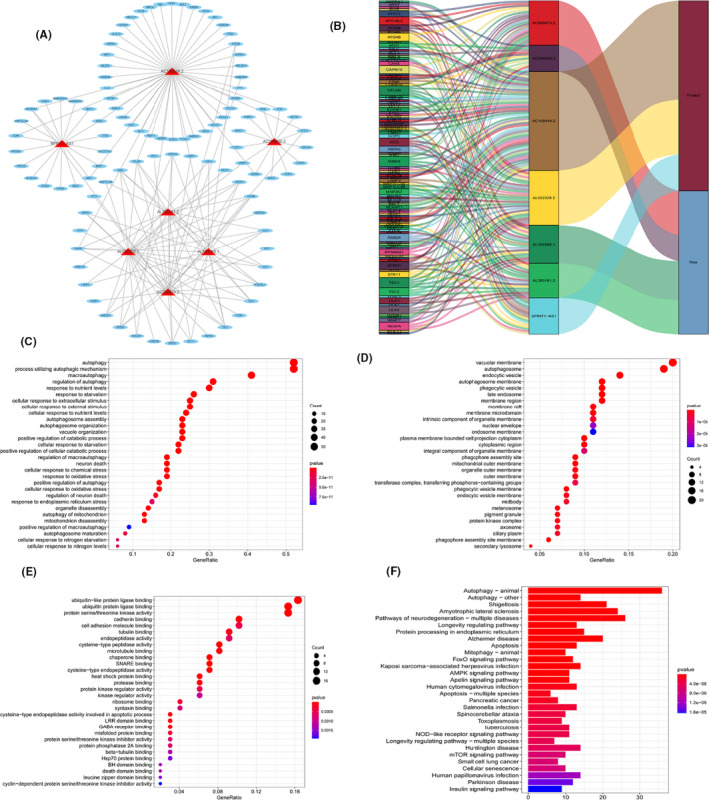
Methods: The KIRC patient data were originated from TCGA database and were classified into a training set and testing set. Seven prognostic risk-related ARlncRNAs, identified using univariate, lasso, and multivariate Cox regression analysis, were used to construct prognostic risk-related signatures. Kaplan-Meier curves and receiver operating characteristic (ROC) curves as well as independent prognostic factor analysis and correlation analysis with clinical characteristics were utilized to evaluate and verify the specificity and sensitivity of the signature in training set and testing set, respectively. Two nomograms were established to predict the probable 1-, 3-, and 5-year survival of the KIRC patients. In addition, the lncRNA-mRNA co-expression network was constructed and Gene Ontology (GO) enrichment analysis and Kyoto Encyclopedia of Genes and Genomes (KEGG) were used to identify biological functions of ARlncRNAs.
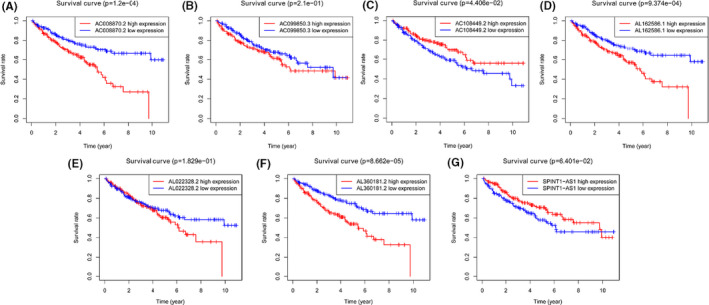
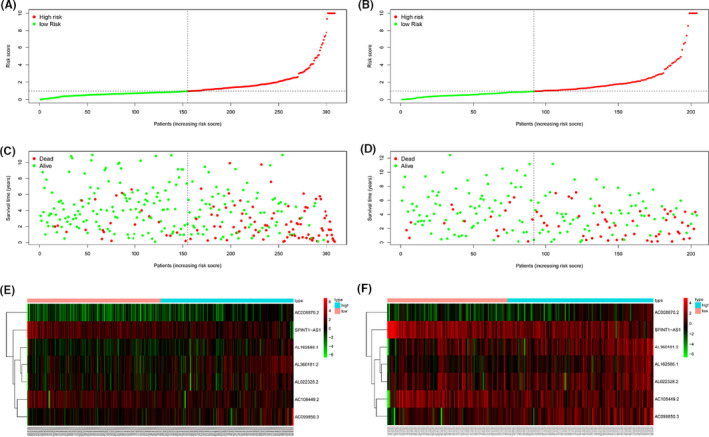
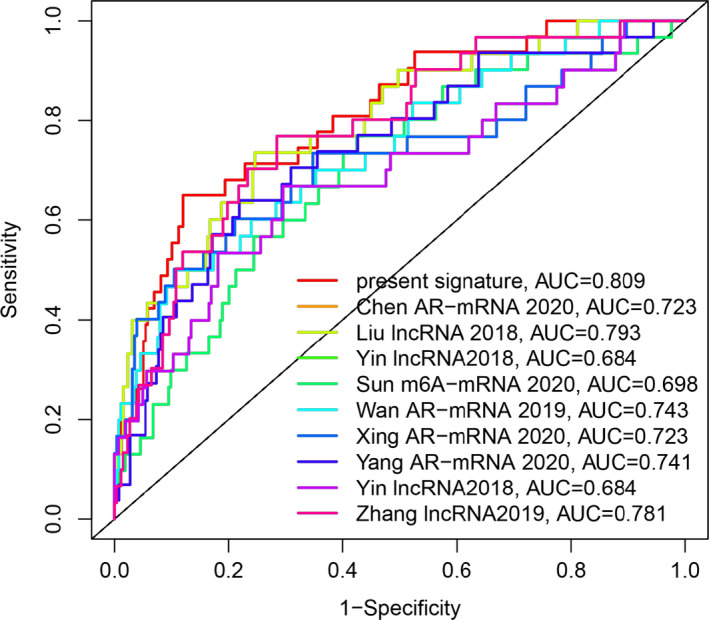
Results: We constructed and verified a prognostic risk-related ARlncRNAs signature in training set and testing set, respectively. We found the survival time of KIRC patients with low-risk scores was significantly better than those with high-risk scores in training set and testing set. ROC curves suggested that the area under the ROC (AUC) value for prognostic risk score signature was 0.81 in training set and 0.705 in testing set. And AUC values corresponding to 1-, 3-, and 5 years of OS were 0.809, 0.753, and 0.794 in training set and 0.698, 0.682, and 0.754 in testing set, respectively. We established the two nomograms that confirmed high C-index and accomplished good prediction accuracy.
Conclusions: We constructed a prognostic risk-related ARlncRNAs signature that could accurately predict the prognosis of KIRC patients.
Keywords: The Cancer Genome Atlas; autophagy; kidney renal clear cell carcinoma; long noncoding RNA; prognostic signature.
© 2021 The Authors. Cancer Medicine published by John Wiley & Sons Ltd.
Conflict of interest statement
The authors report no conflict of interest.
Figures
Similar articles
-
Construction and validation of an autophagy-related long non-coding RNA signature to predict the prognosis of kidney renal papillary cell carcinoma.J Investig Med. 2022 Oct;70(7):1536-1544. doi: 10.1136/jim-2022-002379. Epub 2022 Jun 20. J Investig Med. 2022. PMID: 35725019
-
Identification of small molecule drugs and development of a novel autophagy-related prognostic signature for kidney renal clear cell carcinoma.Cancer Med. 2020 Oct;9(19):7034-7051. doi: 10.1002/cam4.3367. Epub 2020 Aug 11. Cancer Med. 2020. PMID: 32780567 Free PMC article.
-
Identification of an m6A-Related lncRNA Signature for Predicting the Prognosis in Patients With Kidney Renal Clear Cell Carcinoma.Front Oncol. 2021 May 26;11:663263. doi: 10.3389/fonc.2021.663263. eCollection 2021. Front Oncol. 2021. PMID: 34123820 Free PMC article.
-
Exploring the role of long noncoding RNAs in autophagy and cuproptosis processes via immune pathways in head and neck squamous carcinoma: A systematic review of the literature.Medicine (Baltimore). 2024 Aug 23;103(34):e39335. doi: 10.1097/MD.0000000000039335. Medicine (Baltimore). 2024. PMID: 39183398 Free PMC article.
-
Ferroptosis-related long non-coding RNA signature predicts the prognosis of hepatocellular carcinoma: A Review.Medicine (Baltimore). 2022 Nov 25;101(47):e31747. doi: 10.1097/MD.0000000000031747. Medicine (Baltimore). 2022. PMID: 36451456 Free PMC article. Review.
Cited by
-
A novel marker based on necroptosis-related long non-coding RNA for forecasting prognostic in patients with clear cell renal cell carcinoma.Front Genet. 2022 Sep 21;13:948254. doi: 10.3389/fgene.2022.948254. eCollection 2022. Front Genet. 2022. PMID: 36212132 Free PMC article.
-
Angiogenesis Pathway in Kidney Renal Clear Cell Carcinoma and Its Prognostic Value for Cancer Risk Prediction.Front Med (Lausanne). 2021 Oct 28;8:731214. doi: 10.3389/fmed.2021.731214. eCollection 2021. Front Med (Lausanne). 2021. PMID: 34778292 Free PMC article.
-
A comprehensive pan-cancer analysis of necroptosis molecules in four gynecologic cancers.BMC Cancer. 2022 Nov 10;22(1):1160. doi: 10.1186/s12885-022-10166-6. BMC Cancer. 2022. PMID: 36357839 Free PMC article.
-
Disulfidptosis-associated LncRNA signature predicts prognosis and immune response in kidney renal clear cell carcinoma.Biol Direct. 2024 Aug 22;19(1):71. doi: 10.1186/s13062-024-00517-7. Biol Direct. 2024. PMID: 39175011 Free PMC article.
-
Identification of Prognostic Metabolism-Related Genes in Clear Cell Renal Cell Carcinoma.J Oncol. 2021 Sep 27;2021:2042114. doi: 10.1155/2021/2042114. eCollection 2021. J Oncol. 2021. PMID: 34616452 Free PMC article.
References
-
- Siegel RL, Miller KD, Jemal A. Cancer statistics, 2019. CA Cancer J Clin. 2019;69(1):7‐34. - PubMed
-
- Miller KD, Nogueira L, Mariotto AB, et al. Cancer treatment and survivorship statistics, 2019. CA Cancer J Clin. 2019;69(5):363‐385. - PubMed
-
- Escudier B, Porta C, Schmidinger M, et al. Renal cell carcinoma: ESMO Clinical Practice Guidelines for diagnosis, treatment and follow‐up†. Ann Oncol. 2019;30(5):706‐720. - PubMed
-
- Zheng T, Yang CG. Targeting SPOP with small molecules provides a novel strategy for kidney cancer therapy. Sci China Life Sci. 2017;60(1):91‐93. - PubMed
Publication types
MeSH terms
Substances
LinkOut - more resources
Full Text Sources
Other Literature Sources
Medical
