. 2021 Mar 23;15(3):3754-3807.
doi: 10.1021/acsnano.0c09563. Epub 2021 Mar 2.

X-ray-Based Techniques to Study the Nano-Bio Interface

Carlos Sanchez-Cano  1 Ramon A Alvarez-Puebla  2   3 John M Abendroth  4 Tobias Beck  5 Robert Blick  5 Yuan Cao  6   7 Frank Caruso  8 Indranath Chakraborty  5 Henry N Chapman  5   9   10 Chunying Chen  11 Bruce E Cohen  12 Andre L C Conceição  10 David P Cormode  13 Daxiang Cui  14 Kenneth A Dawson  15 Gerald Falkenberg  10 Chunhai Fan  14 Neus Feliu  5   16 Mingyuan Gao  17 Elisabetta Gargioni  17 Claus-C Glüer  18 Florian Grüner  5   19 Moustapha Hassan  20 Yong Hu  21 Yalan Huang  5 Samuel Huber  17 Nils Huse  5 Yanan Kang  5 Ali Khademhosseini  22 Thomas F Keller  5   10 Christian Körnig  5   19 Nicholas A Kotov  6   7   23   24 Dorota Koziej  5 Xing-Jie Liang  11 Beibei Liu  17 Sijin Liu  25 Yang Liu  5 Ziyao Liu  5 Luis M Liz-Marzán  1   26   27 Xiaowei Ma  11 Andres Machicote  17 Wolfgang Maison  5 Adrian P Mancuso  28   29 Saad Megahed  5 Bert Nickel  30 Ferdinand Otto  5 Cristina Palencia  5 Sakura Pascarelli  28 Arwen Pearson  5 Oula Peñate-Medina  18 Bing Qi  5 Joachim Rädler  30 Joseph J Richardson  8 Axel Rosenhahn  17 Kai Rothkamm  17 Michael Rübhausen  5 Milan K Sanyal  31 Raymond E Schaak  32 Heinz-Peter Schlemmer  33 Marius Schmidt  34 Oliver Schmutzler  5   19 Theo Schotten  16 Florian Schulz  5 A K Sood  35 Kathryn M Spiers  10 Theresa Staufer  5   19 Dominik M Stemer  36   37 Andreas Stierle  5   10 Xing Sun  5   38 Gohar Tsakanova  39   40 Paul S Weiss  36   37   41   42 Horst Weller  5   16 Fabian Westermeier  10 Ming Xu  25 Huijie Yan  5 Yuan Zeng  5 Ying Zhao  20 Yuliang Zhao  11 Dingcheng Zhu  5 Ying Zhu  43   44 Wolfgang J Parak  1   5   14
Affiliations

X-ray-Based Techniques to Study the Nano-Bio Interface

Carlos Sanchez-Cano et al. ACS Nano. .

Abstract

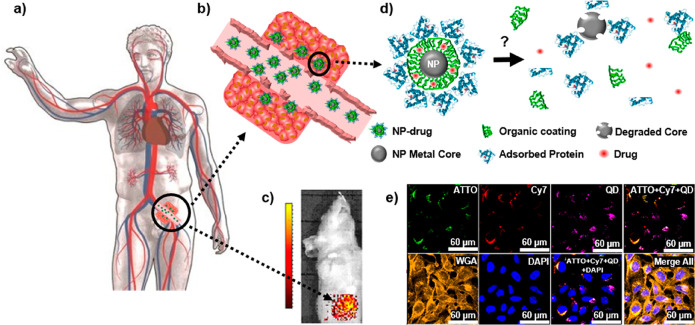
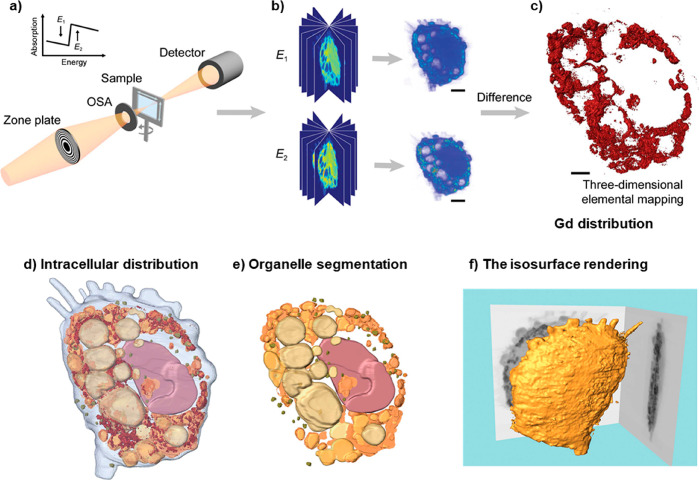
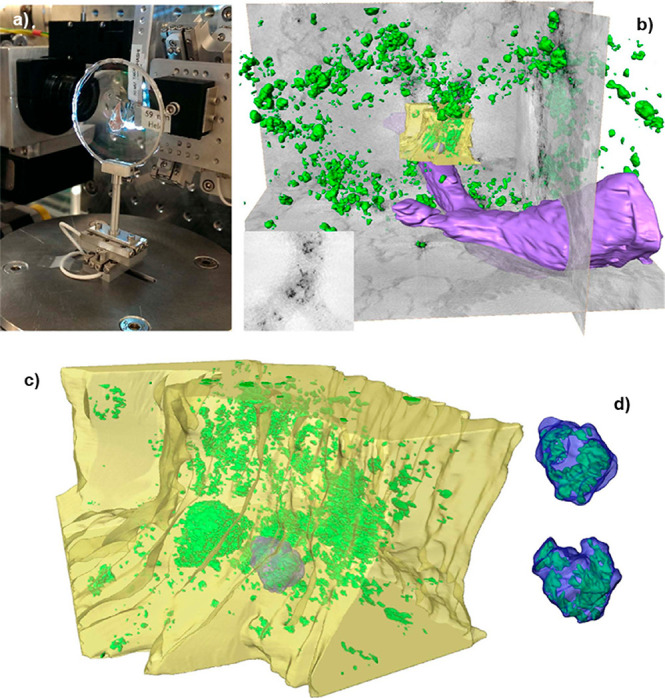
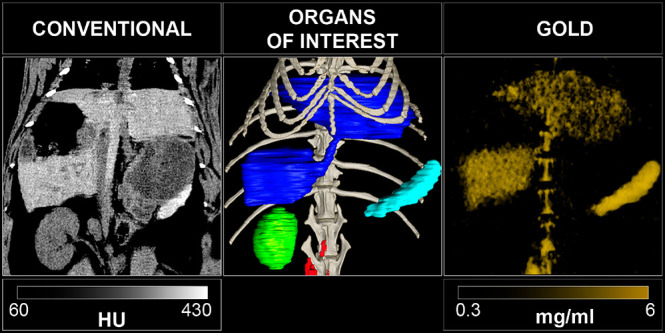
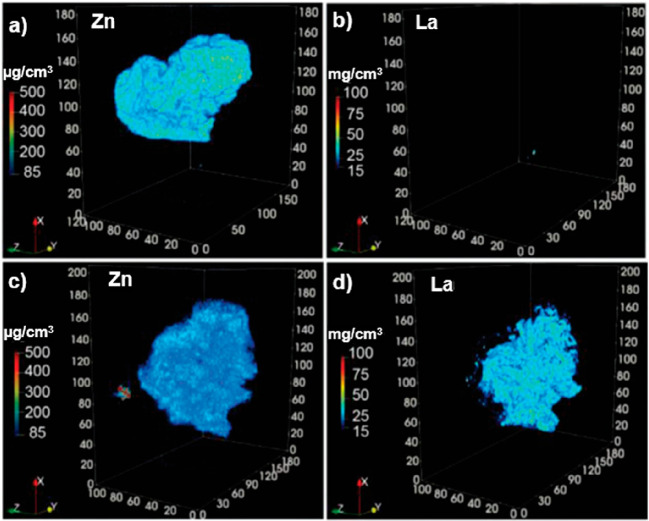
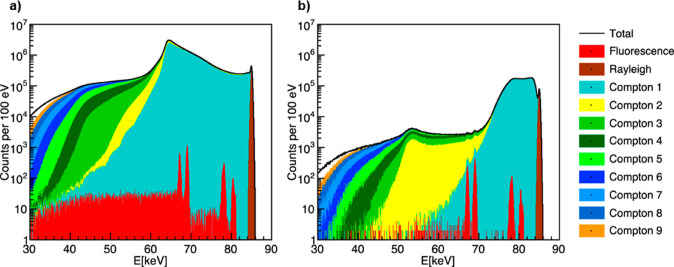
X-ray-based analytics are routinely applied in many fields, including physics, chemistry, materials science, and engineering. The full potential of such techniques in the life sciences and medicine, however, has not yet been fully exploited. We highlight current and upcoming advances in this direction. We describe different X-ray-based methodologies (including those performed at synchrotron light sources and X-ray free-electron lasers) and their potentials for application to investigate the nano-bio interface. The discussion is predominantly guided by asking how such methods could better help to understand and to improve nanoparticle-based drug delivery, though the concepts also apply to nano-bio interactions in general. We discuss current limitations and how they might be overcome, particularly for future use in vivo.

Keywords: X-ray techniques; degradation; delivery; imaging; nanoparticles; nano−bio interface; spectroscopy; synchrotron radiation.


Conflict of interest statement

The authors declare no competing financial interest.

Figures

Figure 1
Figure 1
(a) Sketch of a hypothetical scenario in which nanoparticle (NP)-based drugs are administered intravenously for the purpose of cancer treatment. (b) In leaky tumor tissue, some NP-based drugs may be retained by passive targeting., But do these drugs penetrate effectively into the tumor tissue or remain at the tumor surface? (c) Fluorescently labeled NP-based drugs can be imaged in vivo in animal models, but spatial resolution is typically too low and does not allow conclusions about the distribution of the NPs in the tumor tissue. Reprinted with permission from ref (13) under a CC BY-NC-ND 4.0 International License. Copyright 2016 Nature Research. (d) Inside the human body, the NP-based drugs, comprising a NP carrier/vehicle (gray), an organic surface coating including ligands for targeting (green), the drug to be delivered (red), and a corona of adsorbed proteins (blue) may degrade, which can completely change the NP properties. (e) Example of in vitro degradation of a model for a NP-based drug after endocytosis by cells. Here, the NP-based model drug used can be identified in different compartments by their fluorescence (shown in false colors in the overlay of different fluorescence channels): CdSe/ZnS quantum dots (QDs) (purple) as NP carriers, ATTO-labeled polymer shell around the QDs (green), representing the ligands on the NP surface, and preadsorbed Cy7-labeled proteins (red) symbolizing a drug to be delivered. As shown in the image, after exposure, the location of the different compounds of the NP-based model drug can be mapped by fluorescence imaging. Data from Carrillo-Carrion et al. demonstrate that the three components of the NP (QD core, polymer shell, protein corona) disintegrate over time, as colocalization is partly lost. However, fluorescence imaging is not ideal to follow all the different parts of the NP-based drugs. For example, Cd ions released from the CdSe/Zn core cannot be directly imaged based on fluorescence. Reprinted with permission from ref (17). Copyright 2019 American Chemical Society.
Figure 2
Figure 2
(a) Spatial resolution allows recording monochromatic images, such as the distribution I(x,y) of one type of fluorophore within one cell. (b) Temporal resolution allows recording intensity fluctuations I(t) at one point, which with correlation analysis enables diffusion measurements of fluorophores. (c) Spectral resolution permits discrimination of the fluorescence I(λ) of fluorophores emitting at different wavelengths, λ. (d) Spatial and temporal resolution taken together allow recording of monochromatic movies, such as the movement of one type of fluorophores within one cell. (e) Spatial and spectral resolution taken together allow recording multicolor images, such as the distribution of different fluorophores in one cell. (f) Temporal and spectral resolution together enable multiplexed recording of intensity variations of multiple fluorophores. (g) Taking spatial, temporal, and spectral resolution together makes it possible to record multicolor movies, such as recording the movement of multiple different fluorophores in one cell.
Figure 3
Figure 3
(a) Visible light can be focused to a fluorophore. (b) In the case of scatterers in the path, the focus is diffused, limiting spatial resolution as well as the intensity that arrives at the fluorophore. (c) In case wavelengths are used at which no scattering occurs with the intermediate material, the illumination path would remain unaffected.
Figure 4
Figure 4
Internalization of metallofullerenol by macrophages in vivo and in vitro. (a) A Gd M5-edge XANES spectrum of Gd@C82(OH)22 NPs. (b) Soft X-ray dual-energy contrast STXM images of Gd@C82(OH)22 in a primary mouse peritoneal macrophage in vivo. (c) Soft X-ray dual-energy contrast STXM images of the time-dependent uptake of Gd@C82(OH)22 NPs by primary mouse peritoneal macrophages and RAW 264.7 cells in vitro. (d) ICP-MS quantification of the time-dependent uptake of the NPs in macrophages of primary mouse peritoneal macrophages. Reprinted with permission from ref (210). Copyright 2014 John Wiley and Sons, Inc.
Figure 5
Figure 5
(a) Schematic layout of the dual-energy STXM imaging technique. Two sets of projections are acquired from various angles by STXM at energies below and above the absorption edge of the observed element, which in the reported work was Gd. (b) Tomographic data sets for both energies were separately reconstructed using the EST algorithm. (c) From this the quantitative 3D distribution of the specific element, here Gd, was obtained. (d) Intracellular distribution of Gd@C82(OH)22NPs. (e) Organelle segmentation based on differences in the linear attenuation coefficient and specific morphology of the different organelles. (f) Isosurface rendering of the macrophage at 1189 eV. Reprinted with permission from ref (214) under a CC-BY License. Copyright 2018 International Union of Crystallography.
Figure 6
Figure 6
Nanocomputed tomography images of Escherichia coli: (a) untreated or (b) upon exposure to La@GO nanocomposites to decipher the bactericidal mechanism. Reprinted with permission from ref (216). Copyright 2019 American Chemical Society.
Figure 7
Figure 7
Repurpose engineered peroxidase as genetically encoded tags for protein localization with XRM. (a) Schematics showing the catalytic polymerization of 3,3′-diaminobenzidine (DAB) into DAB polymer (left) and X-ray imaging of DAB polymer (right). (b) X-ray absorption spectra of water and DAB polymer. In the “water window”, absorption by carbon and nitrogen is much stronger than by oxygen. (c) Schematics showing APEX2 as a genetically encoded tag for protein localization with XRM. By using fusion expression plasmids including APEX2 and biotargets, these tags are highly specific and can polymerize DAB into localized X-ray-visible dense DAB polymers. This strategy enables localizing and imaging various cellular targets with high resolution. (d) STXM images of cellular proteins and specific amino acid sequences: COX4 (mitochondrial), Cx43, α-tubulin, β-actin, NLS, and GalT. Scale bars: 10 μm. (e) Photostability characterization of the genetically encoded tag for protein localization with XRM. No photobleaching occurred after 10 frames of STXM scans (for each STXM scan, the signal-to-background ratio of 10 loci was calculated and averaged to obtain a single value). Scale bars: 10 μm. Reprinted with permission from ref (230) under a CC-BY License. Copyright 2020 Oxford University Press.
Figure 8
Figure 8
(a) Schematic diagram of the chemical mechanism of Ag NP toxicity to human monocytes (THP-1), showing also the XANES spectra of Ag atoms in different oxidation states/chemical environments. (b) Single-cell imaging with 3D hard X-ray tomography (NanoCT) to observe the spatial distribution of Ag NPs in a single THP-1 cell. Reprinted with permission from ref (22). Copyright (2015) American Chemical Society.
Figure 9
Figure 9
Example of propagation-based phase contrast tomography of a lung section from a healthy mouse where macrophages labeled with barium NPs were instilled, showing the barium NPs (green), blood vessel (purple), bronchial area (yellow), and the contours of macrophages (blue). (a) Lung section mounted on the sample holder. (b) 3D rendering of the reconstructed volume of a large field of view of the lung section. (c) 3D rendering of the reconstructed volume obtained from tomographic data zooming on the bronchial area in (b). (d) Detail of barium-labeled macrophage highlighted in (c) from two orientations showing the internal distribution of the NP. Reprinted with permission from ref (241) under a CC BY-NC-ND 4.0 International License. Copyright 2015 Nature Research.
Figure 10
Figure 10
SPCCT images of a rabbit injected with PEG-coated, 15 nm core Au NPs, at 6 months post-injection. From left to right: A conventional CT image, segmentation of organs of interest (dark blue: liver, light blue: spleen, green: right kidney, red: lymph nodes, light gray: bone structure) and a Au “K-edge” image. Reprinted with permission from ref (264). Copyright 2017 Royal Society of Chemistry.
Figure 11
Figure 11
X-ray fluorescence 3D elemental maps showing the distributions of Zn and La in F98 spheroids (a,b) untreated or (c,d) treated with LaF3:Ce NPs for anticancer radiotherapy. Axes are shown in μm. Adapted with permission from ref (269) under a CC-BY International License. Copyright 2020 Wiley-VCH GmbH.
Figure 12
Figure 12
Simulated XFI spectra showing XFI signals obtained from a 30 cm-diameter water-filled sphere. (a) X-ray spectrum from the full solid angle (4π) with X-ray fluorescence (red) Au NPs (peaks around 67 and 69 keV) are undetectable within a “sea of background photons” from multiple Compton scattering: of 1000 measured photons, only 1 is from fluorescence, the other 999 arise from Compton scattering (the color indicates how often a photon is Compton scattered). (b) Spectrum for the same situation, but after performing optimized “spatial filtering”, which enables the detection of X-ray fluorescence signals from the Au NPs. Reprinted with permission from ref (57) under a CC BY-NC-ND 4.0 International License. Copyright 2018 Nature Research.
Figure 13
Figure 13
X-ray fluorescence imaging full-body (a) and fine scan of the thyroid region (b) of a mouse. The euthanized mouse was placed sideways with the X-ray beam impinging perpendicular to the figure plane (mouse head on the right side). The left map depicts the number of Compton-scattered photons for each scan position. As seen, the only visible iodine concentration is the natural one found in the thyroid with the local iodine mass in the beam volume as retrieved from data analysis (each pixel of the fine scan covers an area of 0.25 mm2 and shows the amount of iodine Kα fluorescence photons). These data were recorded at Deutsches Elektronen-Synchrotron (DESY) by C. Körnig, O. Schmutzler, Y. Liu, T. Staufer, A. Machicote, Beibei Liu, W. J. Parak, N. Feliu, S. Huber, F. Grüner and have not been published previously. Experiments involving animals were carried out in accordance with the Institutional Review Board “Behörde für Soziales, Familie, Gesundheit und Verbraucherschutz” (Hamburg, Germany).
Figure 14
Figure 14
Example SAXS experiment to study the structure of a microporous nongraphitic carbon material. (a) Schematic showing the normal setup of a SAXS instrument. (b) Intensity versus scattering vector curve plot (log–log scale), highlighting morphological (low Q ranges), microstructural (intermediate Q ranges), and structural (large Q ranges) features of the material probed by the technique. (c) Intensity versus scattering angle 2θ plot (linear scale) of the same spectrum, which is normally used for PXRD. Reprinted with permission from ref (306) under a CC BY-NC-ND 4.0 International License. Copyright 2019 Elsevier.
Figure 15
Figure 15
(a) Phantom for SAXS tomography: Dried collagen (anisotropic scattering) and 120 nm SiO2 nanospheres (isotropic scattering) inserted in a homogeneous matrix of RW3 solid water (PTW Freiburg, Freiburg, Germany), which simulates water. (b) Tomographic data set for pencil-beam geometry. (c) Depending on the q-value choice, some structure is highlighted. In this case, reconstructing at q = 0.23 nm–1 emphasizes the SiO2 nanospheres, while if the signal from collagen is desired, the reconstruction is carried out at the q = 0.59 nm–1. (d) 3D view of the SAXS-CT phantom from the top and the side. These data were recorded at the beamline BL40B2 at the Spring-8 synchrotron source for this work by Andre L. C. Conceição and have not been published previously.
Figure 16
Figure 16
Typical arrangement for X-ray reflectivity and related measurements in a synchrotron experiment. Reprinted with permission from ref (351). Copyright 2019 American Chemical Society.
Figure 17
Figure 17
(a) Schematic illustration of the mechanism of toxicity of Ag NPs. Adapted from ref (22). Copyright 2015 American Chemical Society. (b) Different chemical species of Ag as indicated in normalized Ag L3-edge XANES. Reprinted with permission from ref (22).
Figure 18
Figure 18
(a) SAXS pattern of an aqueous dispersion of 50 nm-diameter Au NPs. (b) Autocorrelation functions g(q,τ) for different scattering vectors q. The autocorrelation function was fitted by a diffusion model g(q,τ) ∝ exp(−2 × Γ(q)) with Γ(q) = D(q) × q2 + c). The diffusion coefficient D was fitted from the Γ(q) data, leading with the Stokes–Einstein equation (assuming 22 °C and using the viscosity of water) to an effective hydrodynamic diameter of 66 nm. These data were recorded at Deutsches Elektronen-Synchrotron (DESY) for this work by X. Sun, F. Otto, C. Sanchez-Cano, N. Feliu, F. Westermeier, and W. J. Parak and have not been published previously.
Figure 19
Figure 19
Schematic of shear-stress-induced drug delivery using shape changes of the drug-loaded vesicles. Cartoon created using images modified from Servier Medical Art (Servier, www.servier.com), under a CC-BY 3.0 International License.
Figure 20
Figure 20
Mechanisms involved in radiation damage and subsequent radiation response.
Figure 21
Figure 21
Structural changes in phytochrome photosensory core modules. (a) The Stigmatella aurantiaca photochrome P2 in the Pr state. The central biliverdin (BV) chromophore is marked. The chromophore absorbs 700 nm red light. Upon light absorption, it isomerizes from a Z configuration to an E configuration. The configurational change triggers a large conformational change. Centroid distance of the movable domain: 30 Å. The sensory tongue (red dashed box) adopts a β-sheet structure. The BAC (green star) is bound. (b) Reaction product after light absorption as depicted by the Deinococcus radiodurans phytochrome in the Pfr state. The chromophore absorbs at 750 nm in the far red. The centroid distance of the movable domain is 55 Å. The sensory tongue (red box) then adopts an α-helical structure. The BAC (green star) is free to leave. The reaction between Pr and Pfr states is reversible to facilitate uptake and release of the BAC.

Similar articles

Cited by

References

    1. Holding J. D.; Lindup W. E.; Laer C. v.; Vreeburg G. C.; Schilling V.; Wilson J. A.; Stell P. M. Phase I Trial of a Cisplatin-Albumin Complex for the Treatment of Cancer of the Head and Neck. Br. J. Clin. Pharmacol. 1992, 33, 75–81. 10.1111/j.1365-2125.1992.tb04003.x. - DOI - PMC - PubMed
    1. Hawkins M. J.; Soon-Shiong P.; Desai N. Protein Nanoparticles as Drug Carriers in Clinical Medicine. Adv. Drug Delivery Rev. 2008, 60, 876–885. 10.1016/j.addr.2007.08.044. - DOI - PubMed
    1. Barenholz Y. Doxil® — The First FDA-Approved Nano-Drug: Lessons Learned. J. Controlled Release 2012, 160, 117–134. 10.1016/j.jconrel.2012.03.020. - DOI - PubMed
    1. Abrantes C. G.; Duarte D.; Reis C. P. An Overview of Pharmaceutical Excipients: Safe or Not Safe?. J. Pharm. Sci. 2016, 105, 2019–2026. 10.1016/j.xphs.2016.03.019. - DOI - PubMed
    1. Junghanns J.-U. A. H.; Müller R. H. Nanocrystal Technology, Drug Delivery and Clinical Applications. Int. J. Nanomed. 2008, 3, 295–309. 10.2147/IJN.S595. - DOI - PMC - PubMed

Publication types