FMX - the Frontier Microfocusing Macromolecular Crystallography Beamline at the National Synchrotron Light Source II
- PMID: 33650577
- PMCID: PMC7941291
- DOI: 10.1107/S1600577520016173
FMX - the Frontier Microfocusing Macromolecular Crystallography Beamline at the National Synchrotron Light Source II
Abstract
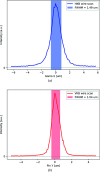
Two new macromolecular crystallography (MX) beamlines at the National Synchrotron Light Source II, FMX and AMX, opened for general user operation in February 2017 [Schneider et al. (2013). J. Phys. Conf. Ser. 425, 012003; Fuchs et al. (2014). J. Phys. Conf. Ser. 493, 012021; Fuchs et al. (2016). AIP Conf. Proc. SRI2015, 1741, 030006]. FMX, the micro-focusing Frontier MX beamline in sector 17-ID-2 at NSLS-II, covers a 5-30 keV photon energy range and delivers a flux of 4.0 × 10¹² photons s-1 at 1 Å into a 1 µm × 1.5 µm to 10 µm × 10 µm (V × H) variable focus, expected to reach 5 × 10¹² photons s-1 at final storage-ring current. This flux density surpasses most MX beamlines by nearly two orders of magnitude. The high brightness and microbeam capability of FMX are focused on solving difficult crystallographic challenges. The beamline's flexible design supports a wide range of structure determination methods - serial crystallography on micrometre-sized crystals, raster optimization of diffraction from inhomogeneous crystals, high-resolution data collection from large-unit-cell crystals, room-temperature data collection for crystals that are difficult to freeze and for studying conformational dynamics, and fully automated data collection for sample-screening and ligand-binding studies. FMX's high dose rate reduces data collection times for applications like serial crystallography to minutes rather than hours. With associated sample lifetimes as short as a few milliseconds, new rapid sample-delivery methods have been implemented, such as an ultra-high-speed high-precision piezo scanner goniometer [Gao et al. (2018). J. Synchrotron Rad. 25, 1362-1370], new microcrystal-optimized micromesh well sample holders [Guo et al. (2018). IUCrJ, 5, 238-246] and highly viscous media injectors [Weierstall et al. (2014). Nat. Commun. 5, 3309]. The new beamline pushes the frontier of synchrotron crystallography and enables users to determine structures from difficult-to-crystallize targets like membrane proteins, using previously intractable crystals of a few micrometres in size, and to obtain quality structures from irregular larger crystals.
Keywords: beamlines; endstations; macromolecular crystallography; microfocus; serial crystallography.
Figures


Similar articles
-
AMX - the highly automated macromolecular crystallography (17-ID-1) beamline at the NSLS-II.J Synchrotron Radiat. 2022 Nov 1;29(Pt 6):1480-1494. doi: 10.1107/S1600577522009377. Epub 2022 Oct 21. J Synchrotron Radiat. 2022. PMID: 36345756 Free PMC article.
-
High-speed raster-scanning synchrotron serial microcrystallography with a high-precision piezo-scanner.J Synchrotron Radiat. 2018 Sep 1;25(Pt 5):1362-1370. doi: 10.1107/S1600577518010354. Epub 2018 Aug 23. J Synchrotron Radiat. 2018. PMID: 30179174 Free PMC article.
-
BL-11C Micro-MX: a high-flux microfocus macromolecular-crystallography beamline for micrometre-sized protein crystals at Pohang Light Source II.J Synchrotron Radiat. 2021 Jul 1;28(Pt 4):1210-1215. doi: 10.1107/S1600577521004355. Epub 2021 Jun 1. J Synchrotron Radiat. 2021. PMID: 34212886 Free PMC article.
-
Designing a synchrotron micro-focusing beamline for macromolecular crystallography.Postepy Biochem. 2016;62(3):395-400. Postepy Biochem. 2016. PMID: 28132495 Review. English.
-
A comprehensive approach to X-ray crystallography for drug discovery at a synchrotron facility - The example of Diamond Light Source.Drug Discov Today Technol. 2020 Dec;37:83-92. doi: 10.1016/j.ddtec.2020.10.003. Epub 2020 Dec 10. Drug Discov Today Technol. 2020. PMID: 34895658 Review.
Cited by
-
Deficiency in PHD2-mediated hydroxylation of HIF2α underlies Pacak-Zhuang syndrome.Commun Biol. 2024 Feb 28;7(1):240. doi: 10.1038/s42003-024-05904-4. Commun Biol. 2024. PMID: 38418569 Free PMC article.
-
Structures of the Varicella Zoster Virus Glycoprotein E and Epitope Mapping of Vaccine-Elicited Antibodies.Vaccines (Basel). 2024 Sep 27;12(10):1111. doi: 10.3390/vaccines12101111. Vaccines (Basel). 2024. PMID: 39460278 Free PMC article.
-
Divergent evolution of extreme production of variant plant monounsaturated fatty acids.Proc Natl Acad Sci U S A. 2022 Jul 26;119(30):e2201160119. doi: 10.1073/pnas.2201160119. Epub 2022 Jul 22. Proc Natl Acad Sci U S A. 2022. PMID: 35867834 Free PMC article.
-
A multi-reservoir extruder for time-resolved serial protein crystallography and compound screening at X-ray free-electron lasers.Nat Commun. 2023 Dec 2;14(1):7956. doi: 10.1038/s41467-023-43523-5. Nat Commun. 2023. PMID: 38042952 Free PMC article.
-
Linking ATP and allosteric sites to achieve superadditive binding with bivalent EGFR kinase inhibitors.Commun Chem. 2024 Feb 20;7(1):38. doi: 10.1038/s42004-024-01108-3. Commun Chem. 2024. PMID: 38378740 Free PMC article.
References
-
- Adams, P. D., Afonine, P. V., Bunkóczi, G., Chen, V. B., Davis, I. W., Echols, N., Headd, J. J., Hung, L.-W., Kapral, G. J., Grosse-Kunstleve, R. W., McCoy, A. J., Moriarty, N. W., Oeffner, R., Read, R. J., Richardson, D. C., Richardson, J. S., Terwilliger, T. C. & Zwart, P. H. (2010). Acta Cryst. D66, 213–221. - PMC - PubMed
-
- Allan, D. R., Collins, S. P., Evans, G., Hall, D., McAuley, K., Owen, R. L., Sorensen, T., Tang, C. C., von Delft, F., Wagner, A. & Wilhelm, H. (2015). Eur. Phys. J. Plus, 130, 56.
-
- Arkilic, A., Allan, D. B., Caswell, T. A., Li, L., Lauer, K. & Abeykoon, S. (2017). Synchrotron Radiat. News, 30(2), 44–45.
MeSH terms
Substances
Grants and funding
LinkOut - more resources
Full Text Sources
Other Literature Sources
Miscellaneous

