. 2021 Jun 1;42(8):2347-2361.
doi: 10.1002/hbm.25371. Epub 2021 Mar 2.

Test-retest reliability of approach-avoidance conflict decision-making during functional magnetic resonance imaging in healthy adults

Affiliations

Test-retest reliability of approach-avoidance conflict decision-making during functional magnetic resonance imaging in healthy adults

Timothy J McDermott et al. Hum Brain Mapp. .

Abstract

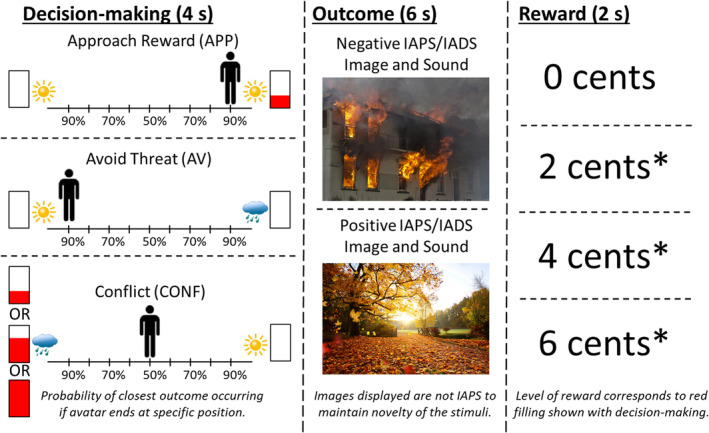
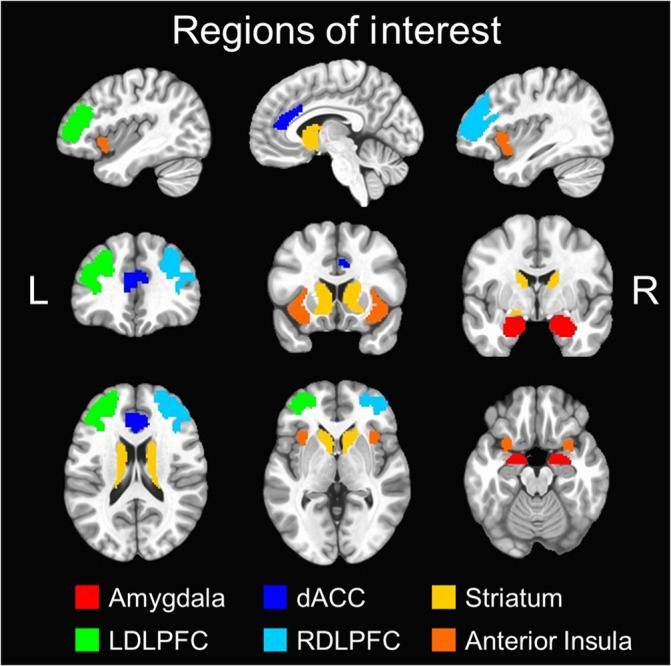
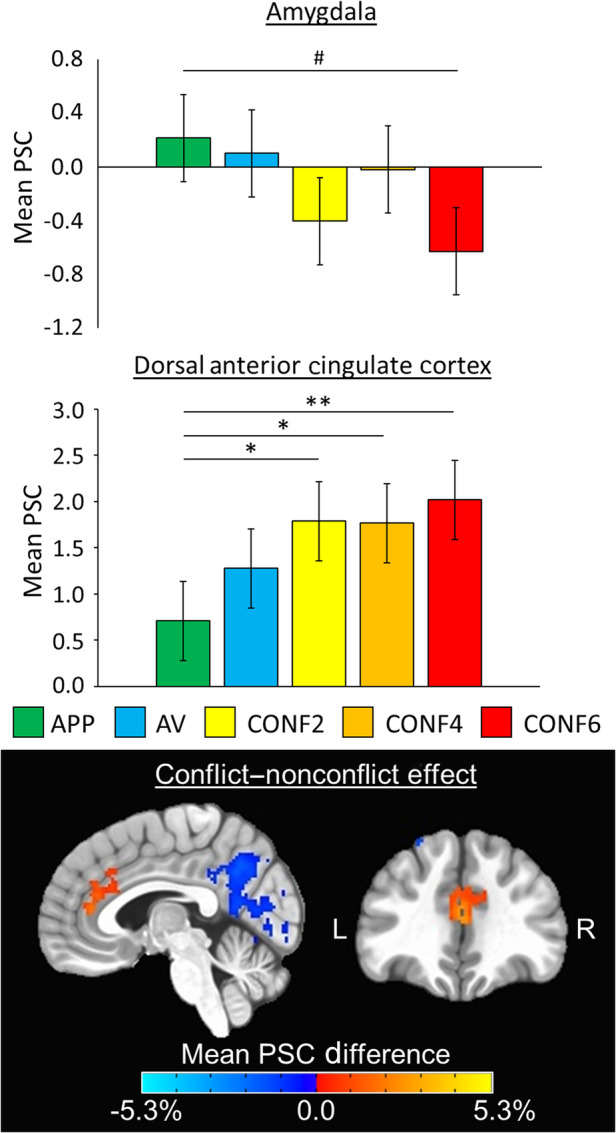
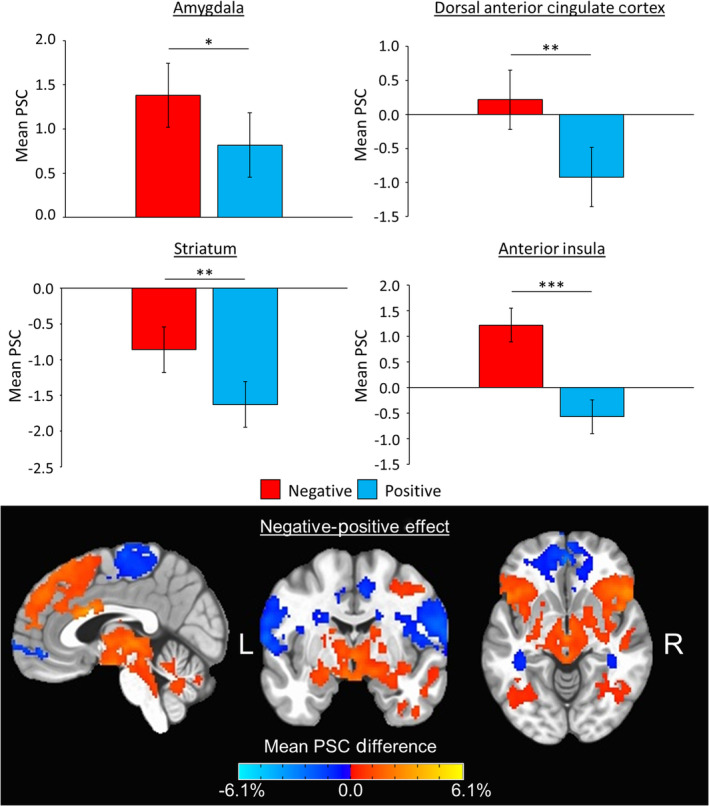
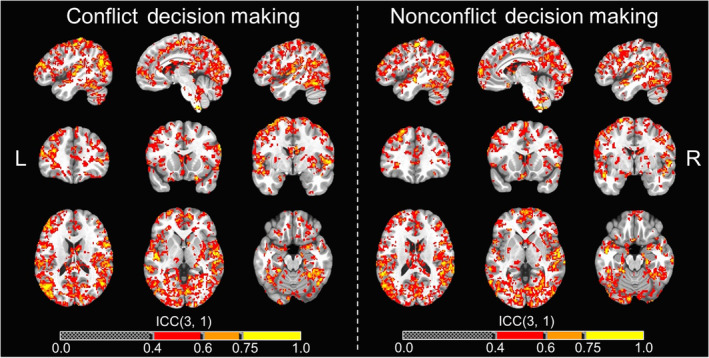
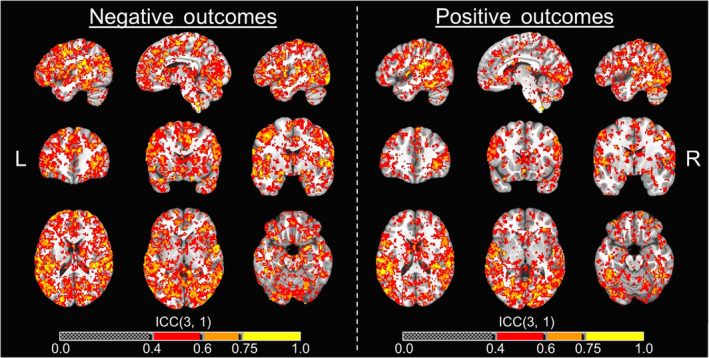
Neural and behavioral mechanisms during approach-avoidance conflict decision-making are relevant across various psychiatric disorders, particularly anxiety disorders. Studies using approach-avoidance conflict paradigms in healthy adults have identified preliminary neural mechanisms, but findings must be replicated and demonstrated as reliable before further application. This study sought to replicate previous findings and examine test-retest reliability of behavioral (approach behavior, reaction time) and neural (regions of interest [ROIs]) responses during an approach-avoidance conflict task conducted during functional magnetic resonance imaging (fMRI). Thirty healthy adults completed an approach-avoidance conflict task during fMRI on two occasions (mean interval: 17 days; range: 11-32). Effects of task condition during three task phases (decision-making, affective outcome and monetary reward) and intraclass correlation coefficients (ICCs) were calculated across time points. Results replicated that approach behavior was modulated by conflict during decision-making. ROI activations were replicated such that dorsal anterior cingulate cortex (dACC) was modulated by conflict during decision-making, and dACC, striatum, and anterior insula were modulated by valence during affective outcomes (p's <.0083). Approach behavior during conflict demonstrated excellent reliability (ICCs ≥.77). Activation of dACC during conflict decision-making and anterior insula during negative outcomes demonstrated fair reliability (ICCs = .51 and .54), and dACC and striatum activation demonstrated good reliability during negative outcomes (ICCs = .63 and .69). Two additional ROIs (amygdala, left dorsolateral prefrontal cortex) showed good reliability during negative outcomes (ICCs ≥.60). These results characterize several specific behavioral and neuroimaging responses that are replicable and sufficiently reliable during approach-avoidance conflict decision-making to support future utility.

Keywords: ICC; affect; anxiety; fMRI; neural; psychiatry; translation.


Conflict of interest statement

The authors have no conflict of interest to disclose.

Figures

FIGURE 1
FIGURE 1
Approach‐avoidance conflict task. The three phases of the approach‐avoidance conflict task are displayed in order from left to right. (Left) During the decision‐making phase, participants have 4 s to move the avatar (by moving a joystick) to a position that accurately reflects their preference between the two potential outcomes. The position in which they move the avatar determines the relative probability of each of the two outcomes occurring (e.g., 90/10 or 50/50%). For approach reward (APP) trials, participants are presented with a choice of two positive stimuli outcomes, and one is paired with a 2‐cent reward as indicated by the filling of the red bar. For avoid threat trials (AV), participants are presented with a choice of a positive and negative stimulus outcome, and neither are paired with a reward. For conflict trials (CONF), participants are presented with a choice of a positive stimulus outcome not paired with a reward and a negative stimuli outcome that is paired with a reward. Reward level is indicated by the level of filling of the red bar, and this indicates either a 2‐, 4‐, or 6‐cent reward. (Middle) During the affective outcome phase, participants are presented with either a positive or a negative affective stimuli image/sound pairing. The images and sounds presented are drawn from the International Affective Picture System (IAPS; Lang et al., 2008) and the International Affective Sound (IADS; Bradley & Lang, 1999), and other public domain audio files. Note that images displayed are not from IAPS in order to maintain stimuli novelty. (Right) During the monetary reward phase, participants are presented with text indicating level of reward for this trial (i.e., 0, 2, 4, or 6 cents), the total award accumulated thus far, and a trumpet sound when receiving a reward (indicated by “*”)
FIGURE 2
FIGURE 2
Brainnetome composite regions of interest. six composite regions of interest (ROIs) were used for primary analyses and were constructed using the Brainnetome atlas (Fan et al., 2016). These are overlaid on the MNI152_T1_2009c T1‐weighted anatomical template brain in neurological orientation (i.e., left is left) using the following color scheme: amygdala (red), dorsal anterior cingulate cortex (dark blue), striatum (orange), left dorsolateral prefrontal cortex (LDLPFC; green), right dorsolateral prefrontal cortex (RDLPFC; light blue), and anterior insula (yellow). The color legend for each ROI is above
FIGURE 3
FIGURE 3
Approach‐avoidance conflict task behavioral results. Bar graphs depict group means (error bars depict ±1 standard error of the mean) for the main effect of condition for approach behavior and initial reaction time (RT) across time points. The color legend for each task condition is shown above (approach reward, APP; avoid threat, AV; conflict with 2‐cent reward, CONF2; conflict with 4‐cent reward, CONF4; conflict with 6‐cent reward; CONF6). Pairwise comparisons are denoted with “*” if significant at p <.05 or “***” if significant at p <.001. There was a significant main effect of time for reaction time (p = .016) but not for approach behavior. There were no significant condition‐by‐time interactions for either measure. [Left] Approach behavior (N = 30) was measured by the avatar's end position on the runway in relation to the negative outcome and/or reward, and this ranged from −4 (full avoidance from the negative outcome and/or reward) to +4 (full approach to the negative outcome and/or reward). [Right] Reaction time (RT; N = 27) was defined as when participants initially moved the joystick during the decision‐making phase of the task. Due to a software error in the joystick configuration, RT data were unavailable for three subjects
FIGURE 4
FIGURE 4
Decision‐making phase ROI and whole‐brain results. (Top) Bar graphs depict group mean percent signal change (PSC) data (error bars depict ±1 standard error of the mean) for the main effect of condition during decision‐making for both amygdala (p = .0499) and dorsal anterior cingulate cortex (p = .0018) composite regions of interest (ROIs) across time points. The color legend for each task condition is above (approach reward, APP; avoid threat, AV; conflict with 2‐cent reward, CONF2; conflict with 4‐cent reward, CONF4; conflict with 6‐cent reward; CONF6). Pairwise comparisons are denoted with # if marginally significant at p <.10, “*” if significant at p <.05, or “**” if significant at p <.0083. Significant main effects of time were found in amygdala, striatum, and anterior insula ROIs (all p's ≤.004), but there were no significant condition‐by‐time interactions. (Bottom) Whole‐brain ANOVA F‐maps depicting the main effect of conflict decision‐making (i.e., comparing conflict (CONF2, CONF4, CONF6) to nonconflict (APP, AV) trials) across time points overlaid on the MNI152_T1_2009c T1‐weighted anatomical template brain in neurological orientation (i.e., left is left). Maps are thresholded at p <.01 and cluster‐corrected at 468 voxels based on multiple comparisons correction (α <.05, corrected). Color‐scheme for task‐related activation is such that red is greater PSC for conflict trials and blue is greater PSC for nonconflict trials (see color bars). Montreal Neurological Institute (MNI) coordinates for each slice displayed are as such: sagittal (x = 5) and coronal (y = 37)
FIGURE 5
FIGURE 5
Affective outcome phase ROI and whole‐brain results. (Top) Bar graphs depict group mean percent signal change (PSC) data (error bars depict ±1 standard error of the mean) for the main effect of outcome for amygdala (p = .028), dorsal anterior cingulate cortex (p = .006), striatum (p = .0012), and anterior insula (p < .001) composite regions of interest (ROIs) across time points. The color legend for each task condition is above. Pairwise comparisons are denoted with “*” if significant at p <.05, “**” if significant at p <.0083, or “***” if significant at p <.001. Significant main effects of time were found in amygdala, left dorsolateral prefrontal cortex, and right dorsolateral prefrontal cortex ROIs (all p's ≤.005), but there were no significant condition‐by‐time interactions. (Bottom) Whole‐brain ANOVA F‐maps depicting the main effect of outcomes (i.e., comparing negative to positive trials) across time points overlaid on the MNI152_T1_2009c T1‐weighted anatomical template brain in neurological orientation (i.e., left is left). Maps are thresholded at p <.01 and cluster‐corrected at 591 voxels based on multiple comparisons correction (α <.05, corrected). Color‐scheme for task‐related activation is such that red is greater PSC for negative trials and blue is greater PSC for positive trials (see color bars). Montreal Neurological Institute (MNI) coordinates for each slice displayed are as such: sagittal (x = 3), coronal (y = −5), and axial (z = −7)
FIGURE 6
FIGURE 6
Neural activation whole‐brain voxel‐wise ICC maps for decision‐making phase. Whole‐brain voxel‐wise intraclass correlation coefficient (ICC) maps for the conflict and nonconflict decision‐making contrasts across T1 and T2 overlaid on the MNI152_T1_2009c T1‐weighted anatomical template brain in neurological orientation (i.e., left is left). Color‐scheme for ICCs (see color bars) that were at least fair goes as such: red = fair reliability (ICCs = .4–.59), good reliability (ICCs = .60–.74), yellow = excellent reliability (ICCs = .75 or greater). Montreal Neurological Institute (MNI) coordinates for each slice (displayed from left to right) are as such: sagittal (top; x = −46, −6, 46), coronal (middle; y = 35, 15, −3), axial (bottom; z = 18, 0, −19)
FIGURE 7
FIGURE 7
Neural activation whole‐brain voxel‐wise ICC maps for outcome phase. Whole‐brain voxel‐wise intraclass correlation coefficient (ICC) maps for the negative and positive affective outcome contrasts across T1 and T2 overlaid on the MNI152_T1_2009c T1‐weighted anatomical template brain in neurological orientation (i.e., left is left). Color‐scheme for ICCs (see color bars) that were at least fair goes as such: red = fair reliability (ICCs = .4–.59), good reliability (ICCs = .60–.74), yellow = excellent reliability (ICCs = 0.75 or greater). Montreal Neurological Institute (MNI) coordinates for each slice (displayed from left to right) are as such: sagittal (top; x = −46, −6, 46), coronal (middle; y = 35, 15, −3), axial (bottom; z = 18, 0, −19)

Similar articles

Cited by

References

    1. American Psychiatric Association . (2013). Diagnostic and statistical manual of mental disorders (5th ed.). Washington, DC: American Psychiatric Association.
    1. Aupperle, R. L. , Melrose, A. J. , Francisco, A. , Paulus, M. P. , & Stein, M. B. (2015). Neural substrates of approach‐avoidance conflict decision‐making. Human Brain Mapping, 36(2), 449–462. 10.1002/hbm.22639 - DOI - PMC - PubMed
    1. Aupperle, R. L. , & Paulus, M. P. (2010). Neural systems underlying approach and avoidance in anxiety disorders. Dialogues in Clinical Neuroscience, 12(4), 517–531. - PMC - PubMed
    1. Aupperle, R. L. , Sullivan, S. , Melrose, A. J. , Paulus, M. P. , & Stein, M. B. (2011). A reverse translational approach to quantify approach‐avoidance conflict in humans. Behavioral Brain Research, 225, 455–463. 10.1016/j.bbr.2011.08.003 - DOI - PMC - PubMed
    1. Bach, D. R. , Guitart‐Masip, M. , Packard, P. A. , Miró, J. , Falip, M. , Fuentemilla, L. , & Dolan, R. J. (2014). Human hippocampus arbitrates approach‐avoidance conflict. Current Biology, 24, 541–547. 10.1016/j.cub.2014.05.051 - DOI - PMC - PubMed

Publication types

LinkOut - more resources