

Integrative analysis of cell state changes in lung fibrosis with peripheral protein biomarkers
- PMID: 33650774
- PMCID: PMC8033531
- DOI: 10.15252/emmm.202012871
Integrative analysis of cell state changes in lung fibrosis with peripheral protein biomarkers
Abstract
The correspondence of cell state changes in diseased organs to peripheral protein signatures is currently unknown. Here, we generated and integrated single-cell transcriptomic and proteomic data from multiple large pulmonary fibrosis patient cohorts. Integration of 233,638 single-cell transcriptomes (n = 61) across three independent cohorts enabled us to derive shifts in cell type proportions and a robust core set of genes altered in lung fibrosis for 45 cell types. Mass spectrometry analysis of lung lavage fluid (n = 124) and plasma (n = 141) proteomes identified distinct protein signatures correlated with diagnosis, lung function, and injury status. A novel SSTR2+ pericyte state correlated with disease severity and was reflected in lavage fluid by increased levels of the complement regulatory factor CFHR1. We further discovered CRTAC1 as a biomarker of alveolar type-2 epithelial cell health status in lavage fluid and plasma. Using cross-modal analysis and machine learning, we identified the cellular source of biomarkers and demonstrated that information transfer between modalities correctly predicts disease status, suggesting feasibility of clinical cell state monitoring through longitudinal sampling of body fluid proteomes.
Keywords: biomarker; data integration; fibrosis; proteomics; single-cell RNA-seq.
© 2021 The Authors. Published under the terms of the CC BY 4.0 license.
Conflict of interest statement
The authors declare that they have no conflict of interest.
Figures
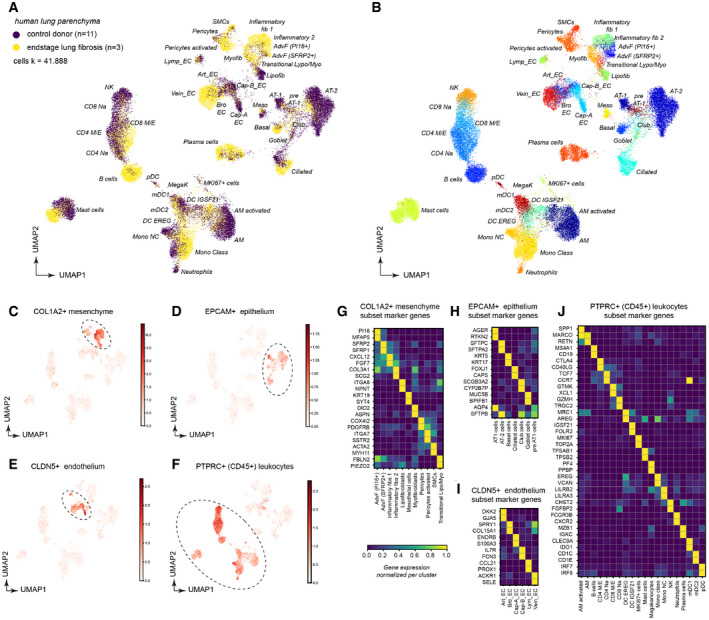
- A, B
Dimension‐reduced single‐cell transcriptomic data are visualized through Uniform Manifold Approximation and Projection (UMAP). The color code illustrates the disease status (A) and cell type identity (B) (see Dataset EV3 for abbreviations).
- C–F
The indicated marker genes were used to select clusters for subsetting into stromal cells (C), epithelial cells (D), endothelial cells (E), and leukocytes (F).
- G–J
The heatmaps show the relative gene expression levels for the indicated marker genes for the indicated stromal (G), epithelial (H), endothelial (I), and leukocyte (J) cell types.
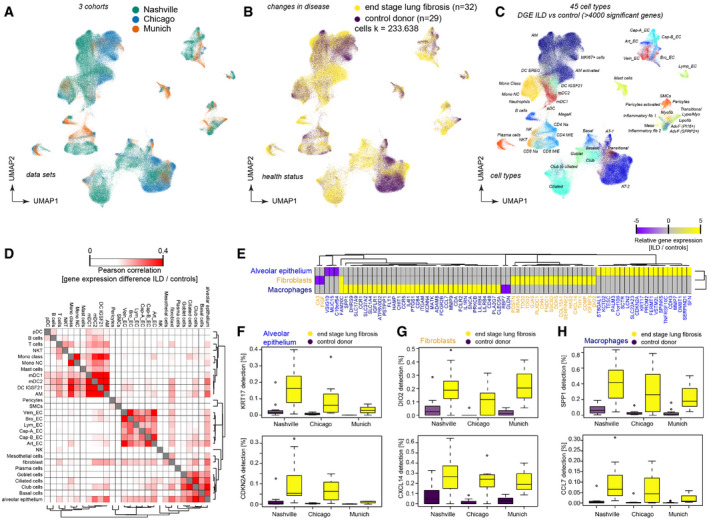
- A–C
Dimension‐reduced single‐cell transcriptomic data are visualized through multiple Uniform Manifold Approximation and Projections (UMAPs). The colors illustrate (A) patient cohorts, (B) disease status, (C) and cell type identity (see Table S3 for abbreviations).
- D
Differential gene expression between end‐stage lung disease patients and controls across cohorts was compared for the indicated cell type identities. The color code demonstrates similarities of gene expression changes calculated by Pearson correlation of the t‐value coefficient, which represents differences in the likelihood of detection for any gene between health and disease.
- E
The heatmap shows the top 79 genes differentially expressed in the indicated cell type identities.
- F–H
The box plots illustrate differences in mRNA detection for the indicated genes between tissues from end‐stage lung fibrosis patients in (F) alveolar epithelial cells, (G) fibroblasts, and (H) macrophages when compared to control tissue. The boxes represent the interquartile range, the horizontal line in the box is the median, and the whiskers represent 1.5 times the interquartile range (Chicago cohort: ILD n = 9, controls n = 8; Nashville cohort: ILD n = 20, controls n = 10; Munich cohort: ILD n = 3, controls n = 11).
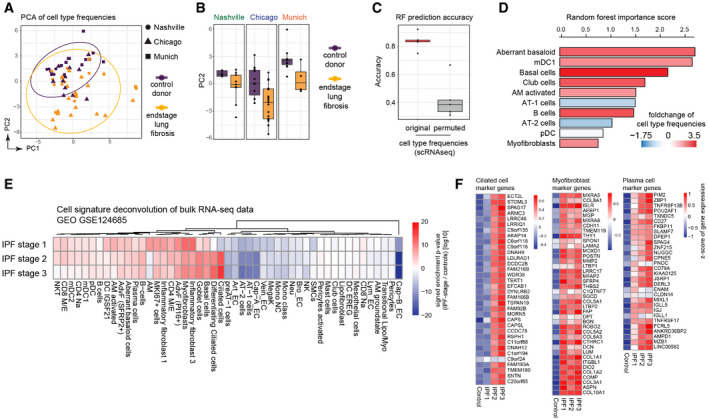
Principal components one (x‐axis) and two (y‐axis) illustrate the cell type frequencies in reduced dimensions. The shape of each point corresponds to the study cohort, and the points are colored by disease phenotype.
Box plots display principal component two across ILD patients (orange) and control samples (purple) for the three study cohorts. The boxes represent the interquartile range, the horizontal line in the box is the median, and the whiskers represent 1.5 times the interquartile range (Chicago cohort: ILD n = 9, controls n = 8; Nashville cohort: ILD n = 20, controls n = 10; Munich cohort: ILD n = 3, controls n = 11).
Box plot depicts random forest model prediction accuracies derived from fivefold cross‐validation using the original and permuted labels. The boxes represent the interquartile range, the horizontal line in the box is the median, and the whiskers represent 1.5 times the interquartile range (n = 5).
Barplot shows the random forest importance scores for the top ten most informative features.
The heatmap shows changes of the indicated cell type signatures in published bulk RNA‐seq data (GEO GSE124685) across different histopathological stages that represent increasing extent of fibrosis from stage 1–3, as determined by quantitative micro‐CT imaging and tissue histology (McDonough et al, 2019). Samples used in this study were 10 IPF and 6 control patients.
The heatmaps show z‐scores for the individual marker genes of the indicated cell types across IPF stages and controls.
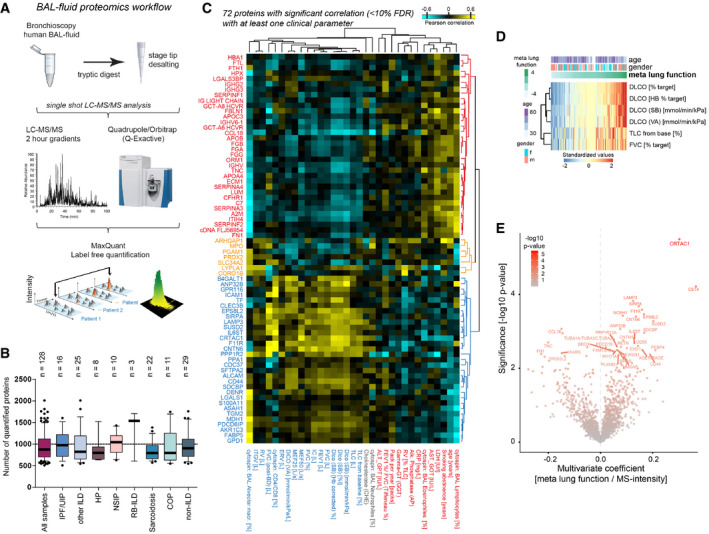
Proteomics workflow.
The box plots show the number of proteins quantified (y‐axis) across various diagnoses (x‐axis). The mean and 10–90 percentiles are shown; the dotted line marks 1,000 proteins (IPF n = 16, HP/EAA n = 8, COP n = 11, NSIP n = 10, RB‐IL, n = 3, Sarcoidosis n = 22, other ILDs n = 25, non‐IL, n = 29).
The heatmap shows the correlation coefficients between proteins (rows) and clinical parameters (columns).
The heatmap illustrates the computationally derived meta lung function variable combining multiple lung function parameters.
The volcano plot shows the multivariate regression coefficients (x‐axis) and the −log10 P‐value (y‐axis) for BALF protein abundance with the meta lung function.
- A, B
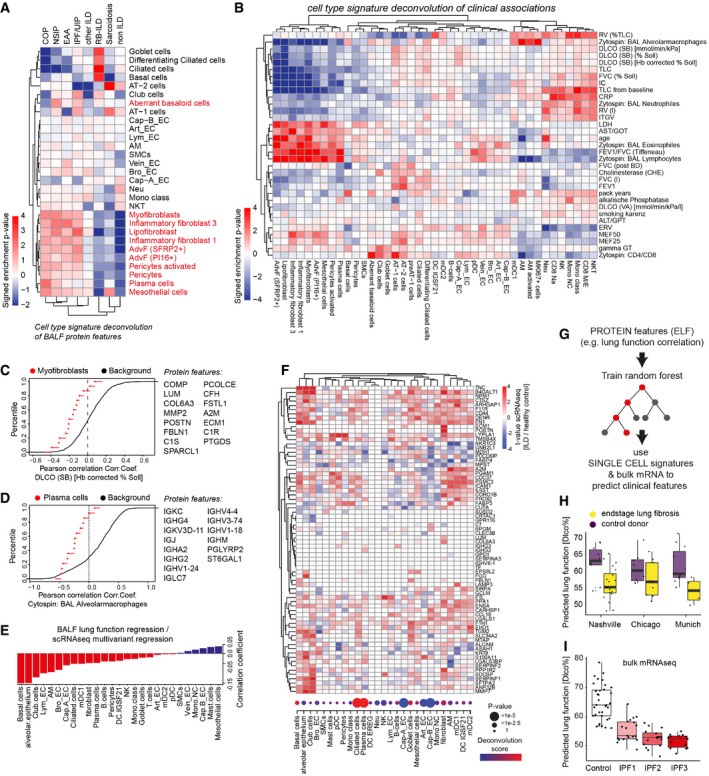
The heatmaps show the deconvolution scores of cell types across BALF samples grouped by diagnosis (A) and indicated clinical parameters (B).
- C, D
Empirical cumulative density plots depict the distribution of correlation coefficients for (C) Myofibroblast markers (red points) with DLCO and (D) Plasma cell markers (red points) with % alveolar macrophages in BAL in comparison to all background proteins (black line).
- E
Barplot displays coefficients derived from correlating lung function associations at the protein level with cell type‐specific ILD associations at the RNA level.
- F
The heatmap illustrates gene expression changes associated with lung fibrosis across indicated cell types (columns) for selected BALF protein biomarkers (rows). The dotplot visualizes the frequency changes of the indicated cell types inferred from the deconvolution of bulk mRNA data of ILD samples compared to controls (GSE47460). Samples used in this study from the LTRC n = 254 ILD patients and n = 108 controls.
- G
The protein features in BALF were used to train a random forest algorithm to predict lung function. The model was tested on transcriptional signatures from single‐cell RNA‐seq data to correctly predict reduced lung function in end‐stage lung fibrosis when compared to controls.
- H, I
Box plots show predicted lung function changes (DLCO%) in the three single‐cell RNA‐seq cohorts (Chicago cohort: ILD n = 9, controls n = 8; Nashville cohort: ILD n = 20, controls n = 10; Munich cohort: ILD n = 3, controls n = 11) in (H) and published bulk RNA‐seq of IPF samples from different histopathological stages (GEO GSE124685) (control n = 35, IPF1 n = 19, IPF2 n = 16, IPF3 n = 14) in (I). The boxes represent the interquartile range, the horizontal line in the box is the median, and the whiskers represent 1.5 times the interquartile range.
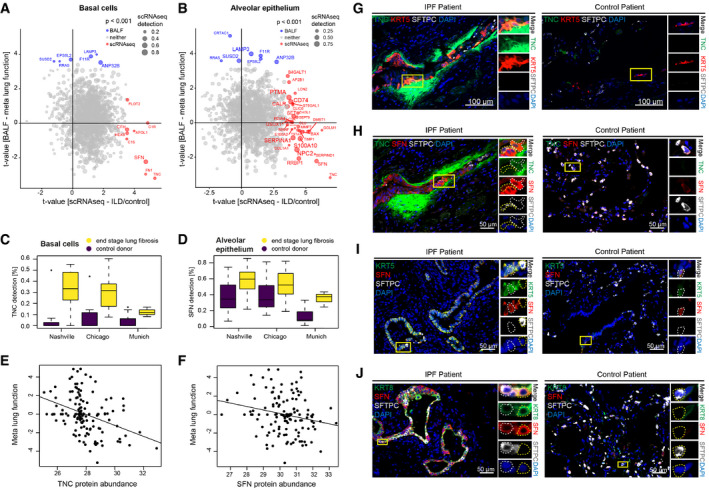
- A, B
Scatter plots stratify genes based on the protein lung function associations (y‐axis) and cell type‐specific ILD associations (x‐axis). The size of the dots represents the detection level of each gene in the corresponding cell type. Colors highlight genes with marginal associations at the protein and RNA levels.
- C, D
The box plots illustrate differences in mRNA detection for the indicated genes between tissues from end‐stage lung fibrosis patients in (C) basal cells and (D) alveolar epithelial cells when compared to controls. The boxes represent the interquartile range, the horizontal line in the box is the median, and the whiskers represent 1.5 times the interquartile range (Chicago cohort: ILD n = 9, controls n = 8; Nashville cohort: ILD n = 20, controls n = 10; Munich cohort: ILD n = 3, controls n = 11).
- E, F
The scatter plots show the positive correlation of the indicated proteins in BALF (MS‐intensity, x‐axis) with meta lung function (y‐axis).
- G–J
Immunofluorescence analysis of the indicated proteins and cell type markers in IPF (n = 3) and control samples (n = 3).
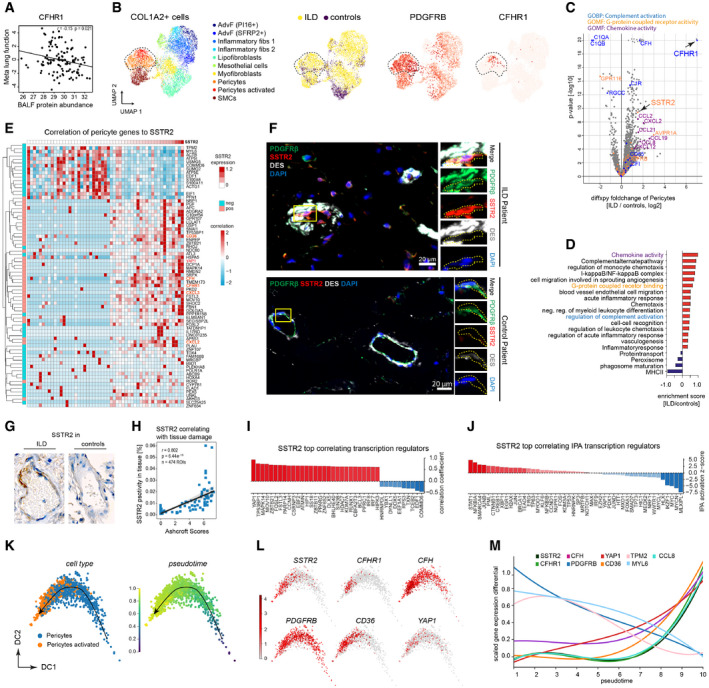
The scatter plots show the positive correlation of CFHR1 in BALF (MS‐intensity, x‐axis) with meta lung function (y‐axis).
The UMAPs show the subset of COL1A2+ mesenchymal cells in the integrated scRNA‐seq dataset, with the pericytes highlighted by the dotted line. From left to right, the colors represent the cell type identities, disease status, expression of the pericyte markers PDGFRB and CFHR1, respectively.
The volcano plot depicts the fold changes (x‐axis) and the −log10 P‐values (y‐axis) derived from the differential gene expression analysis using diffxpy between ILD and controls within the subset of PDGFRB+ pericytes (outlier values truncated).
The bar graphs show the top regulated gene categories after enrichment analysis using GO terms and UniProt keywords.
The heatmap shows the expression of genes most strongly associated with SSTR2 expression within the pericytes (left color bar indicates significant correlation or anti‐correlation).
Immunofluorescence analysis of SSTR2, the pericyte cell type marker PDGFRB and a marker for smooth muscle cells DESMIN in IPF (n = 3) and control samples (n = 3).
Representative images of immunohistochemistry analysis of SSTR2 protein expression in tissue regions (n = 474) from ILD patients (n = 53) and control patients (n = 26).
Correlation of immunohistochemistry signal of SSTR2 with Ashcroft scores.
The bar graph shows the genes most strongly correlated with SSTR2 belonging to the GO category “transcription regulators”. The dotted line marks a correlation coefficient of zero.
The bar graph shows the top correlated transcriptional regulators, predicted by ingenuity pathway analysis (IPA) for the SSTR2 gene‐gene correlations. The dotted line marks a correlation coefficient of zero.
Diffusion map of pericytes colored by cell type and inferred pseudotime represents pericyte differentiation.
Diffusion map of pericytes colored by the gene expression of indicated genes.
The line plot illustrates smoothed expression levels of the indicated genes across the pericyte pseudotime differentiation trajectory.
The scatter plots show the positive correlation of CFHR1 in BALF (MS‐intensity, x‐axis) with meta lung function (y‐axis).
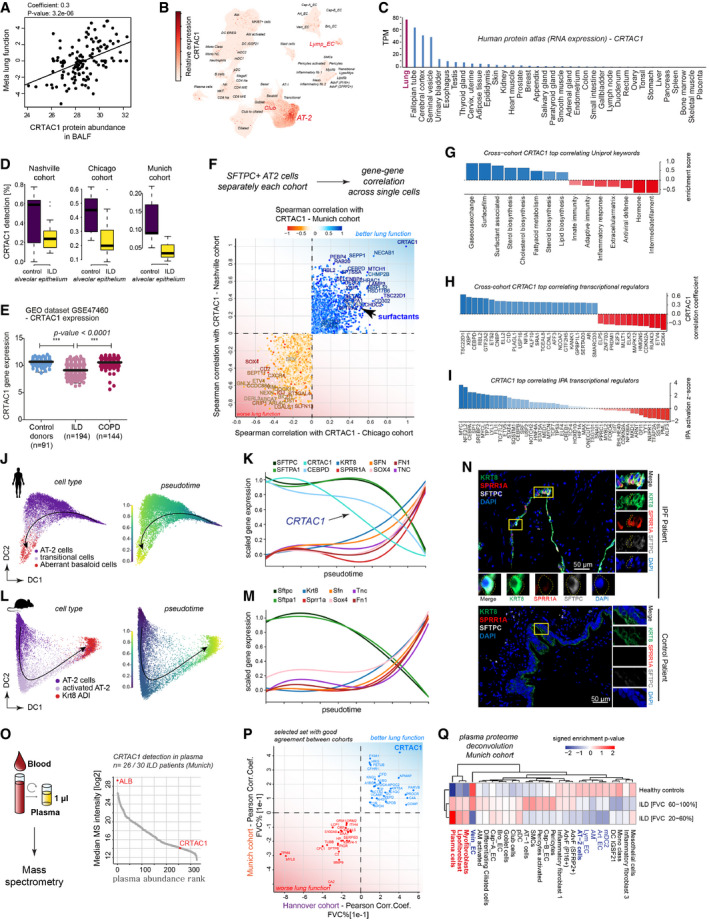
UMAP visualizes embedding of single‐cells colored by gene expression for CRTAC1, which is specifically expressed in alveolar type‐2 (AT2), Club and lymphatic endothelial (Lymp_EC) cells.
Relative expression level of CRTAC1 across human organs.
The box plots illustrate differences in mRNA detection for CRTAC1 in alveolar epithelial cells from fibrosis patients compared to control samples across the three indicated patient cohorts (Chicago cohort: ILD n = 9, controls n = 8; Nashville cohort: ILD n = 20, controls n = 10; Munich cohort: ILD n = 3, controls n = 11). The boxes represent the interquartile range, the horizontal line in the box is the median, and the whiskers represent 1.5 times the interquartile range.
Relative gene expression levels of CRTAC1 in GSE47460. Dots represent average expression in the tissue of individual patients. The line represents the mean, and error bars show SD. CRTAC1 is significantly downregulated in ILD but not COPD patients (P‐value < 0.0001) (one‐way ANOVA) (control donors n = 91, ILD n = 194, COPD n = 144).
For each single‐cell cohort, the gene–gene correlations with CRTAC1 within the SFTPC+ AT‐2 cells were calculated. The indicated genes were selected based on their common direction of correlation across cohorts.
The bar graph shows the gene categories most strongly correlated with CRTAC1 based on “UniProt keywords”. The dotted line marks a correlation coefficient of zero.
The bar graph shows the gene categories most strongly correlated with CRTAC1 belonging to the GO category of “transcription regulators”. The dotted line marks a correlation coefficient of zero.
The bar graph shows the top correlated transcriptional regulators, predicted by ingenuity pathway analysis (IPA) for the CRTAC1 gene–gene correlations. The dotted line marks a correlation coefficient of zero.
Diffusion map of human AT2 cells colored by cell type identity and inferred pseudotime.
The line plot illustrates smoothed expression levels of the indicated genes across the human AT2 pseudotime trajectory.
Diffusion map of mouse AT2 cells colored by cell type identity and inferred pseudotime.
The line plot illustrates smoothed expression levels of the indicated genes across the (Niu et al, 2019) mouse AT2 pseudotime trajectory.
Immunofluorescence analysis of SPRR1A, KRT8 as well as SFTPC in IPF (n = 3) and control samples (n = 2).
A high‐throughput experimental workflow for plasma proteomics (Niu et al, 2019) allowed for profiling of two independent cohorts of ILD patients (Munich, n = 30 and Hannover, n = 81; healthy age‐matched controls, n = 30). All proteins quantified in plasma are shown, ranked by their abundance measured by mass spectrometry (MS‐intensity).
The indicated proteins from the plasma analysis were selected based on their common direction of correlation with patient lung function in two independent patient cohorts with distinct clinical characteristics.
The heatmap shows the predicted relative contribution of lung cell types to the association of protein biomarker signatures in plasma with lung function (forced vital capacity—FVC). Patients were split in two groups, one with a mild decline in lung function [FVC 60–100%] and one with severe loss of lung function [FVC 20–60%] and compared to healthy age‐matched controls.
References
-
- Ambrosini V, Zompatori M, De Luca F, Antonia D,Allegri V, Nanni C, Malvi D, Tonveronachi E, Fasano L, Fabbri M et al (2010) 68Ga‐DOTANOC PET/CT allows somatostatin receptor imaging in idiopathic pulmonary fibrosis: preliminary results. J Nucl Med 51: 1950–1955 - PubMed
Publication types
MeSH terms
Substances
Grants and funding
LinkOut - more resources
Full Text Sources
Other Literature Sources
Medical
Molecular Biology Databases
Miscellaneous
