. 2021 May;14(3):1084-1106.
doi: 10.1111/1751-7915.13776. Epub 2021 Mar 2.

Escherichia coli segments its controls on carbon-dependent gene expression into global and specific regulations

Affiliations

Escherichia coli segments its controls on carbon-dependent gene expression into global and specific regulations

Qing Pan et al. Microb Biotechnol. 2021 May.

Abstract

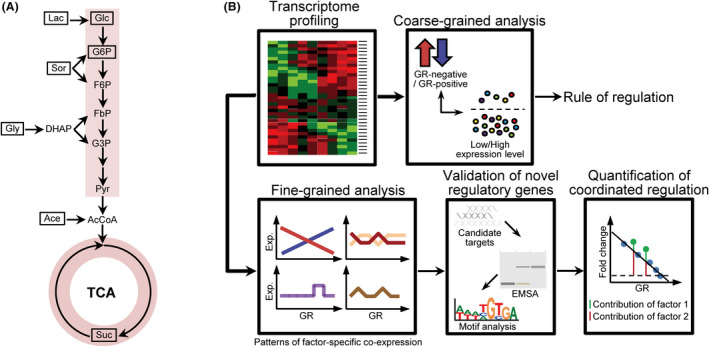
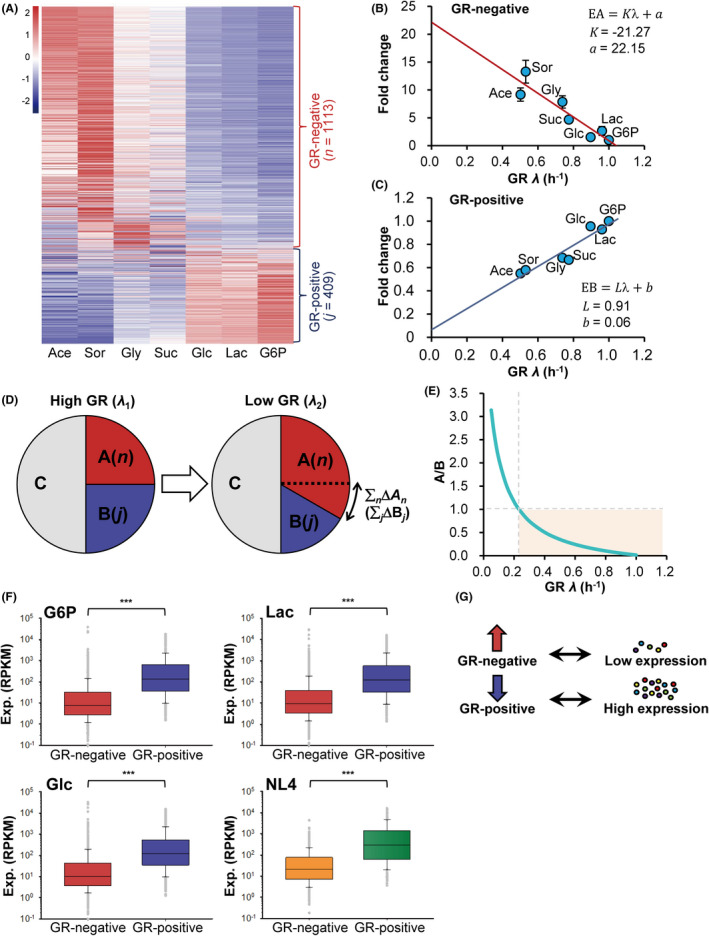
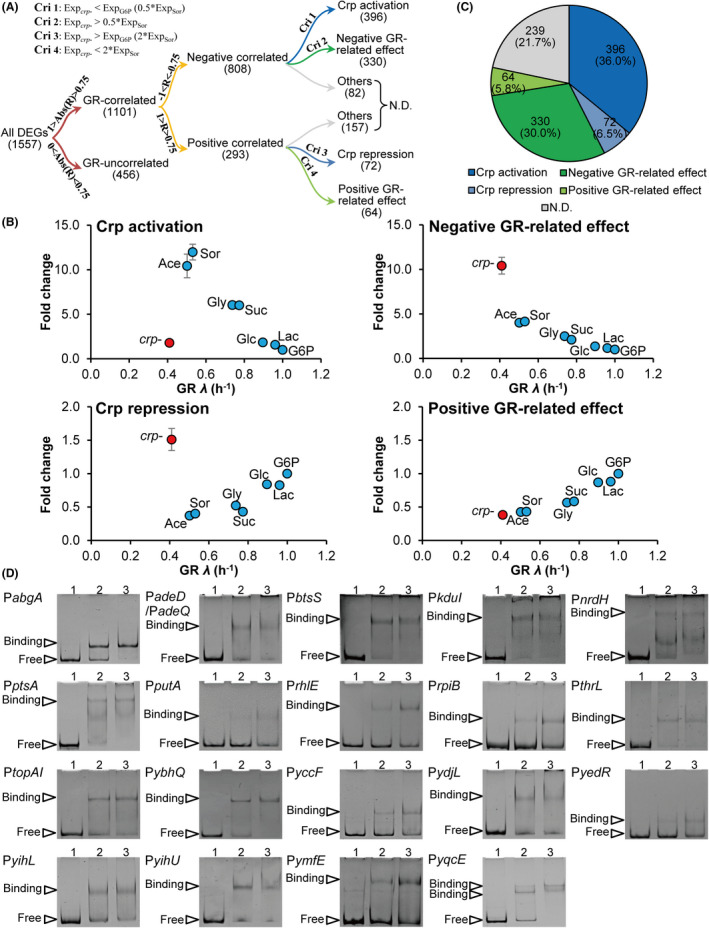
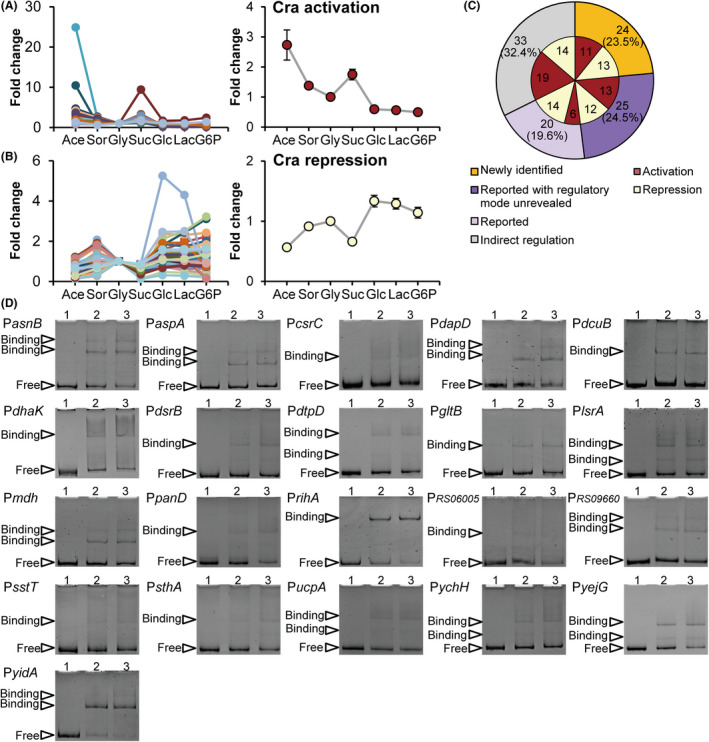
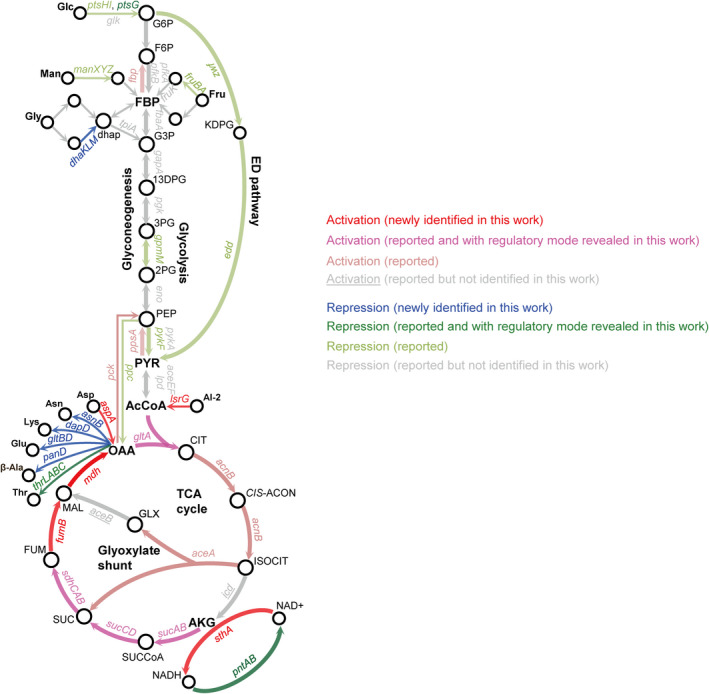
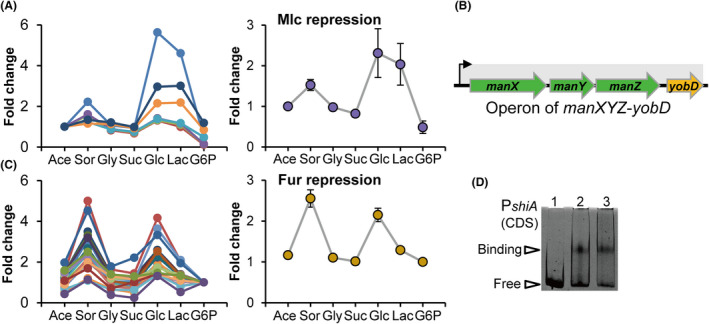
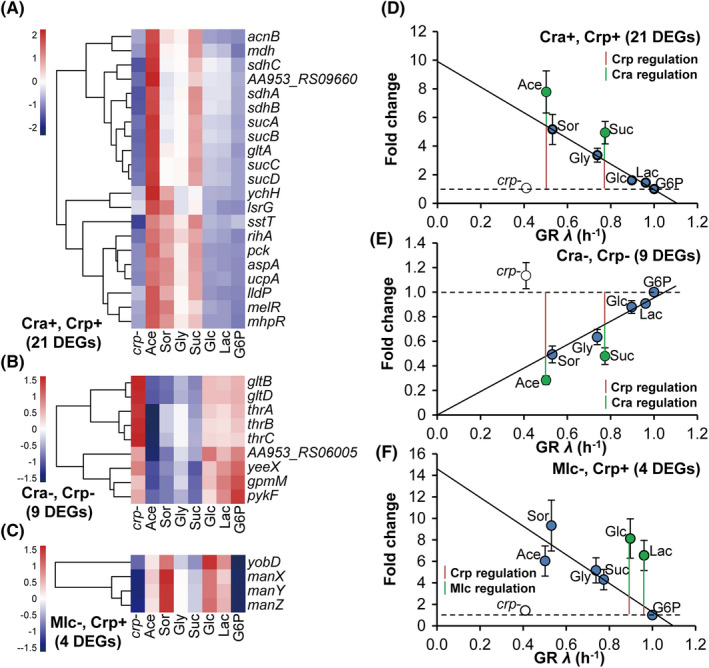
How bacteria adjust gene expression to cope with variable environments remains open to question. Here, we investigated the way global gene expression changes in E. coli correlated with the metabolism of seven carbon substrates chosen to trigger a large panel of metabolic pathways. Coarse-grained analysis of gene co-expression identified a novel regulation pattern: we established that the gene expression trend following immediately the reduction of growth rate (GR) was correlated to its initial expression level. Subsequent fine-grained analysis of co-expression demonstrated that the Crp regulator, coupled with a change in GR, governed the response of most GR-dependent genes. By contrast, the Cra, Mlc and Fur regulators governed the expression of genes responding to non-glycolytic substrates, glycolytic substrates or phosphotransferase system transported sugars following an idiosyncratic way. This work allowed us to expand additional genes in the panel of gene complement regulated by each regulator and to elucidate the regulatory functions of each regulator comprehensively. Interestingly, the bulk of genes controlled by Cra and Mlc were, respectively, co-regulated by Crp- or GR-related effect and our quantitative analysis showed that each factor took turns to work as the primary one or contributed equally depending on the conditions.


Conflict of interest statement

None declared.

Figures

Fig. 1
Fig. 1
Scheme of the workflow for uncovering regulatory strategies of E. coli grown in carbon substrates with distinct features. A. Entries of the seven carbon substrates into the central carbon metabolism pathways. B. Scheme of the systematic workflow. The workflow consists of four main procedures: (i) high resolution RNA‐seq for transcriptome profiling; (ii) systematic analysis of the co‐expression of the differentially expressed genes identified in the seven expression profiles in the coarse‐grained or fine‐grained scale, respectively; (iii) validation of novel genes regulated by key transcription factors; (iv) quantification of the individual contribution of each factor to genes under their coordinated regulations.
Fig. 2
Fig. 2
Correlation between gene expression level and its GR‐dependent expression trend. A. Heatmap of expression of 1522 up‐ and down‐regulated DEGs of CDS in seven carbon substrates. Ordered transcriptional levels (RPKM) of selected genes were visualized by the ‘Heatmap’ program, normalized using z‐score at row. See Materials and Methods. B, C. Correlation of the change fold of GR‐negative (panel B) and GR‐positive (panel C) genes with GR. Gene expression in G6P was normalized to 1 and that in other carbon substrates was each determined relative to this value to obtain fold change. In each carbon substrate, the average fold change of the 1113 GR‐negative genes of CDS (panel B) or 409 GR‐positive genes of CDS (panel C) was calculated and expressed as average ± SEM. The linear lines and equations with slopes (K and L) and y‐axis intercepts (a and b) described the best fits of the data. D. Illustration of the proteome partition model. When GR reduced, the protein mass of a GR‐negative protein A increased, whereas the protein mass of a GR‐positive protein B decreased, with n and j representing the numbers of proteins. Proteins that remained constant were indicated by C. Basing on the model, the total increased amount of GR‐negative proteins (ΣnΔAn) is equal to the total decreased amount of GR‐positive proteins (ΣjΔBj); see Note S1. E. Ratio of the average protein mass of GR‐negative genes A to that of GR‐positive genes B at various GRs. The shaded region indicates where A/B < 1; see equation (II) in Note S1. F. Expression levels of the GR‐negative and GR‐positive genes in G6P, Lac, Glc and NL4 [a nitrogen rich condition with GR at 0.9 h‐1 (Li, et al., 2019)]. ‘***’ indicates P‐value < 0.001 by Student’s t‐test. G. Diagram of the correlation between gene expression level and its GR‐dependent expression trend: a highly expressed gene tends to show GR‐positive expression or lower its expression, and a lowly expressed gene tends to show GR‐negative expression or enhance its expression.
Fig. 3
Fig. 3
Crp‐ and GR‐related effect controlled genes and their characteristics. A. A diagram outlining the ‘decision tree’ used to classify which genes are Crp‐ or GR‐related effect‐dependent. ‘Abs’ means absolute value. ‘N.D.’ means not determined. ‘Cri’ means criterion. B. The fold change of genes controlled by Crp‐ or GR‐related effect against GR. Gene expression was normalized as in Fig. 2B. C. Distribution of 1101 genes responding to the GR categorized in each regulatory group. See Data S2. D. Validation of Crp‐cAMP binding promoters by EMSA. 0.25 pmol of each promoter fragment was incubated with 0, 3, 6 pmol Crp plus 1 mM cAMP from lane 1 to 3 as described in Materials and Methods. Free and binding probes were, respectively, indicated by triangles next to the image. At least two independent repeats were performed for each assay. See Data S4 and S5.
Fig. 4
Fig. 4
Genes regulated by Cra and their characteristics. A,B. The fold change of genes showing expression peaks (panel A) or valleys (panel B) in acetate (Ace) and succinate (Suc) (plot on the left) in various carbon substrates. In each panel, gene expression in glycerol was normalized to 1 and gene expression in other carbon substrates was determined relative to this value to obtain fold change. The average fold change of genes in each panel was calculated and expressed as average ± SEM (plot on the right). C. Distribution of all 102 genes regulated by Cra into groups of newly identified, reported with regulatory mode unrevealed, reported and indirect regulation, as well as the classification of Cra regulatory strategy identified in this study. See Data S6. D. Validation of Cra binding promoters by EMSA. 0.25 pmol of each promoter fragment was incubated with 0, 1, 2 pmol Cra from lane 1 to 3 as described in Materials and Methods. Free and binding probes were, respectively, indicated by triangles next to the image. At least two independent repeats were performed for each assay. See Data S6 and S7.
Fig. 5
Fig. 5
The expanded regulatory interactions of Cra in E. coli, based on the function of 69 Cra directly regulatory genes. Cra‐activated genes were enriched in the TCA cycle, glyoxylate shunt, gluconeogenesis, catabolism of carbon substrates which generate intermediate metabolites going into the TCA cycle and the reaction consuming NAD + to generate NADH; Cra‐repressed genes were enriched in glycolysis, PTS, other degradation pathways generating intermediates that goes into the glycolysis pathway, Entner–Doudoroff (ED) pathway, amino acid biosynthesis and the reaction consuming NADH to generate NAD+. See Data S8.
Fig. 6
Fig. 6
Genes regulated by Mlc or Fur, and their characteristics. A. The fold change of genes responding specifically to glucose and lactose (plot on the left) in various carbon substrates. Gene expression in acetate (Ace) was normalized to 1 and gene expression in other carbon substrates was determined relative to this value to obtain fold change. The average fold change of genes was calculated and expressed as average ± SEM (plot on the right). See Data S9. B. Diagram of manXYZyobD operon. The black arrow indicates the TSS (Transcription start site) of the operon (in gray). C. The fold change of genes responding specifically to sorbitol (Sor) and glucose (Glc) in various carbon substrates (plot on the left). Gene expression in G6P was normalized to 1 and gene expression in other carbon substrates was determined relative to this value to obtain fold change. The average fold change of genes was calculated and expressed as average ± SEM (plot on the right). See Data S10. D. Validation of Fur binding promoters by EMSA. 0.25 pmol of each promoter fragment was incubated with 0, 20, 40 pmol Fur in the presence of 200 μM CoCl2 from lane 1 to 3 as described in Materials and Methods. Free and binding probes were, respectively, indicated by triangles next to the image. At least two independent repeats were performed for each assay. See Data S10.
Fig. 7
Fig. 7
Genes under coordinated regulations. A–C. Heatmap of the expression of genes co‐activated by Cra and Crp (panel A), co‐repressed by Cra and Crp (panel B) and co‐regulated by Mlc and Crp (panel C). See Data S11. Genes expression of the wild type grown in the seven carbon substrates and of the crp‐null strain grown in glucose was shown. Data were normalized as in Fig. 2A and clustered. D–F. Quantification of the contributions of Cra, Mlc and Crp to genes under their coordinated regulations. Gene expression in G6P was normalized to 1, and that in other conditions was each determined relative to this value to obtain fold change. The average fold change of the 22 genes co‐activated by Cra and Crp in panel A, the 9 genes co‐repressed by Cra and Crp in panel B and the four genes co‐regulated by Mlc and Crp was individually calculated, expressed as average ± SEM and was plotted against GR in each growth condition. The solid black and linear lines described the best fits of the data of Sor, Gly, Glc, Lac and G6P (panel D and panel E) and the data of Ace, Sor, Gly, Suc and G6P (panel F). The dashed lines indicated the average fold change in G6P. The individual contributions of Cra and Crp in Suc or in Ace to the increased expression (panel D) or to the decreased expression (panel E) when compared to that in G6P were indicated by the lengths of green and red lines. The individual contributions of the Mlc and Crp in Glc or in Lac to the increased expression when compared to that in G6P was indicated by the lengths of green and red lines (panel F).

Similar articles

Cited by

References

    1. Alteri, C.J. , Himpsl, S.D. , and Mobley, H.L. (2015) Preferential use of central metabolism in vivo reveals a nutritional basis for polymicrobial infection. PLoS Pathog 11: e1004601. - PMC - PubMed
    1. Bailey, T.L. , Boden, M. , Buske, F.A. , Frith, M. , Grant, C.E. , Clementi, L. , et al. (2009) MEME SUITE: tools for motif discovery and searching. Nucleic Acids Res 37: W202–W208. - PMC - PubMed
    1. Basan, M. , Hui, S. , Okano, H. , Zhang, Z. , Shen, Y. , Williamson, J.R. , and Hwa, T. (2015) Overflow metabolism in Escherichia coli results from efficient proteome allocation. Nature 528: 99–104. - PMC - PubMed
    1. Benning, C. (1998) Biosynthesis and function of the sulfolipid sulfoquinovosyl diacylglycerol. Annu Rev Plant Physiol Plant Mol Biol 49: 53–75. - PubMed
    1. Bertin, Y. , Chaucheyras‐Durand, F. , Robbe‐Masselot, C. , Durand, A. , de la Foye, A. , Harel, J. , et al. (2013) Carbohydrate utilization by enterohaemorrhagic Escherichia coli O157:H7 in bovine intestinal content. Environ Microbiol 15: 610–622. - PMC - PubMed

Publication types

MeSH terms