. 2021 Mar 9;5(5):1291-1304.
doi: 10.1182/bloodadvances.2020002736.

A BCMAxCD3 bispecific T cell-engaging antibody demonstrates robust antitumor efficacy similar to that of anti-BCMA CAR T cells

A BCMAxCD3 bispecific T cell-engaging antibody demonstrates robust antitumor efficacy similar to that of anti-BCMA CAR T cells

David J DiLillo et al. Blood Adv. .

Abstract

CD3-engaging bispecific antibodies (bsAbs) and chimeric antigen receptor (CAR) T cells are potent therapeutic approaches for redirecting patient T cells to recognize and kill tumors. Here we describe a fully human bsAb (REGN5458) that binds to B-cell maturation antigen (BCMA) and CD3, and compare its antitumor activities vs those of anti-BCMA CAR T cells to identify differences in efficacy and mechanism of action. In vitro, BCMAxCD3 bsAb efficiently induced polyclonal T-cell killing of primary human plasma cells and multiple myeloma (MM) cell lines expressing a range of BCMA cell surface densities. In vivo, BCMAxCD3 bsAb suppressed the growth of human MM tumors in murine xenogeneic models and showed potent combinatorial efficacy with programmed cell death protein 1 blockade. BCMAxCD3 bsAb administration to cynomolgus monkeys was well tolerated, resulting in the depletion of BCMA+ cells and mild inflammatory responses characterized by transient increases in C-reactive protein and serum cytokines. The antitumor efficacy of BCMAxCD3 bsAb was compared with BCMA-specific CAR T cells containing a BCMA-binding single-chain variable fragment derived from REGN5458. Both BCMAxCD3 bsAb and anti-BCMA CAR T cells showed similar targeted cytotoxicity of MM cell lines and primary MM cells in vitro. In head-to-head in vivo studies, BCMAxCD3 bsAb rapidly cleared established systemic MM tumors, whereas CAR T cells cleared tumors with slower kinetics. Thus, using the same BCMA-binding domain, these results suggest that BCMAxCD3 bsAb rapidly exerts its therapeutic effects by engaging T cells already in place at the tumor site, whereas anti-BCMA CAR T cells require time to traffic to the tumor site, activate, and numerically expand before exerting antitumor effects.


Conflict of interest statement

Conflict-of-interest disclosure: All authors are employees and equity-shareholders of Regeneron Pharmaceuticals.

Figures

None
Graphical abstract
Figure 1.
Figure 1.
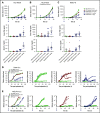
BCMAxCD3 bsAb mediates human T-cell activation and redirected killing of MM cell lines and human plasma cells, but not B cells, and stabilizes cell surface BCMA expression. (A-G) Adherent cell-depleted PBMCs were incubated with NCI-H929 (A-B) or MOLP-8 (C-G) target cells, plus a range of concentrations of BCMAxCD3 bsAb (blue circles), CD3-binding control bsAb (red squares), or bivalent parental anti-BCMA mAb (yellow triangles) for 48 hours. In panels A and C, cell viability was measured by flow cytometry analysis, and values represent mean ± SEM frequencies of viable target cells from duplicate samples; in panels B and D, CD25 expression on CD8+ T cells was assessed by flow cytometry analysis in the same samples, and values represent mean ± SEM frequencies of CD25+ cells among CD8+ cells. Cytokine concentrations in the tissue culture supernatant of MOLP-8 cell cultures were assessed by cytometric bead array, and values represent concentrations of IFN-γ (panel E), tumor necrosis factor-α (TNF-α) (panel F) and granzyme B (panel G) at the end of the assay. (H) Enriched CD138+ human BM plasma cells were cultured with autologous PBMCs, with viability of CD138+SLAMF7+ cells analyzed as in panel A. (I) Cell viability of CD20+ B cells present in the cultures from panel H. (J) BCMAxCD3 bsAb binding leads to the accumulation of cell surface BCMA on MM cell lines. NCI-H929 or MOLP-8 MM cells were incubated at 37°C overnight with media alone (lavender bars), 100 µg/mL BCMAxCD3 bsAb (blue and red bars), or 1 µM of the γ-secretase inhibitor DAPT (yellow bars). The following day, cells were washed, cooled to 4°C, and stained for 1 hour without (blue bars) or with (lavendar, red, yellow bars) 100 μg/mL BCMAxCD3 bsAb. After washing, bound antibody was detected with fluorescently labeled anti–human immunoglobulin G antibody and assessed by using flow cytometry analysis (all samples). Values represent mean ± SEM fold-increase in BCMAxCD3 bsAb binding (mean fluorescent intensity [MFI]) compared with cells incubated overnight in media (black bars) from 3 to 4 independent experiments. Significant differences between the indicated samples were determined by ordinary 1-way analysis of variance followed by Dunnett’s multiple comparisons test. ***P = .0002, ****P < .0001.
Figure 2.
Figure 2.
BCMAxCD3 bsAb shows antitumor efficacy in a dose-dependent manner in xenogeneic MM tumor models. (A-C) NSG mice were coimplanted subcutaneously with a mixture of NCI-H929 MM cells and human PBMCs (A-B) or MOLP-8 MM cells and human PBMCs (C). The mice were either immediately treated with the indicated dose of BCMAxCD3 bsAb, CD3-binding control bsAb, or phosphate-buffered saline (PBS) and continued to be dosed twice weekly, for a total of 7 doses (panels A and C), or tumors were allowed to establish for 5 days before twice weekly dosing was initiated (panel B, 7 total doses). In panels A-C, values in the top graphs represent mean ± SEM tumor volumes (n ≥ 7 per group) for the indicated treatments; values in the middle and bottom graphs represent serum IFN-γ and IL-2 concentrations, respectively, from individual animals 4 hours after the first injection of the indicated bsAb. Bars indicate mean ± SEM values. Significant differences between the indicated sample and mice given CD3-binding control bsAb, as measured by 2-way analysis of variance, are indicated. **P < .01. (D) NSG mice that had been engrafted intraperitoneally with PBMCs were injected intravenously with U266-Luc MM cells on day 0. After 31 days, the mice bearing established tumors were treated with 4 mg/kg BCMAxCD3 bsAb, CD3-binding control bsAb, or PBS and continued to be dosed twice weekly, for a total of 6 doses. (E) NSG mice that had been engrafted intraperitoneally with PBMCs were injected intravenously with MOLP-8-Luc MM cells and immediately treated with 0.4 mg/kg BCMAxCD3 bsAb, CD3-binding control bsAb, or PBS and continued to be dosed twice weekly, for a total of 3 doses. In panels D-E, values in the left graphs represent mean ± SEM radiance measurements of tumor burden as determined by BLI imaging using an IVIS Spectrum device (n = 5 mice per group), with individual BLI data shown in the right graphs. Mice without tumors (open black diamonds) are included in each panel to indicate background BLI. BLI images corresponding to data in panels D and E are shown in supplemental Figures 5 and 6, respectively. Blue arrows indicate the time at which mice were given their first dose of antibody.
Figure 3.
Figure 3.
BCMAxCD3 bsAb shows antitumor efficacy in syngeneic BCMA+tumor models and synergizes with PD-1 blockade in vivo. (A-B) C57BL/6 mice that express human CD3 in place of murine CD3 (CD3-humanized mice) were implanted subcutaneously with either B16 melanoma (A) or MC38 colon carcinoma cells (B) that stably express human BCMA (B16/hBCMA and MC38/hBCMA, respectively). The mice were immediately treated with either CD3-binding control bsAb (4 mg/kg) or BCMAxCD3 bsAb (4 or 0.4 mg/kg), followed by twice weekly dosing for a total of 3 doses. Values in the left graphs indicate mean ± SEM tumor volumes (n ≥ 6 per group) for the indicated treatments, with individual tumor growth curves shown in the right graphs. Significant differences between the indicated sample and mice receiving CD3-binding control bsAb, as measured by 2-way analysis of variance, are indicated: **P < .01. (C) CD3-humanized mice were implanted subcutaneously with MC38/hBCMA cells, and the tumors were allowed to establish for 3 days, at which time the mice were administered a CD3-binding control bsAb or BCMAxCD3 bsAb at 0.04 mg/kg, along with either anti-mouse PD-1 antibody or an isotype-matched control antibody at 4 mg/kg. Mice were given subsequent antibody doses on days 7 and 10. Values in the top graph represent mean ± SEM tumor volumes (n = 10 per group) for the indicated treatments, with individual tumor growth curves shown in the graphs below. Blue arrows indicate the time at which mice received their first dose of antibody. Significant differences between the indicated sample and mice receiving CTL bsAb + CTL Ab, as measured by 2-way analysis of variance, are indicated: *P < .05, **P < .01. Significant differences between the indicated sample and mice receiving BCMAxCD3 bsAb + CTL Ab, as measured by 2-way analysis of variance, are indicated: ##P < .01.
Figure 4.
Figure 4.
BCMAxCD3 pharmacokinetic parameters and pharmacology in cynomolgus monkeys. (A) Cynomolgus monkeys were administered 5 weekly doses of BCMAxCD3 bsAb at dose levels of 0.1, 1, and 10 mg/kg. Blood was harvested at the indicated time points and processed to serum for analysis of BCMAxCD3 bsAb concentrations. Values represent mean ± SEM BCMAxCD3 bsAb levels at the indicated time points (n = 6-12 animals per group). Arrows indicate when BCMAxCD3 bsAb was dosed in the animals. (B-C) Serum from the same animals was also analyzed for C-reactive protein (B) and IL-6 (C) levels at the indicated time points, with values representing concentrations of these molecules from individual animals at the indicated time points. (D) In a separate study, cynomolgus monkeys were administered a single dose of BCMAxCD3 bsAb at 0.1, 1, and 5 mg/kg or vehicle control, with BM aspirates assessed by flow cytometry analysis 7 days later. Values represent the frequency of CD138+ plasma cells, CD20+ B cells, and CD2+ T cells among CD45+ leukocytes in the BM from individual animals (n = 3 per group). Horizontal lines indicate means, and error bars indicate SEM.
Figure 5.
Figure 5.
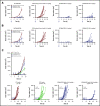
BCMAxCD3 bsAb and BCMA-directed CAR T cells show similar antitumor activities both in vitro and in vivo but with different kinetics. (A) Primary T cells were activated and expanded in vitro, and lentivirally transduced with a CAR construct encoding a single-chain variable fragment derived from the REGN5458 anti-BCMA binding arm, human CD8 hinge and transmembrane domains, and intracellular 4-1BB and CD3z signaling domains. The BCMA CAR T cells or untransduced activated/expanded T cells were then cocultured with NCI-H929 MM cells (left) or MOLP-8 MM cells (right) for 3 hours, in some cases with the addition of 2.5 μg/mL of BCMAxCD3 bsAb or a CD3-binding control bsAb. Cytotoxicity was determined by calcein-release assay, and values represent the mean ± SEM frequencies of maximum lysis determined at the indicated E:T ratio. E:T ratios for the BCMA CAR T-cell samples were normalized to the frequency of CAR+ cells, as determined by green fluorescent protein expression. (B) BCMA CAR-transduced or untransduced activated/expanded T cells were prepared as in panel A and cocultured with BM cells from an MM patient on HS-5 stromal cells for 12 hours, in some cases with the addition of 5 μg/mL BCMAxCD3 bsAb or a CD3-binding control bsAb. Values represent the frequency of live CD138+SLAMF7+ MM blasts from single replicates as determined by flow cytometry analysis. Results are representative of 3 independent experiments, each with different MM donors. E:T ratios for the BCMA CAR T-cell samples were normalized as in panel A. (C) NSG mice that were engrafted with PBMCs were injected intravenously with OPM-2-Luc MM cells on day 0 and were given BCMAxCD3 bsAb or a CD3-binding control bsAb (0.4 mg/kg) on day 15 (left graph) or day 21 (right graph). The mice continued to be dosed twice weekly for a total of 3 doses. (D) NSG mice were injected intravenously with OPM-2-Luc MM cells on day 0, and on day 15 (left graph) or day 21 (right graph) the mice were treated with 2 × 10⁶ CAR+ control CAR T cells (expressing an irrelevant single-chain variable fragment/4-1BB/CD3z CAR) or anti-BCMA CAR T cells. Values represent individual radiance measurements of tumor burden as determined by BLI imaging using an IVIS Spectrum device (n = 5 mice per group). BLI images corresponding to data from animals treated on day 15 and day 21 are shown in supplemental Figures 14 and 15, respectively. Blue arrows indicate the time of the first bsAb or CAR T cell dose.
Figure 6.
Figure 6.
Different kinetics of T-cell activation and cytokine production in BCMAxCD3 bsAb– and BCMA CAR T-cell–treated animals. NSG mice were implanted intravenously with OPM-2-Luc tumors, engrafted with PBMCs, and treated on day 21 with either BCMAxCD3 bsAb or CD3-binding control bsAb (0.4 mg/kg) as in Figure 5C, or control CAR T cells or BCMA CAR T cells (2 × 10⁶ CAR+ cells) as in Figure 5D. Mice were bled at various time points after dosing to measure serum cytokines, and femurs were harvested (2 femurs pooled from each mouse) and assessed by immunofluorescence staining with flow cytometry analysis. n = 5 mice per group. (A) Values represent mean ± SEM serum concentrations of human IFN-γ at 4 hours, 3 days, and 7 days after dosing. (B) Values represent mean ± SEM absolute numbers of total T cells (left panel) or CAR+ T cells (right panel) from 2 pooled femurs from each mouse at the indicated time point after dosing. (C-D) Values represent individual frequencies of CD25+ (C) and 4-1BB+ (D) cells among total T cells from bsAb-treated mice (left graphs), and CAR or CAR+ T cells from BCMA CAR T-cell–treated mice (right graphs). (E) Values represent individual mean fluorescence intensity (MFI) of intracellular granzyme B expression by total T cells from bsAb-treated mice (left graphs) and CAR or CAR+ T cells from BCMA CAR T-cell–treated mice (right graphs). Bars indicate mean ± SEM values. Significant values determined by the Mann-Whitney test are indicated: *P < .05 and **P < .01 compared with control-treated animals at the indicated time point.

References

    1. Röllig C, Knop S, Bornhäuser M. Multiple myeloma. Lancet. 2015;385(9983):2197-2208. - PubMed
    1. Siegel RL, Miller KD, Jemal A. Cancer statistics, 2020. CA Cancer J Clin. 2020;70(1):7-30. - PubMed
    1. Gozzetti A, Candi V, Papini G, Bocchia M. Therapeutic advancements in multiple myeloma. Front Oncol. 2014;4:241. - PMC - PubMed
    1. Kumar SK, Dimopoulos MA, Kastritis E, et al. . Natural history of relapsed myeloma, refractory to immunomodulatory drugs and proteasome inhibitors: a multicenter IMWG study. Leukemia. 2017;31(11):2443-2448. - PubMed
    1. Batlevi CL, Matsuki E, Brentjens RJ, Younes A. Novel immunotherapies in lymphoid malignancies. Nat Rev Clin Oncol. 2016;13(1):25-40. - PMC - PubMed

Publication types

Substances