. 2021 Jun;20(3):925-940.
doi: 10.1007/s10237-021-01420-0. Epub 2021 Mar 2.

Mechanics informed fluoroscopy of esophageal transport

Affiliations

Mechanics informed fluoroscopy of esophageal transport

Sourav Halder et al. Biomech Model Mechanobiol. 2021 Jun.

Abstract

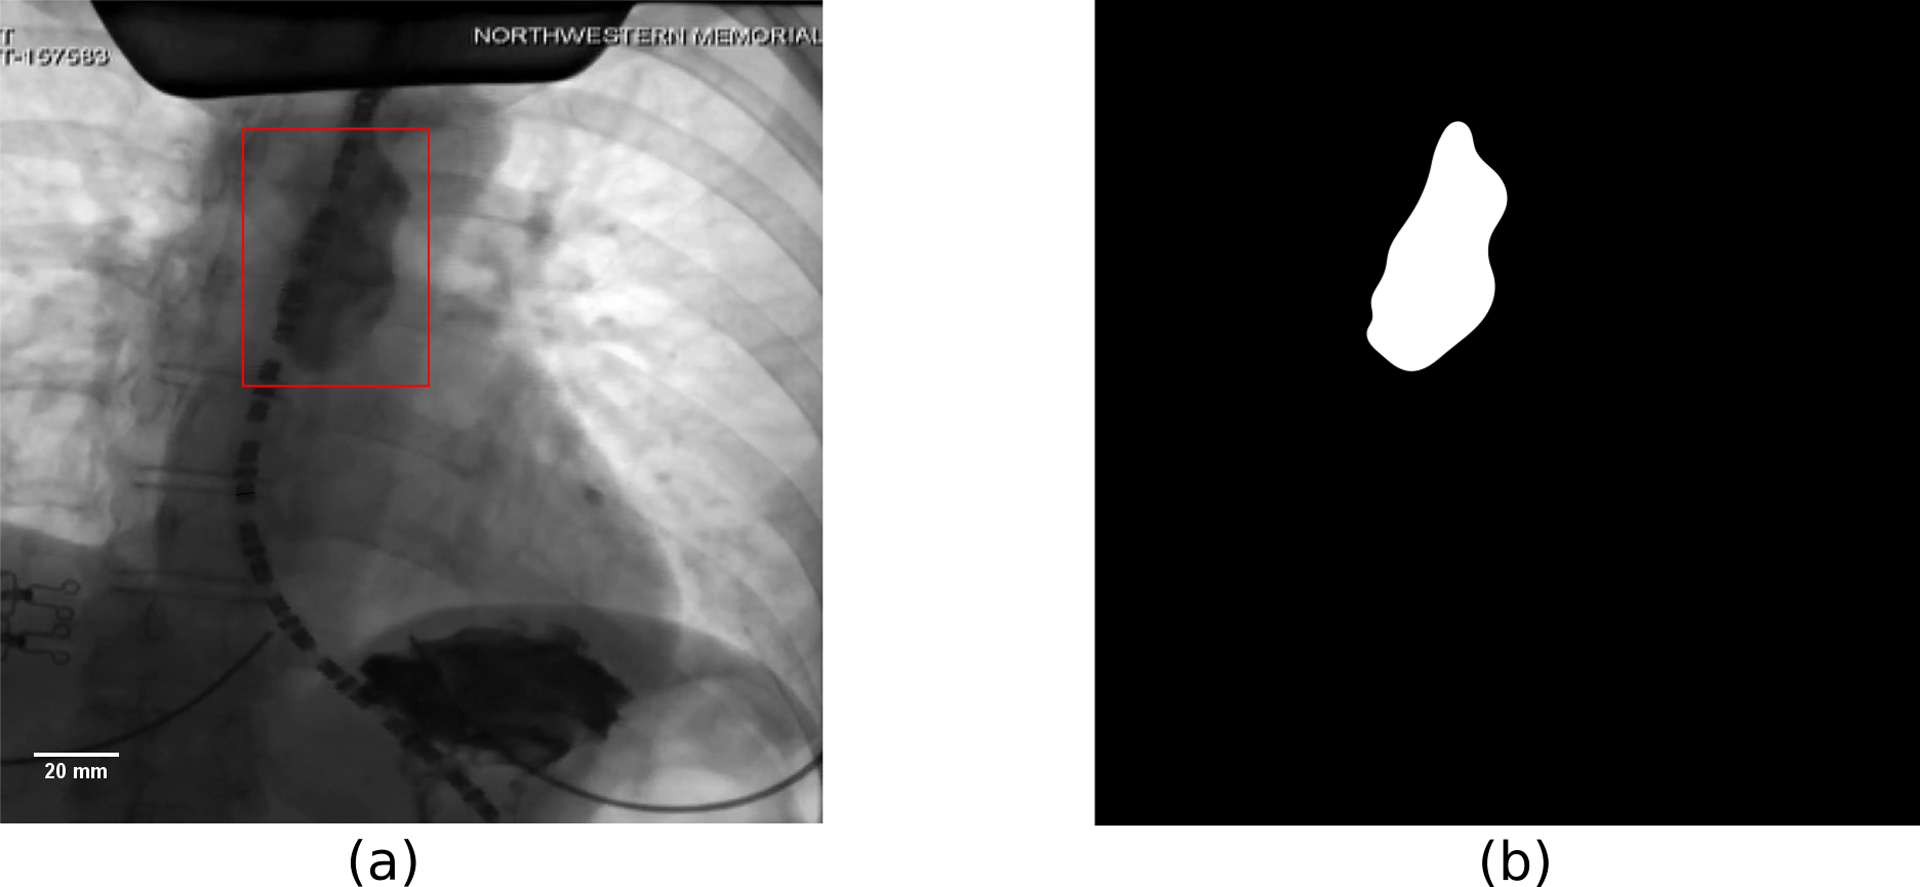
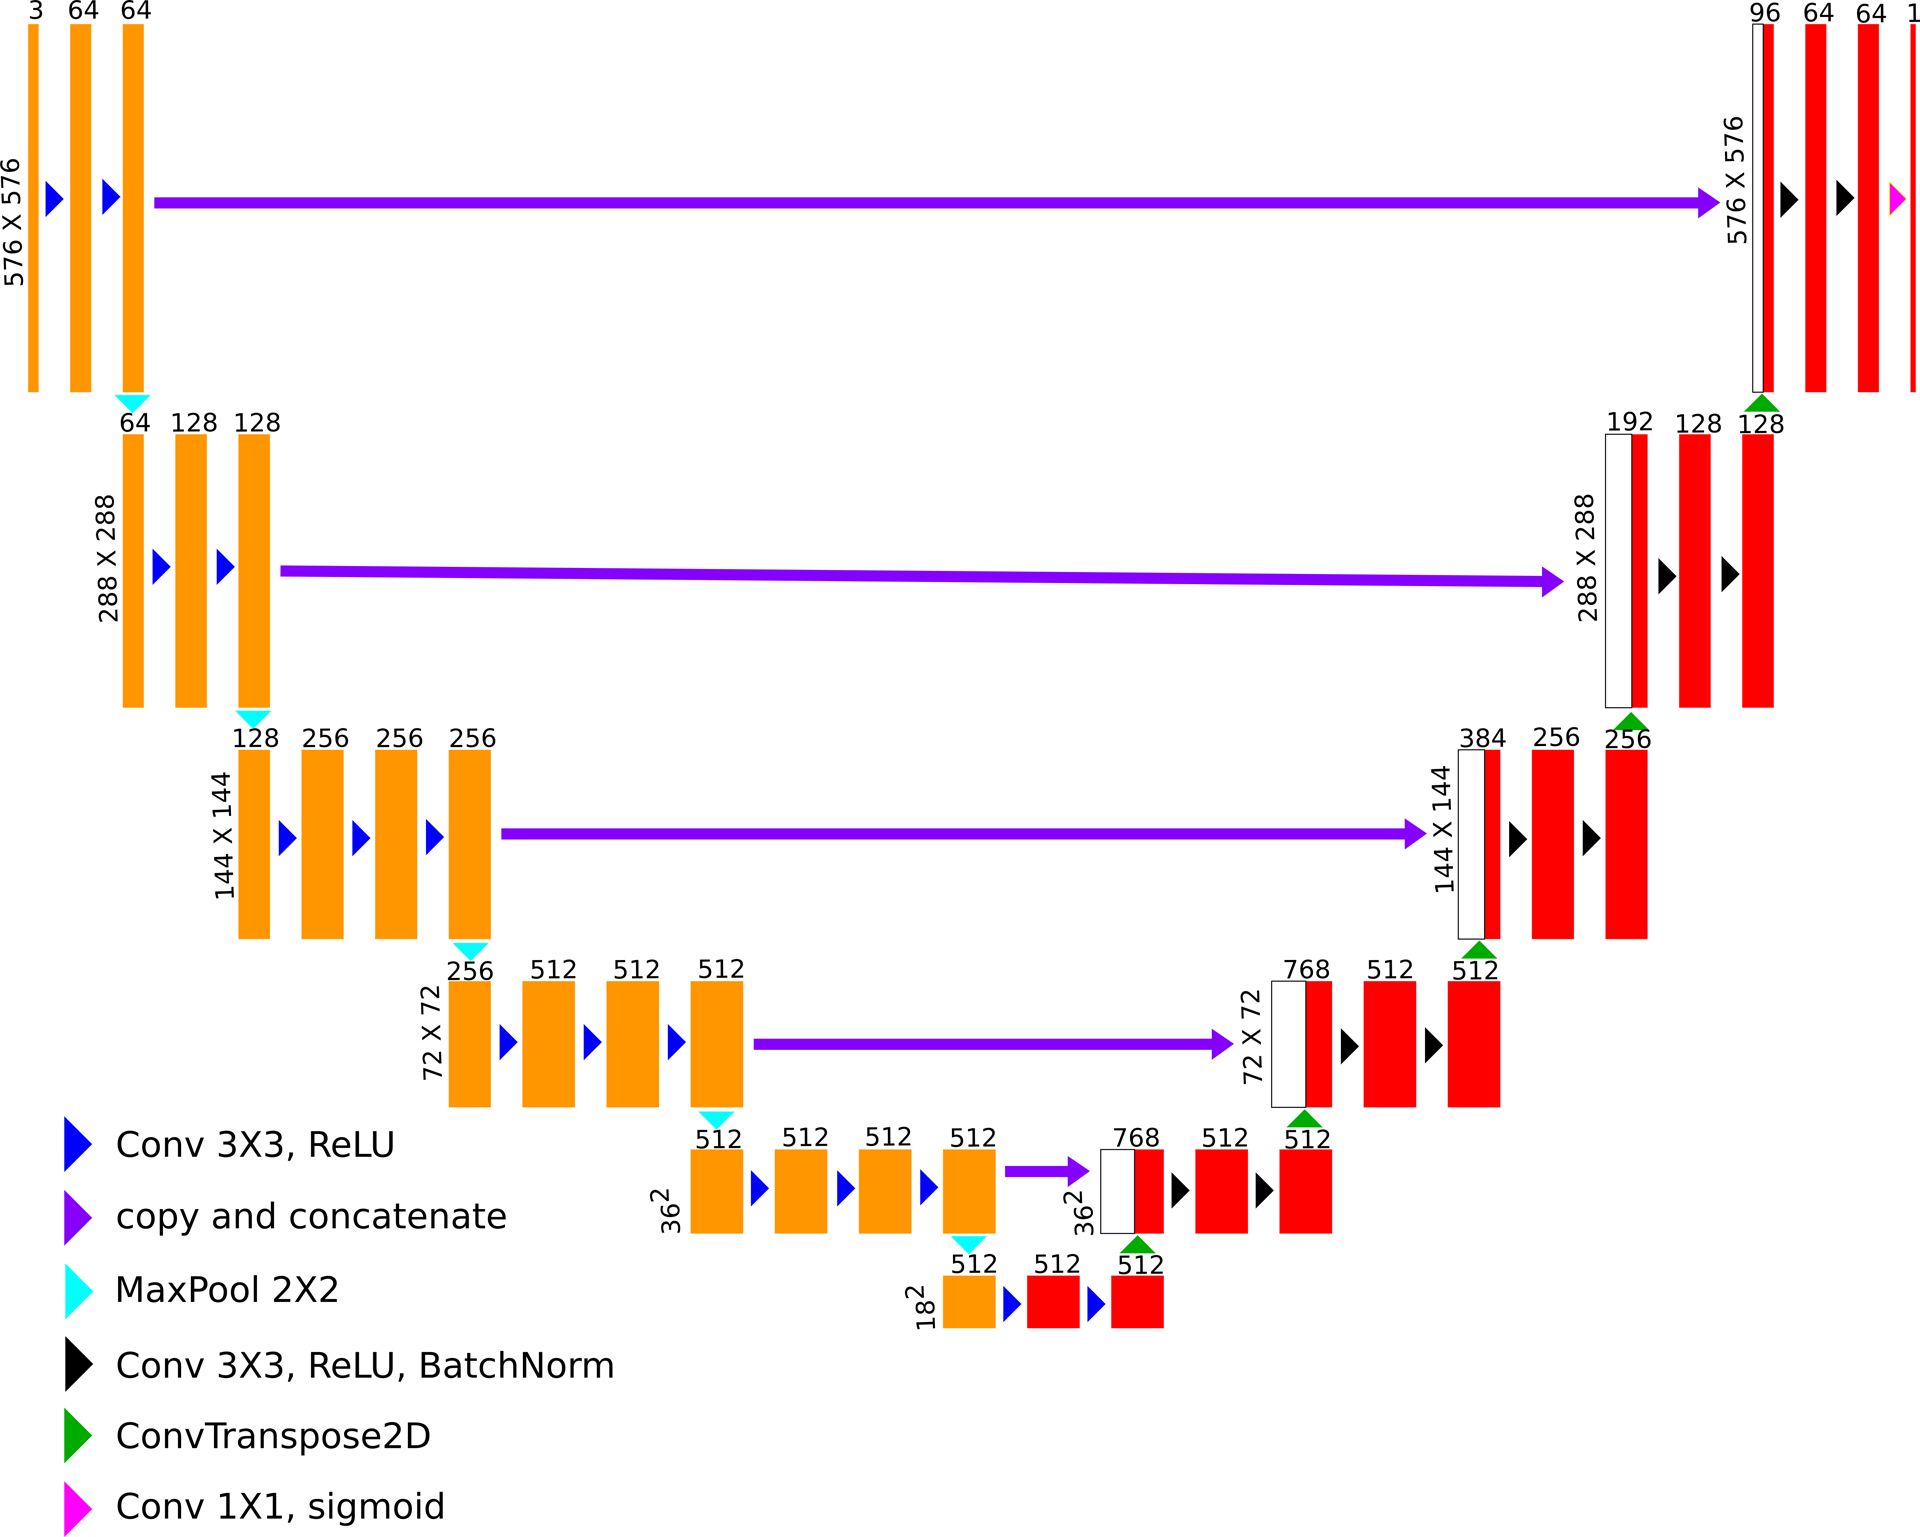
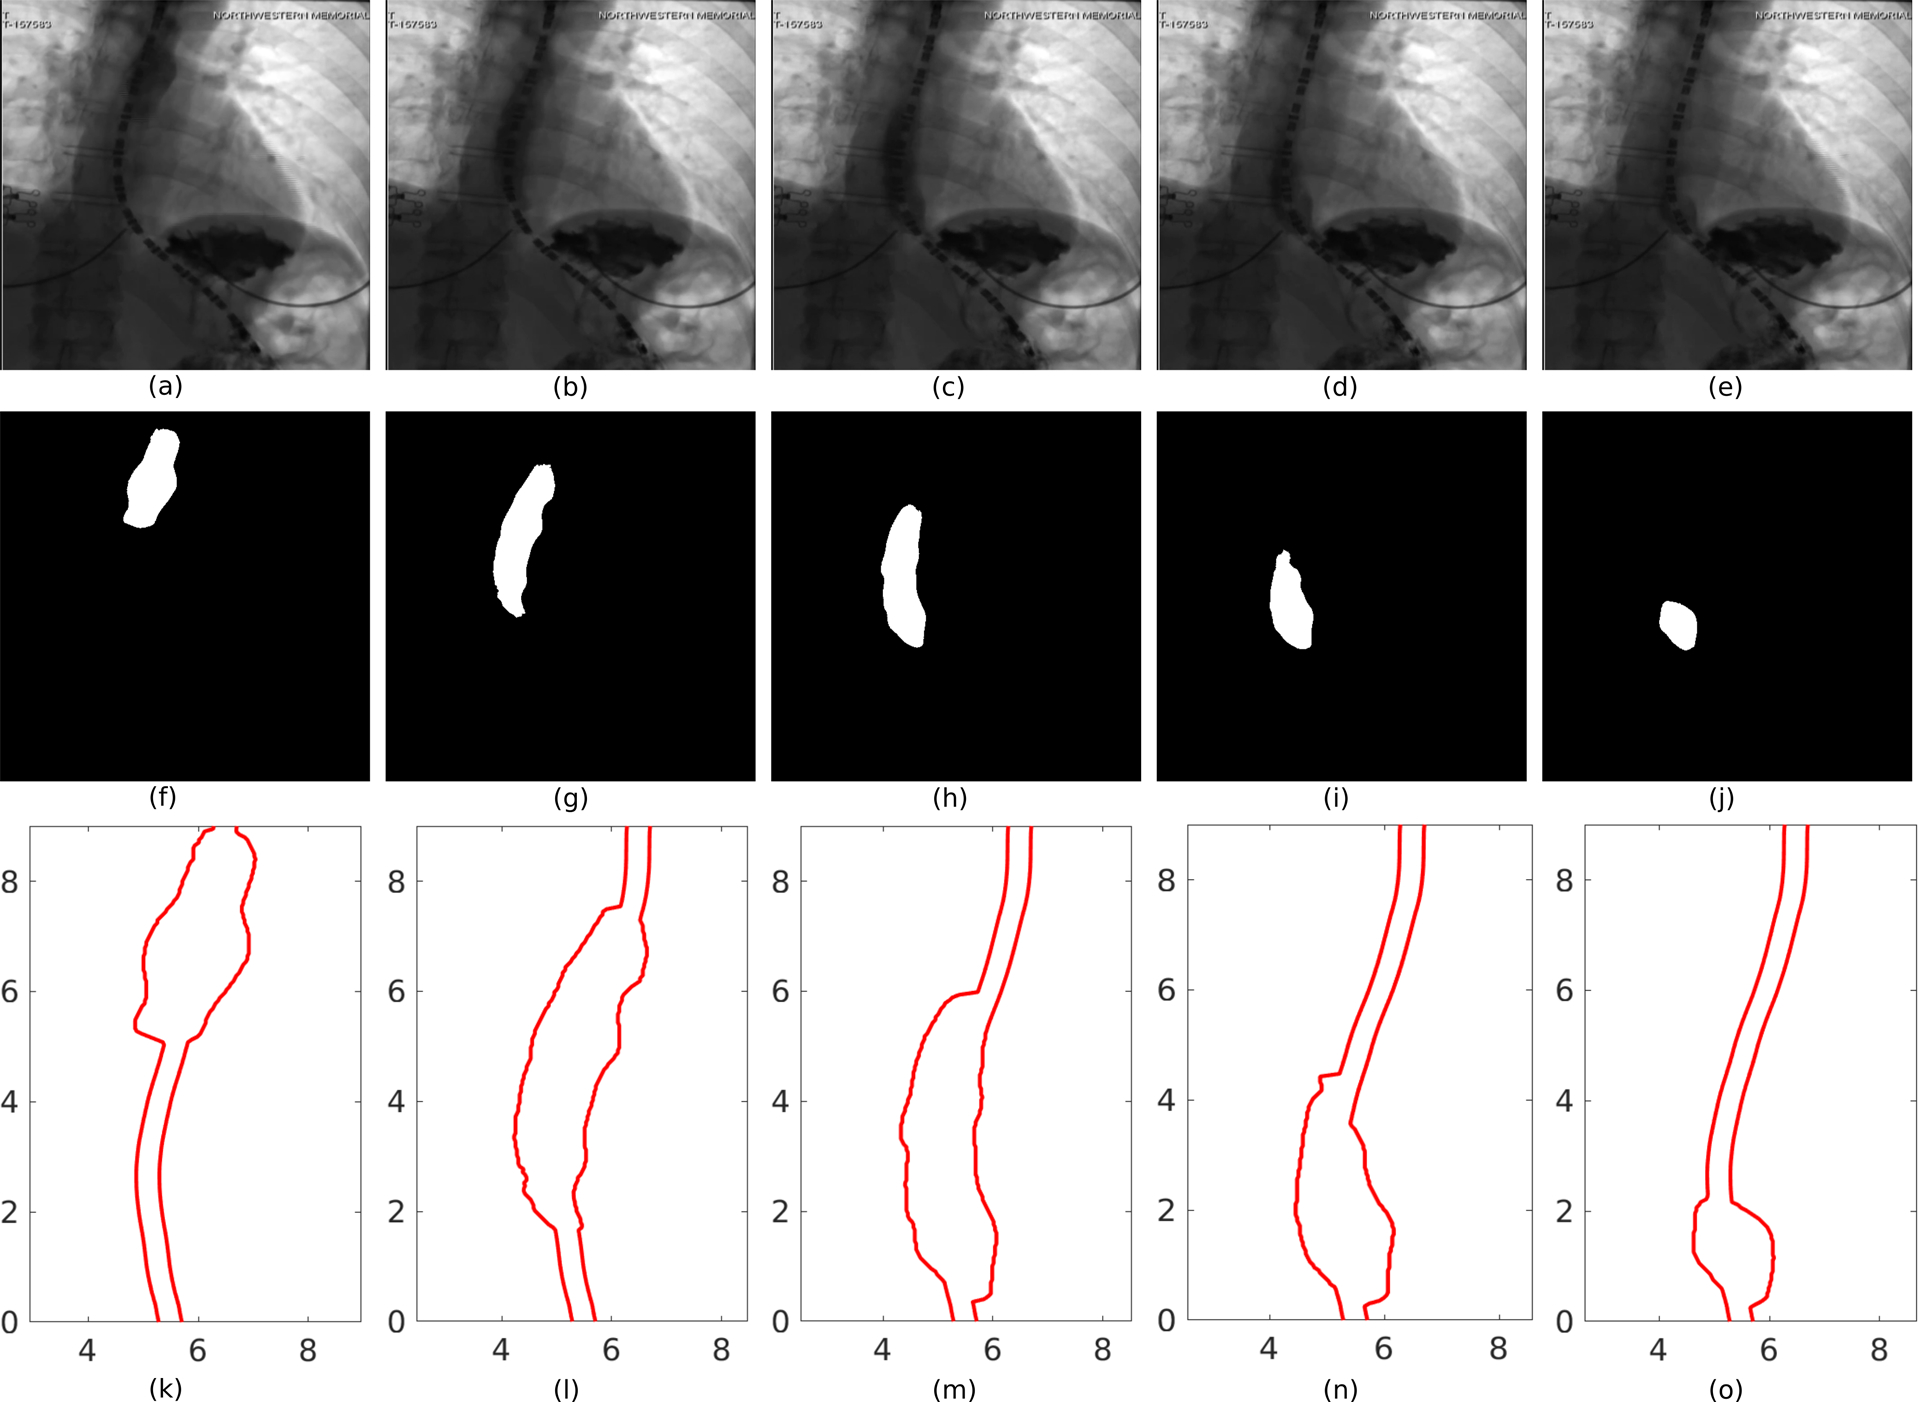
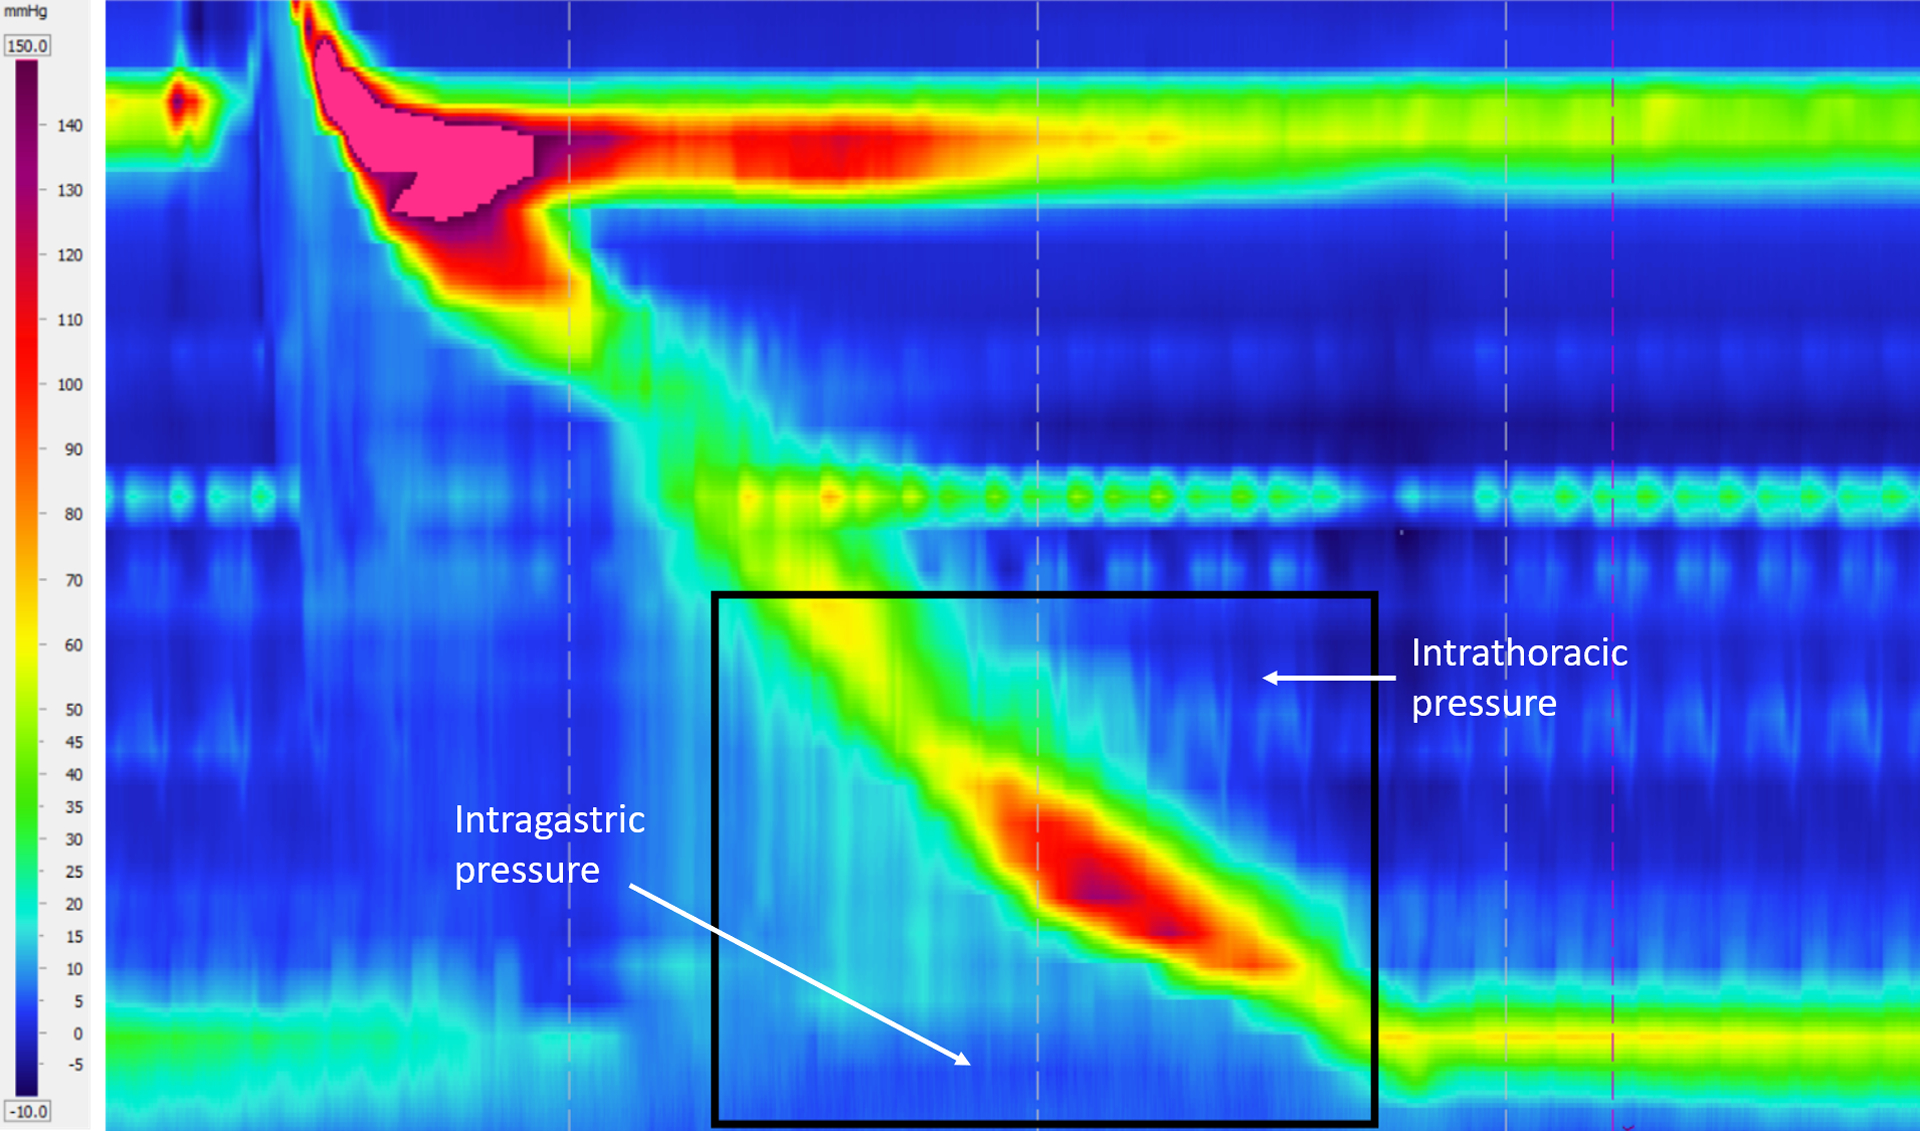
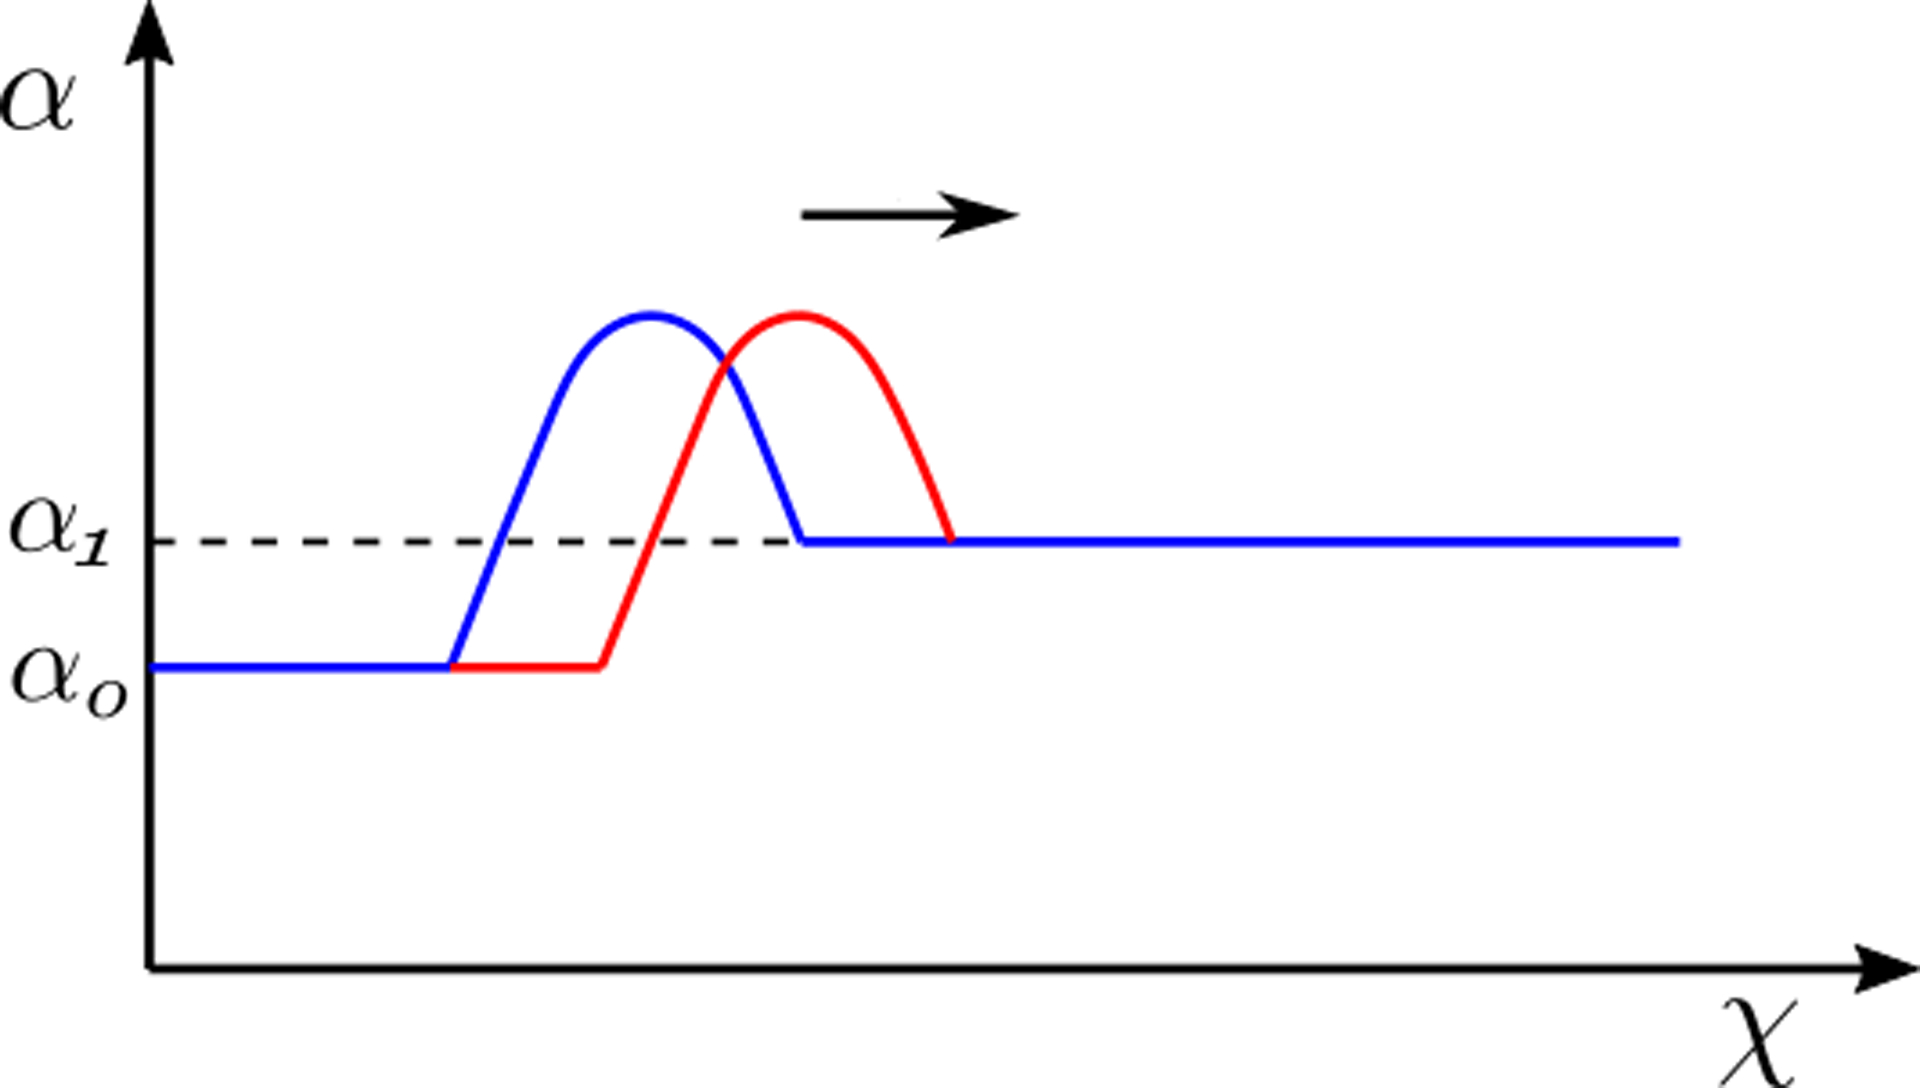
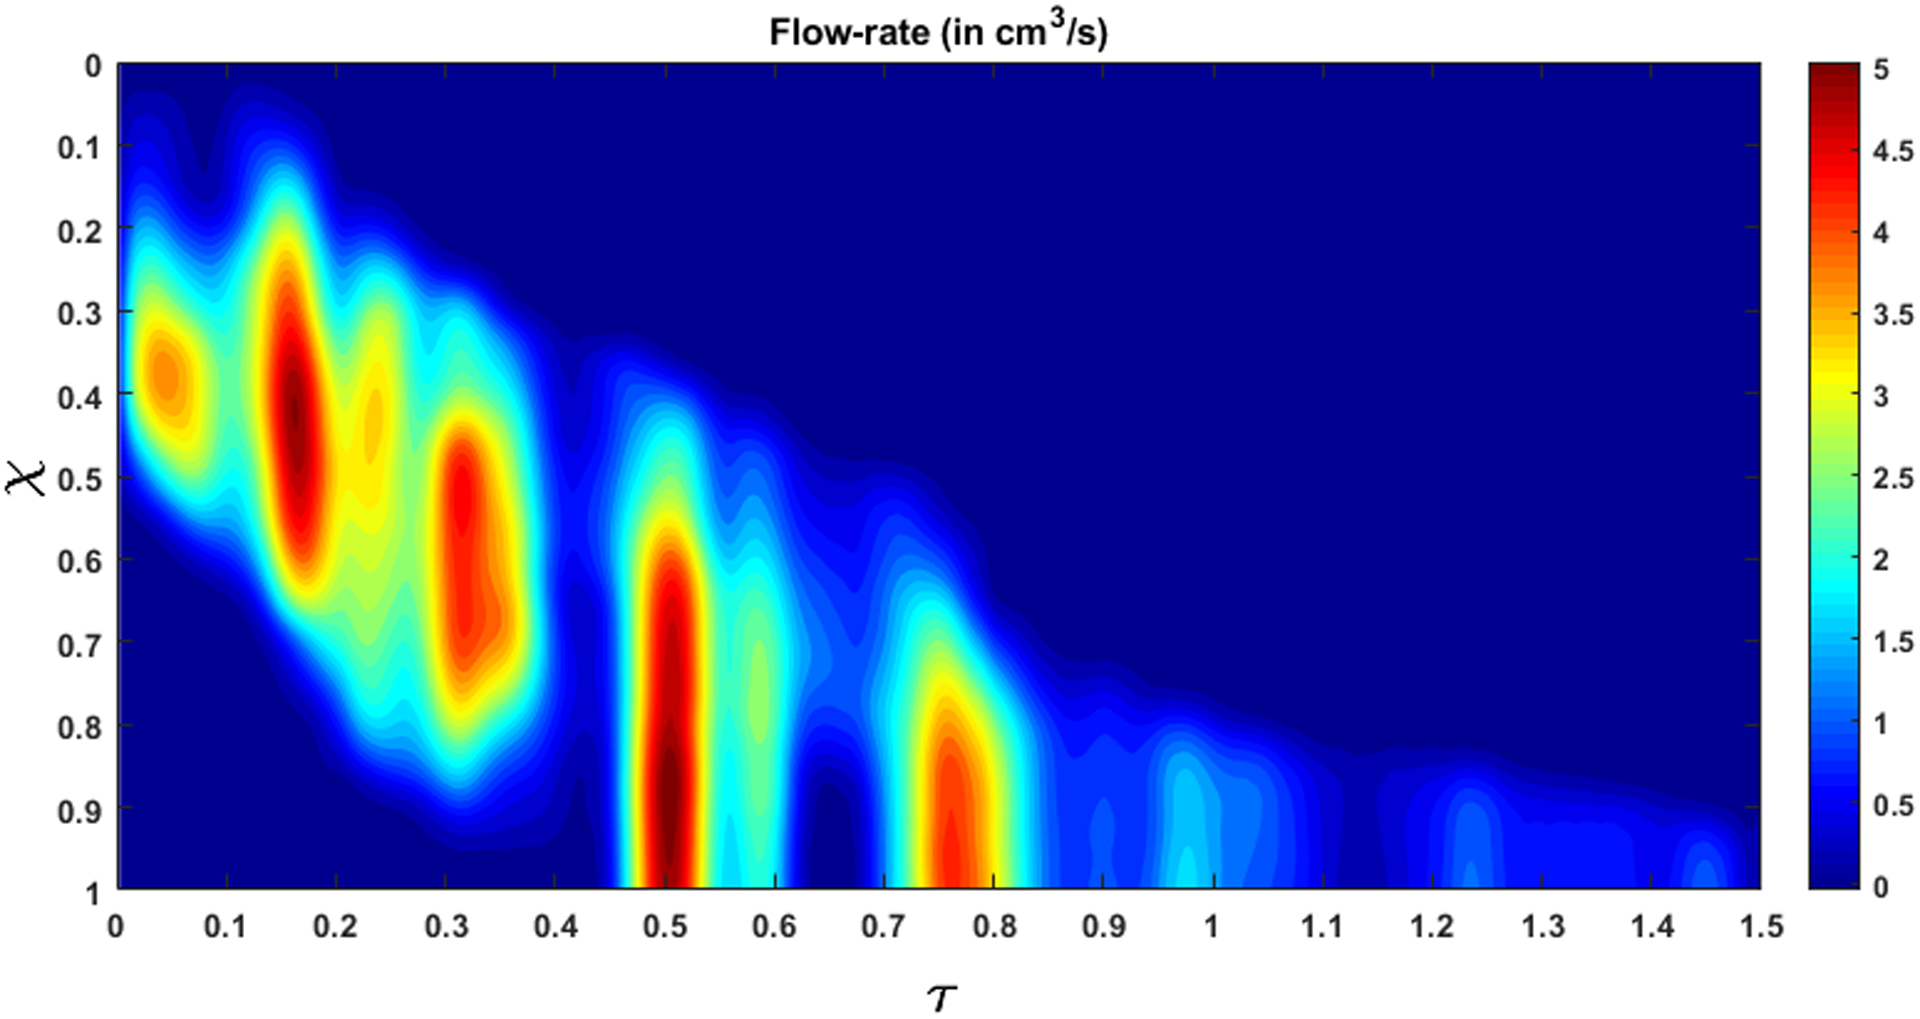
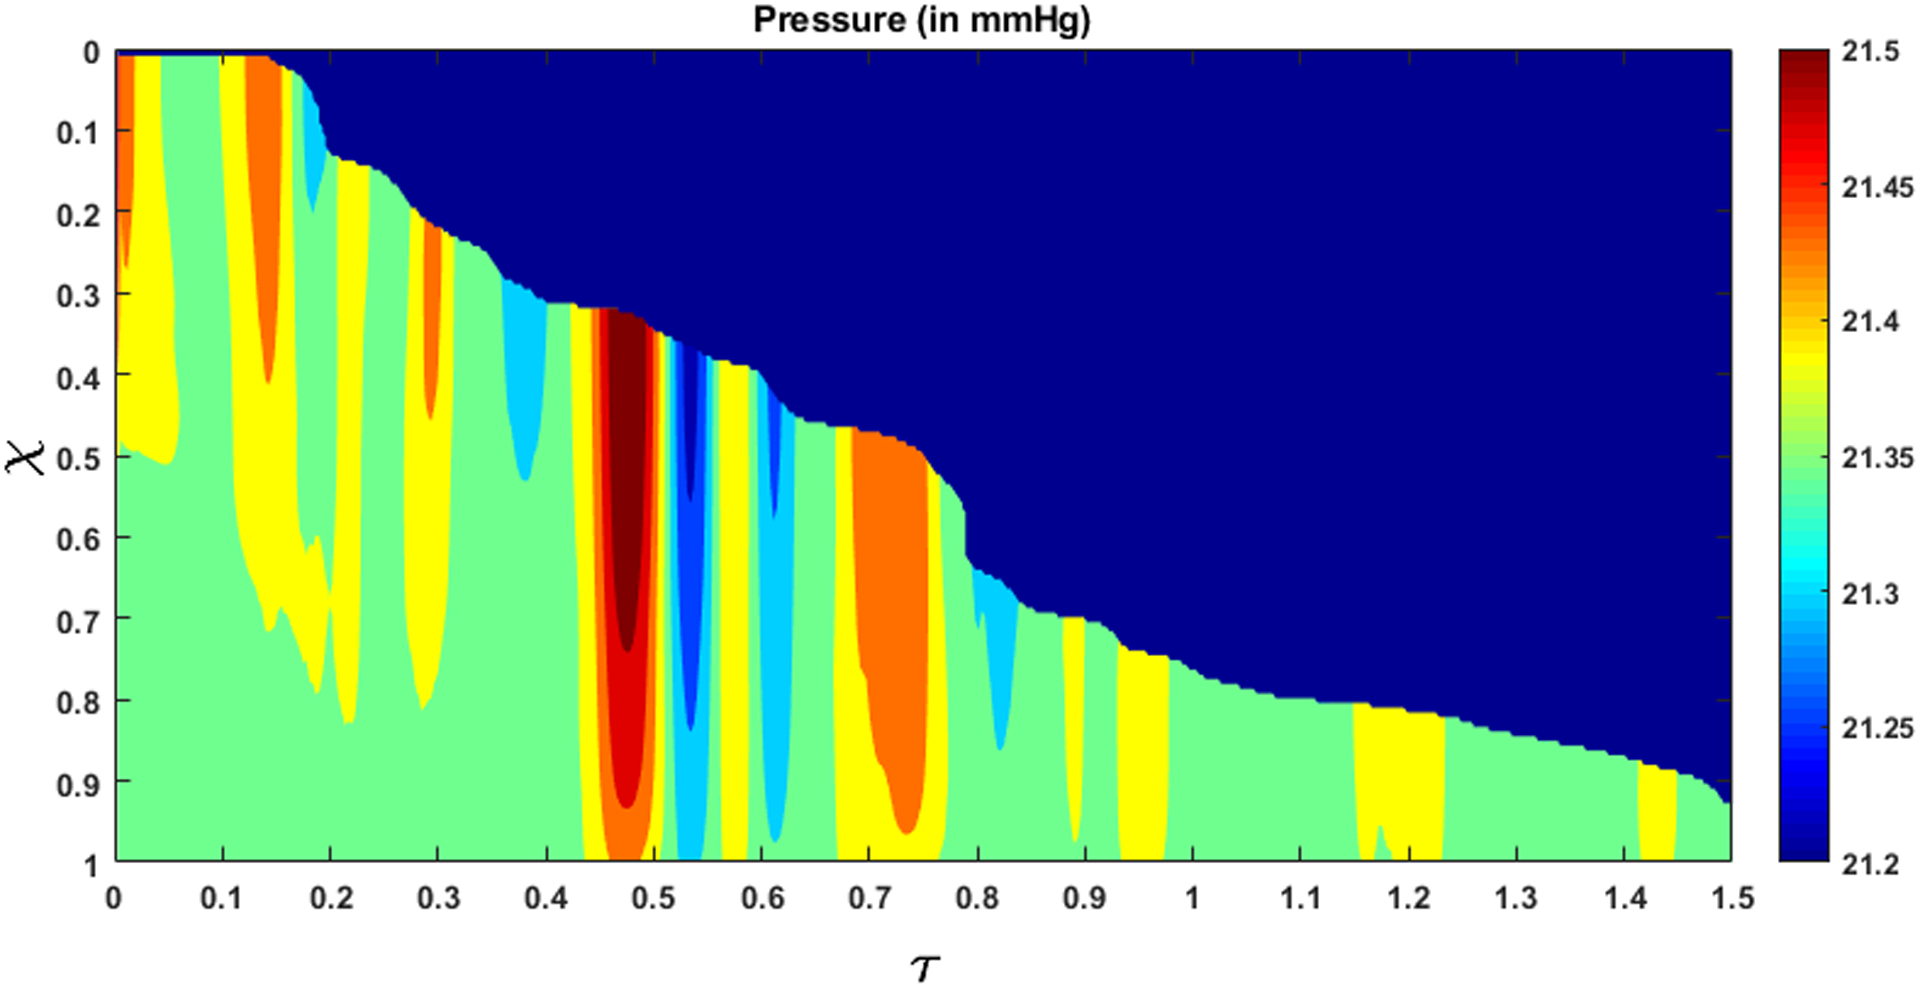
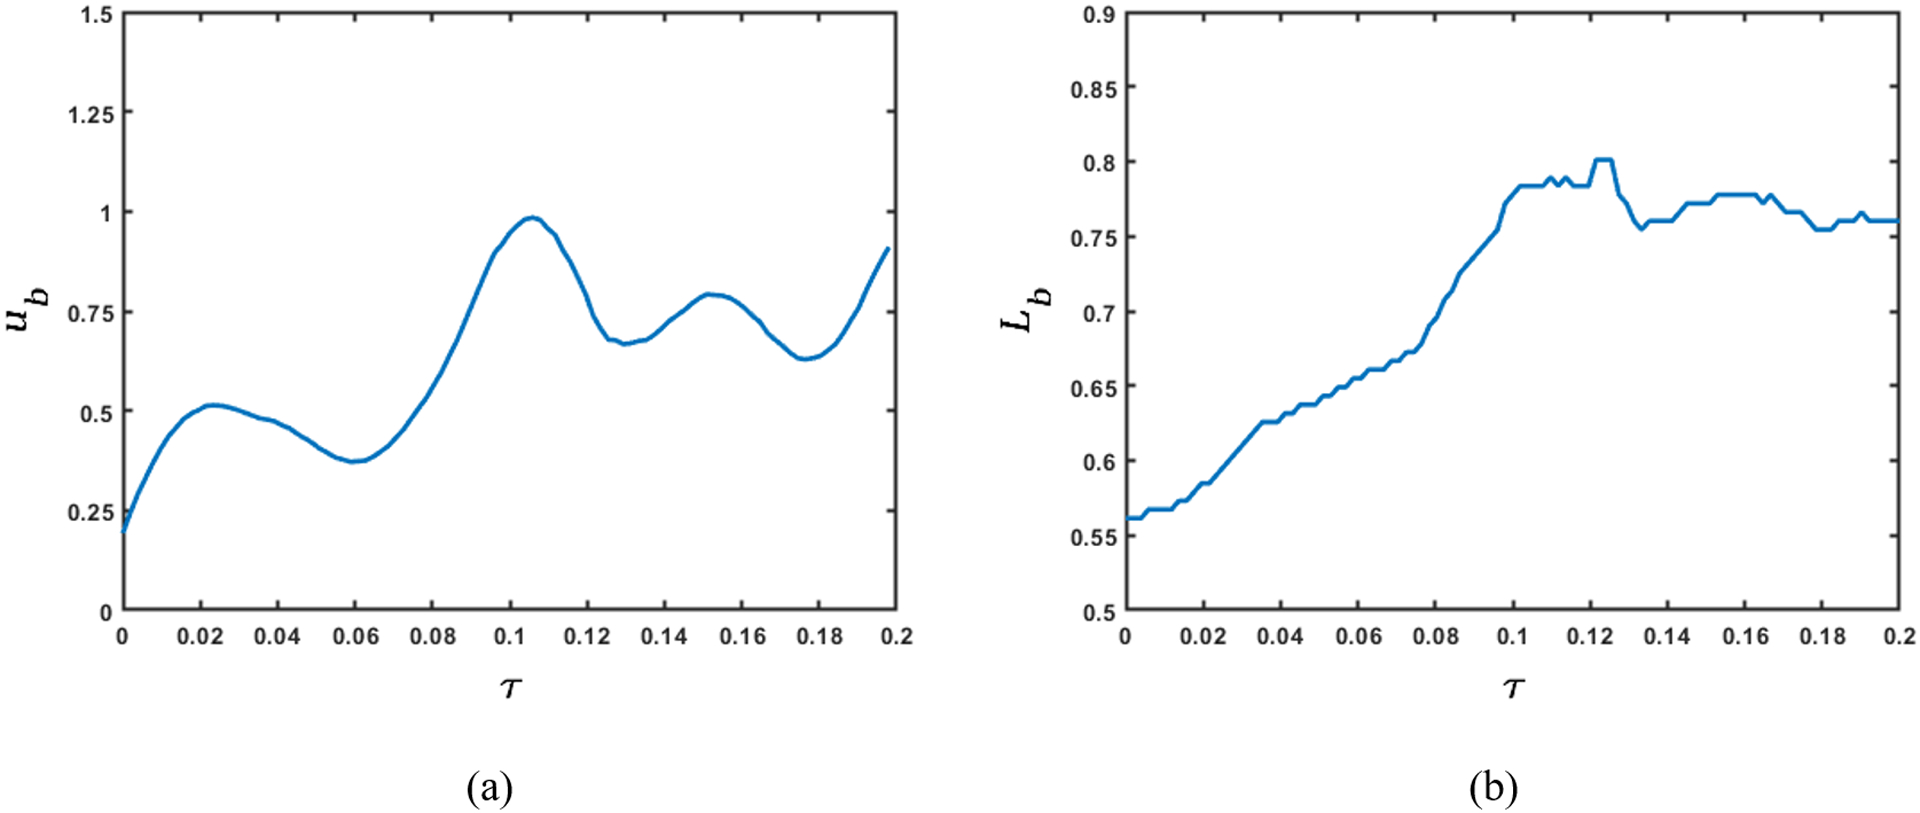
Fluoroscopy is a radiographic procedure for evaluating esophageal disorders such as achalasia, dysphasia and gastroesophageal reflux disease. It performs dynamic imaging of the swallowing process and provides anatomical detail and a qualitative idea of how well swallowed fluid is transported through the esophagus. In this work, we present a method called mechanics informed fluoroscopy (FluoroMech) that derives patient-specific quantitative information about esophageal function. FluoroMech uses a convolutional neural network to perform segmentation of image sequences generated from the fluoroscopy, and the segmented images become input to a one-dimensional model that predicts the flow rate and pressure distribution in fluid transported through the esophagus. We have extended this model to identify and estimate potential physiomarkers such as esophageal wall stiffness and active relaxation ahead of the peristaltic wave in the esophageal musculature. FluoroMech requires minimal computational time and hence can potentially be applied clinically in the diagnosis of esophageal disorders.

Keywords: Convolutional neural network; Esophageal active relaxation; Esophageal wall stiffness; Flexible tube; Image segmentation; One-dimensional flow.


Figures

Figure 1:
Figure 1:
Example of an image from VFSE performed jointly with HRM on a normal subject in supine position. (a) Original esophagram image. The bolus is the dark region inside the red box. The dashed curve is the HRM catheter passing through the esophagus. The pressure sensors in the catheter can be seen as the black dashes which are separated by gaps of 1 cm. The diameter of the catheter is 4.2 mm and is used to define the scale shown in the figure. (b) Label image showing the bolus in white and the remainder as black. The original and label images were used to train the CNN.
Figure 2:
Figure 2:
Neural network architecture (based on TernausNet). The feature maps marked in yellow represents the VGG16 encoder pre-trained with the ImageNet dataset. The feature maps in red represent the decoder which is trained using the fluoroscopy images.
Figure 3:
Figure 3:
Segmentation of image frames of a VFSE. (a)-(e) Bolus transported from the proximal to the distal end of the esophagus and emptying into the stomach, (f)-(j) corresponding image segmentation, (k)-(o) corresponding outline of the esophageal lumen for analysis.
Figure 4:
Figure 4:
Esophageal pressure topography generated from pressure sensors on the HRM catheter. The horizontal axis represents time, and the vertical axis represents the length along the esophagus. The rectangular box shows the location of the EPT corresponding to the fluoroscopy. The horizontal high-pressure band (in red) at the top and bottom show the UES and LES tone, respectively. The peristaltic contraction is shown by the oblique high-pressure band that travels from the UES to the LES to push the bolus through the esophagus.
Figure 5:
Figure 5:
Enforcing volume conservation. (a) Non-dimensional volume (V ^ *) inside the esophagus. The blue line shows the total volume of fluid inside the esophagus calculated assuming a bolus with a circular cross-section with diameter obtained from the bolus width observed in the segmented images. The red dashed line shows the total volume inside the esophagus after volume correction using the fact that the swallowed bolus is 5 mL; (b) Ratio of the initially assumed circular cross-sectional area (A) and the corrected cross-sectional area (A ^ *). The oblique band of high cross-sectional area correction shows that the correction is performed only inside the bolus, and not in the relaxed parts of the esophagus where AA*=1.
Figure 6:
Figure 6:
Staggered meshing of the domain. The cell boundaries and centers are shown in red and green, respectively.
Figure 7:
Figure 7:
Volume inside the esophagus from 0 up to χ. The blue line shows the volume distribution at time instant τ1, and the red dotted line shows the same as the bolus has progressed in time at τ2. Before the beginning of the bolus bi(τ), there is no fluid inside the esophagus, and the volume is 0. The volume inside the esophagus rises from bi(τ) to the total volume swallowed (Vo = 5 mL) at the end of the bolus bf(τ).
Figure 8:
Figure 8:
Effect of active relaxation on the shape of the bolus. (a) Bolus shape with active relaxation in a finite segment distal to the contraction. A prominent bulge is formed in the presence of localized active relaxation; (b) Bolus shape without localized active relaxation. Typically, there is no prominent bulge in the absence of localized active relaxation.
Figure 9:
Figure 9:
The variation of cross-sectional area shows the bolus moving in the positive χ direction. The transition from blue to the red line shows the movement of the bolus with time (also indicated by the arrow). The bulge at the bolus is due to localized active relaxation. The cross-sectional area distal to the localized bulge is α1, and this part of the esophagus does not experience active relaxation.
Figure 10:
Figure 10:
Flow rate within the esophagus. The high flow rate at τ = 0.5 marks the start of emptying.
Figure 11:
Figure 11:
Fluid pressure within the esophagus. The high-pressure gradient near τ = 0.5 shows the LES requires a high pressure gradient to allow fluid to pass through it. The dynamic pressure variations are significantly small compared to the static pressure inside the esophagus.
Figure 12:
Figure 12:
Variation of bolus speed and length before emptying. (a) Bulk speed of the bolus; (b) Length of the bolus. The rate of change of the product of bulk bolus speed and length of the bolus with respect to time quantifies the dynamic pressure variations shown in the previous figure. The variation of bulk bolus speed and its length provide physical intuition of the sources of pressure fluctuations.
Figure 13:
Figure 13:
Variation of non-dimensional cross-sectional area with χ and τ during bolus transport without emptying. At τ = 1, α is higher but the bolus has a shorter length. Towards the end of the transport, the bolus elongates but α decreases due to conserved volume during pure transport. The white horizontal dashed lines (at χ = 0.15 and 0.7) mark the length of the esophagus that displays a prominent bolus that can be used to estimate stiffness and active relaxation of the esophageal walls.
Figure 14:
Figure 14:
Variation of minimum stiffness (in mmHg) along the length of the esophagus. The x-axis represents the length of the esophagus marked by the dashed horizontal lines in Fig. 13. This measure of stiffness incorporates the effect of active relaxation; therefore, its low values correspond to the high values of cross-sectional areas. The predicted high stiffness at χ = 0.15 and 0.7 is due to the influence of the peristaltic contraction and the LES, respectively.
Figure 15:
Figure 15:
Variation of the maximum active relaxation factor. The x-axis represents the length of the esophagus marked by the dashed horizontal lines in Fig. 13. The high values of θmax correspond to the low values of stiffness. The low values of θmax at the χ = 0.15 and 0.7 are due to the influence of the peristaltic contraction and the LES, respectively.

References

    1. Abadi Martín, Agarwal Ashish, Barham Paul, Brevdo Eugene, Chen Zhifeng, Citro Craig, Corrado Greg S., Davis Andy, Dean Jeffrey, Devin Matthieu, Ghemawat Sanjay, Goodfellow Ian, Harp Andrew, Irving Geoffrey, Isard Michael, Jia Yangqing, Jozefowicz Rafal, Kaiser Lukasz, Kudlur Manjunath, Levenberg Josh, Dan Mané Rajat Monga, Moore Sherry, Murray Derek, Olah Chris, Schuster Mike, Shlens Jonathon, Steiner Benoit, Sutskever Ilya, Talwar Kunal, Tucker Paul, Vanhoucke Vincent, Vasudevan Vijay, Fernanda Viégas Oriol Vinyals, Warden Pete, Wattenberg Martin, Wicke Martin, Yu Yuan, and Zheng Xiaoqiang. TensorFlow: Large-scale machine learning on heterogeneous systems, 2015. Software available from tensorflow.org.
    1. Barnard ACL, Hunt WA, Timlake WP, and Varley E. A theory of fluid flow in compliant tubes. Biophysical Journal, 6(6):717–724, 1966. - PMC - PubMed
    1. Brasseur James G.. A fluid mechanical perspective on esophageal bolus transport. Dysphagia, 2(1):32, March 1987. - PubMed
    1. Chollet François et al. Keras. https://keras.io, 2015.
    1. Ciresan Dan, Giusti Alessandro, Gambardella Luca M., and Schmidhuber Jürgen. Deep neural networks segment neuronal membranes in electron microscopy images. In Pereira F, Burges CJC, Bottou L, and Weinberger KQ, editors, Advances in Neural Information Processing Systems 25, pages 2843–2851. Curran Associates, Inc., 2012.

LinkOut - more resources