. 2021 Apr 5;218(4):e20200920.
doi: 10.1084/jem.20200920.

Single-cell analyses identify circulating anti-tumor CD8 T cells and markers for their enrichment

Affiliations

Single-cell analyses identify circulating anti-tumor CD8 T cells and markers for their enrichment

Kristen E Pauken et al. J Exp Med. .

Abstract

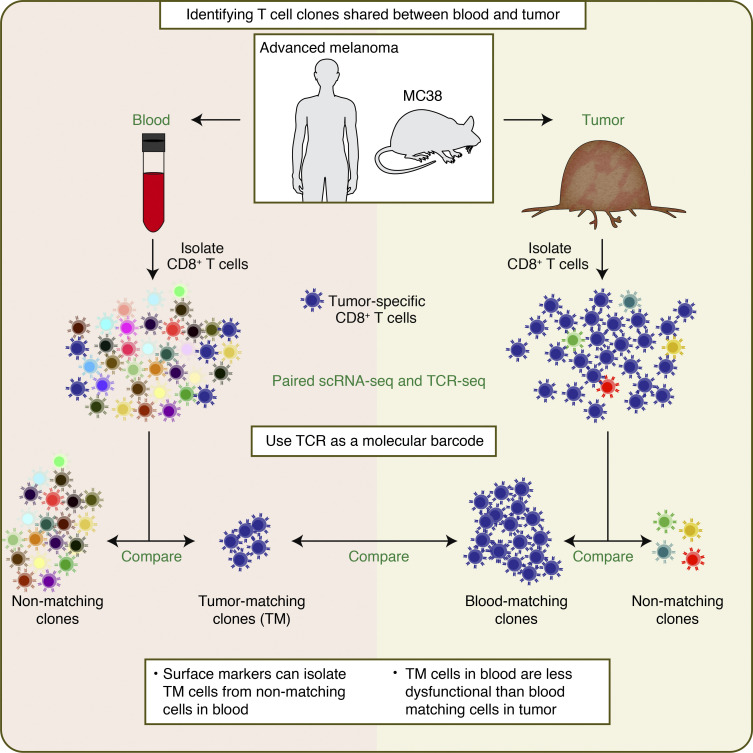
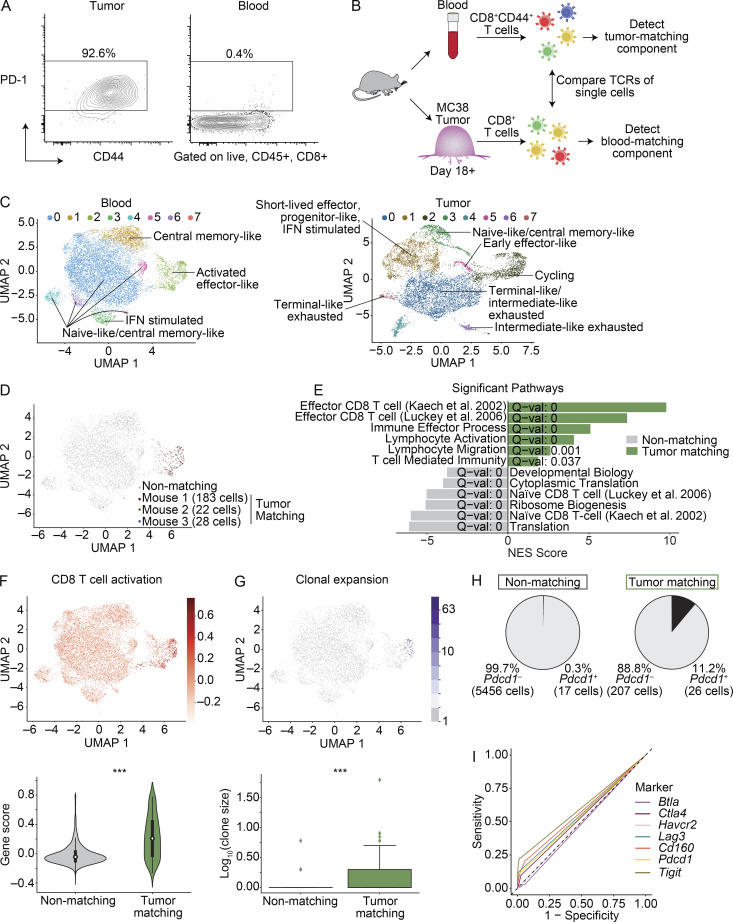
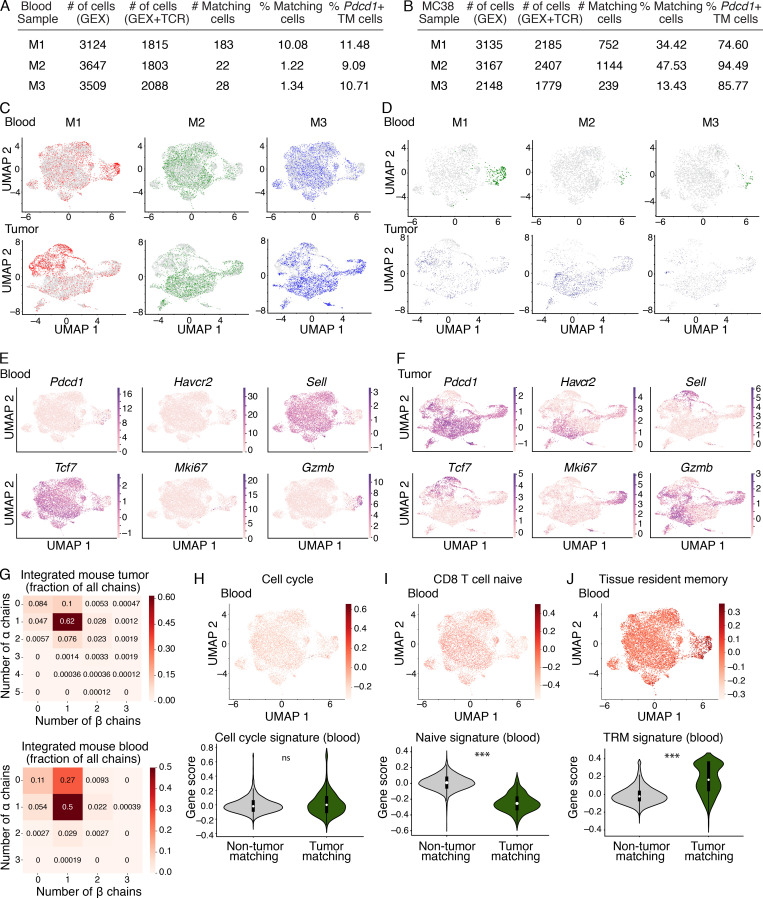
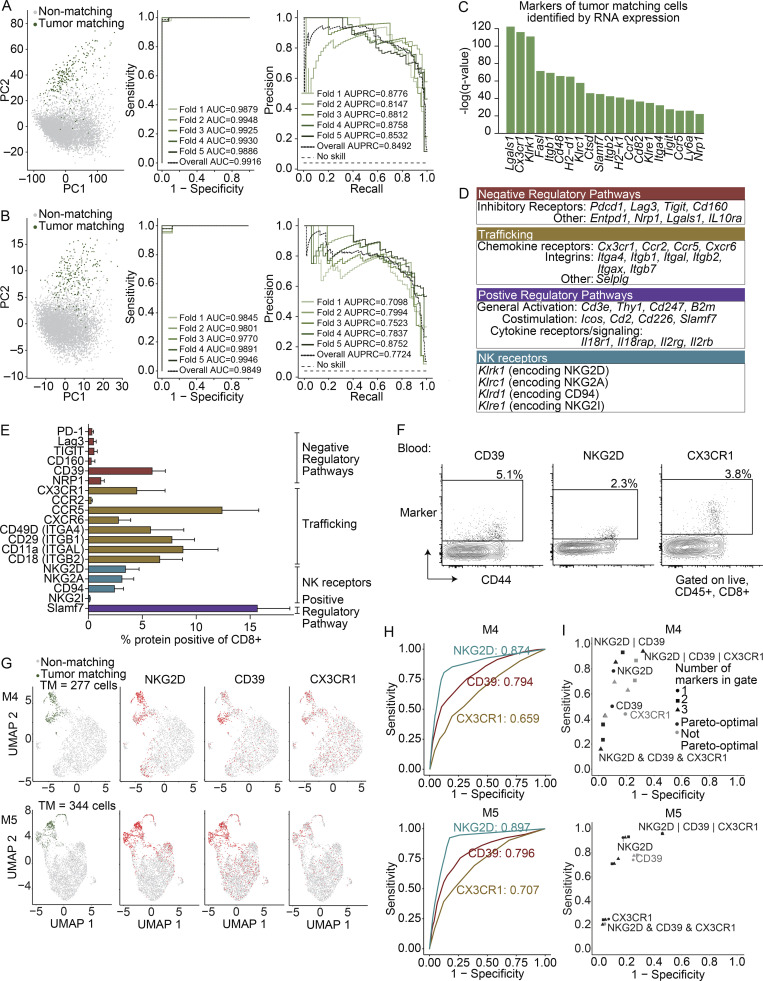
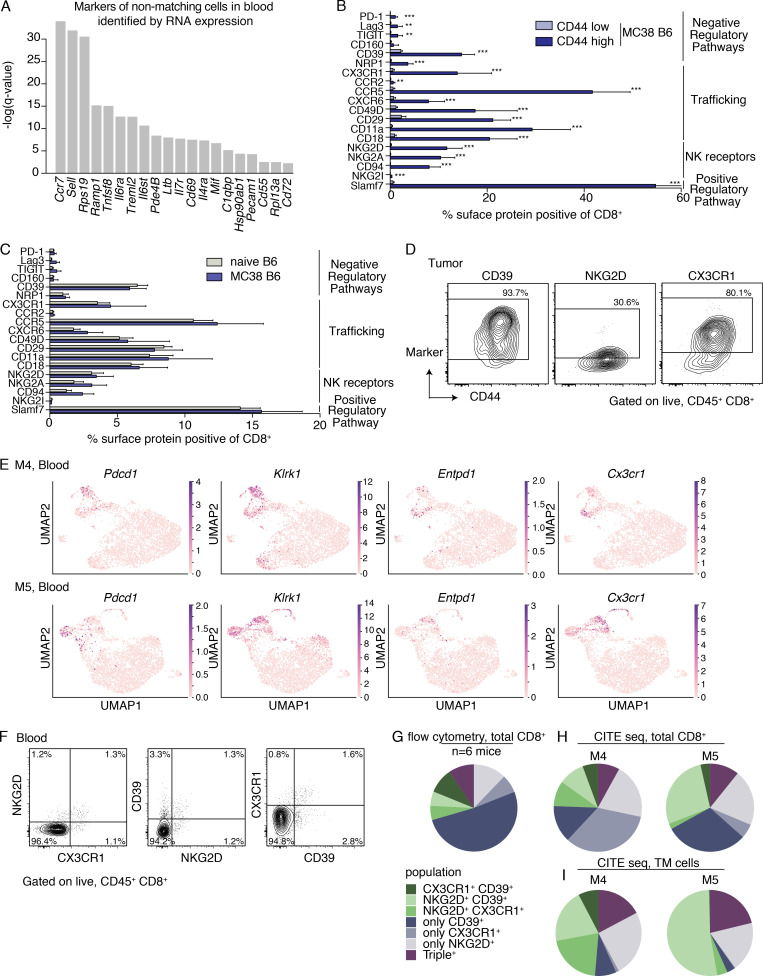
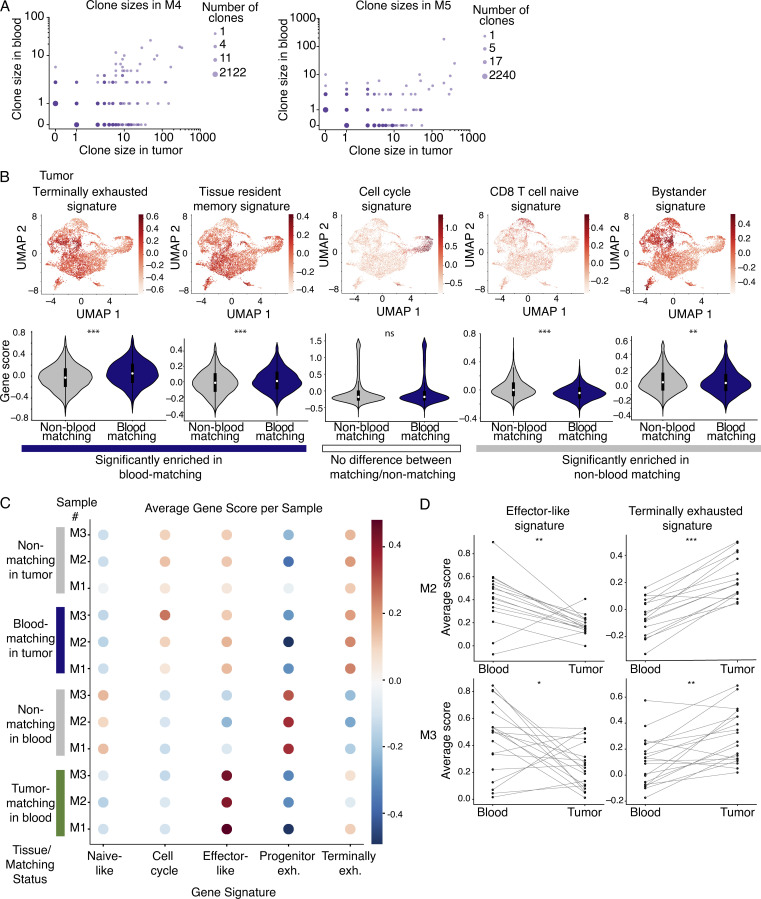
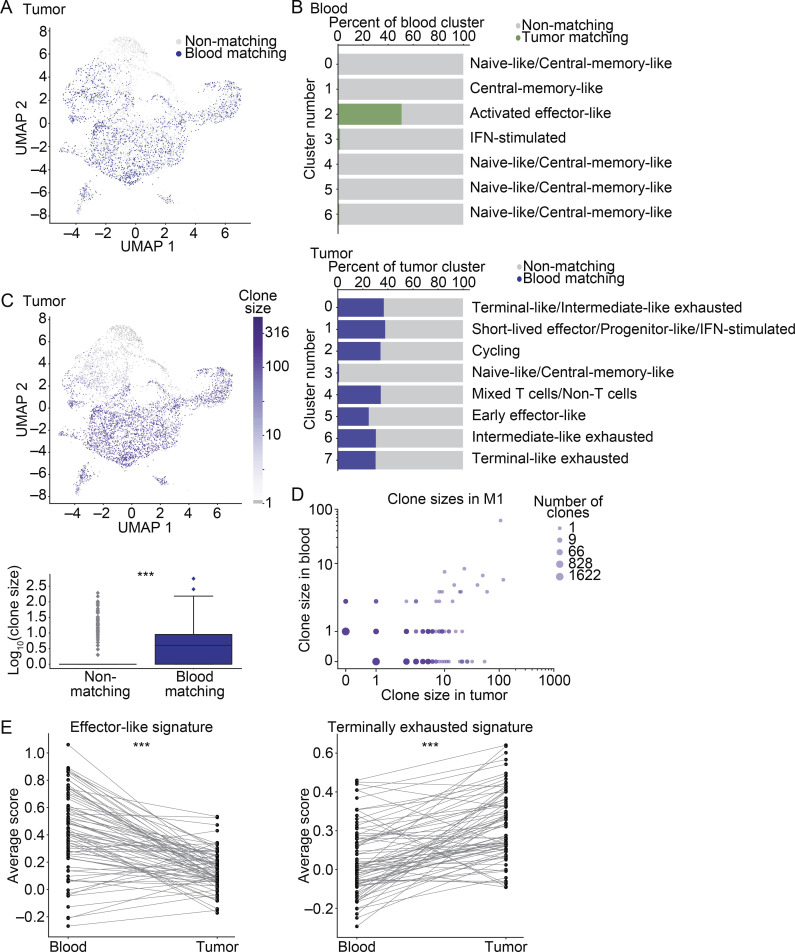
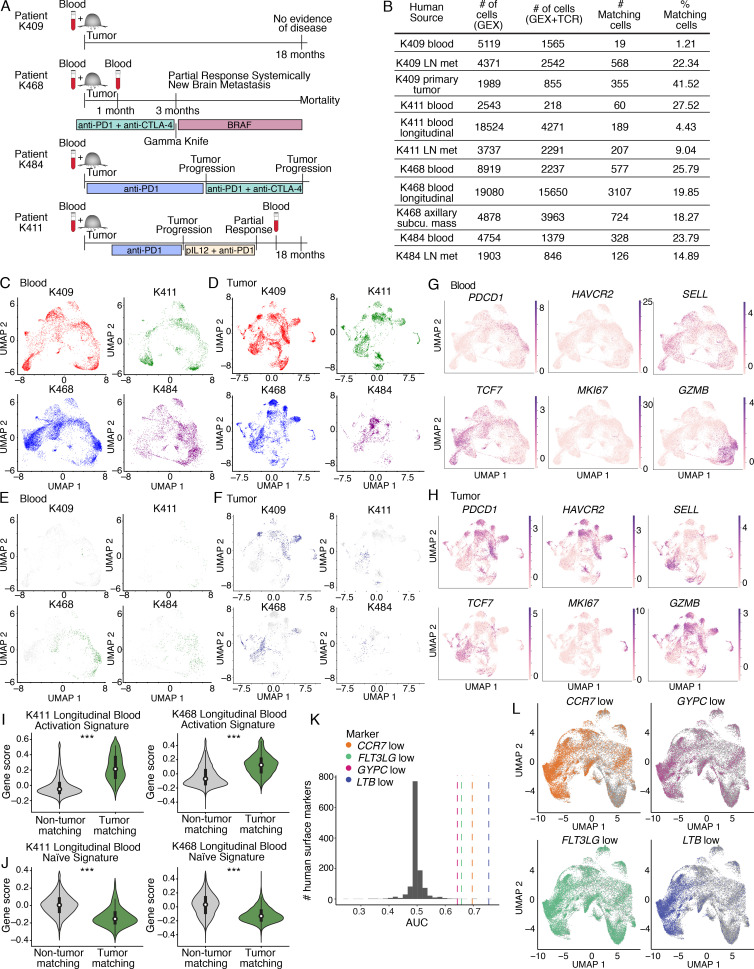
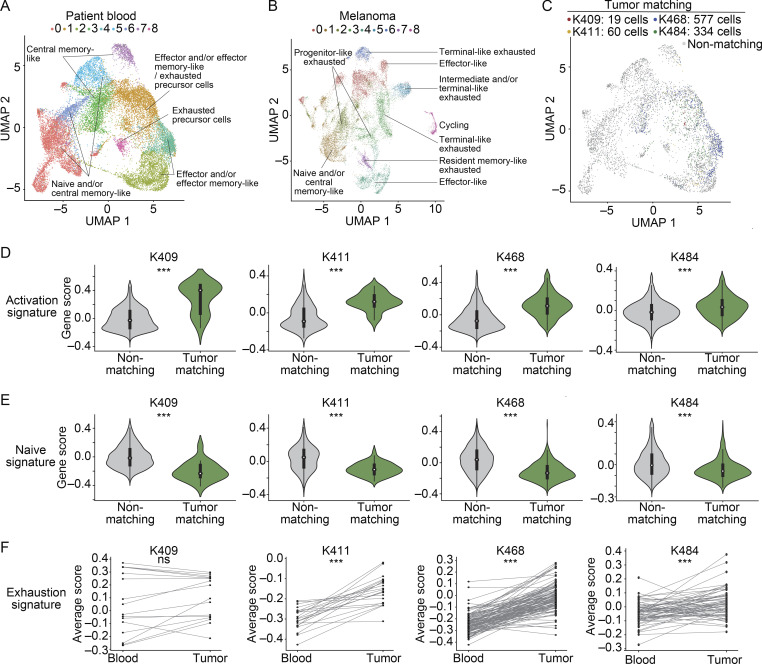
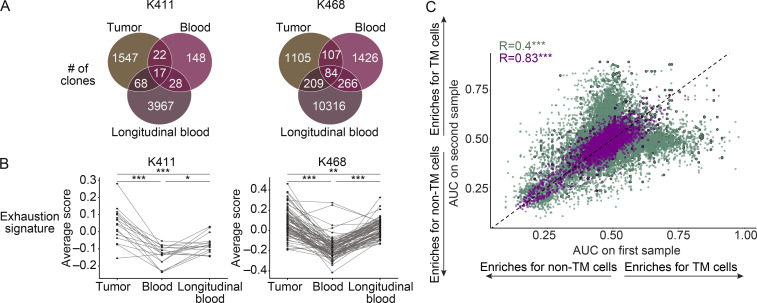
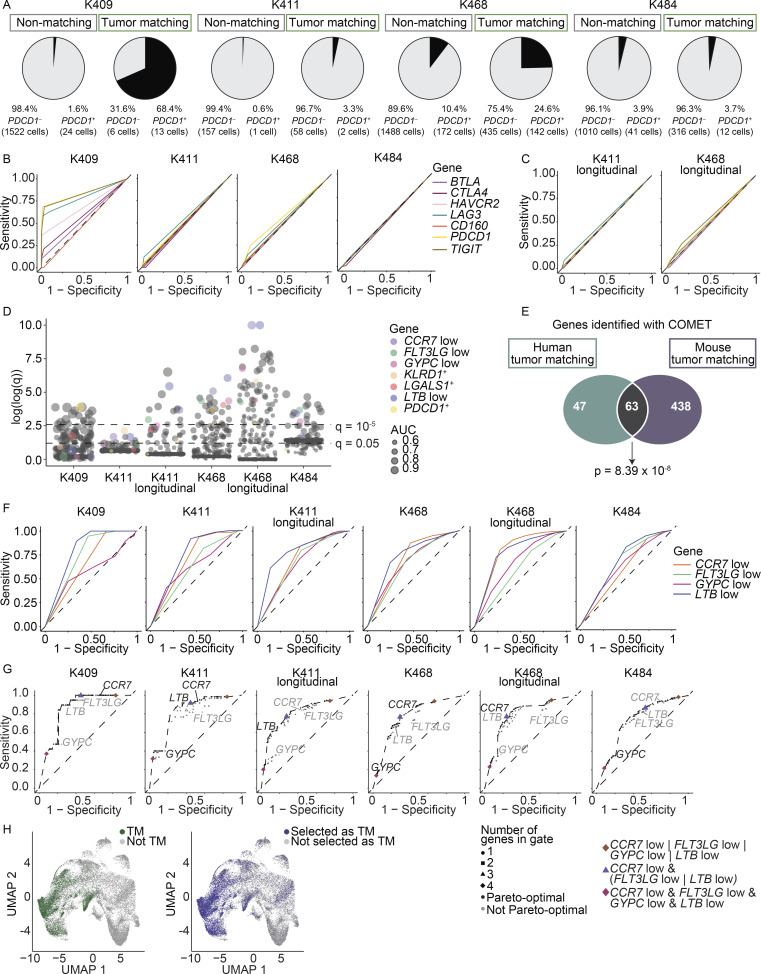
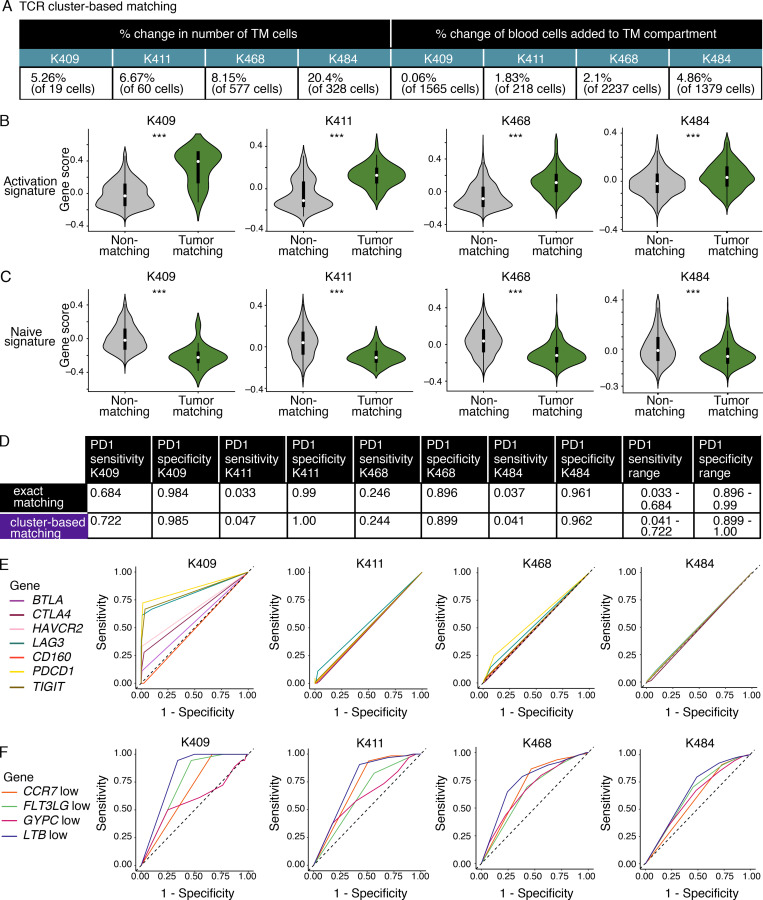
The ability to monitor anti-tumor CD8+ T cell responses in the blood has tremendous therapeutic potential. Here, we used paired single-cell RNA and TCR sequencing to detect and characterize "tumor-matching" (TM) CD8+ T cells in the blood of mice with MC38 tumors or melanoma patients using the TCR as a molecular barcode. TM cells showed increased activation compared with nonmatching T cells in blood and were less exhausted than matching cells in tumors. Importantly, PD-1, which has been used to identify putative circulating anti-tumor CD8+ T cells, showed poor sensitivity for identifying TM cells. By leveraging the transcriptome, we identified candidate cell surface markers for TM cells in mice and patients and validated NKG2D, CD39, and CX3CR1 in mice. These data show that the TCR can be used to identify tumor-relevant cells for characterization, reveal unique transcriptional properties of TM cells, and develop marker panels for tracking and analysis of these cells.


Conflict of interest statement

Disclosures: K. Tsai reported personal fees from Regeneron, grants from Array/Pfizer, grants from Replimune, and grants from Oncosec outside the submitted work. M. Rosenblum reported other from TRex Bio and other from Sitryx Bio outside the submitted work. A. Daud reported grants from Merck, grants from BMS, other from Trex, grants from Pfizer, grants from Incyte, grants from Xencor, grants from Roche, and grants from Novartis during the conduct of the study as well as grants from Oncosec outside the submitted work. A. Sharpe reported grants from NIH R01 CA229851, grants from NIH U54 CA224088, grants from NIH P01 56299, and grants from NIH P01 39671 during the conduct of the study; personal fees from Surface Oncology, personal fees from Sqz Biotech, personal fees from Selecta, personal fees from Monopteros, personal fees from Elstar, personal fees from Elpiscience, grants from Novartis, grants from Roche, grants from Merck, grants from Ipsen, grants from UCB, and grants from Quark Ventures outside the submitted work. In addition, A. Sharpe had a patent number 7,432,059 with royalties paid (Roche, Merck, Bristol-Myers-Squibb, EMD-Serono, Boehringer-Ingelheim, AstraZeneca, Leica, Mayo Clinic, Dako and Novartis), a patent number 7,722,868 with royalties paid (Roche, Merck, Bristol-Myers-Squibb, EMD-Serono, Boehringer-Ingelheim, AstraZeneca, Leica, Mayo Clinic, Dako and Novartis), a patent number 8,652,465 licensed (Roche), a patent number 9,457,080 licensed (Roche), a patent number 9,683,048 licensed (Novartis), a patent number 9,815,898 licensed (Novartis), a patent number 9,845,356 licensed (Novartis), a patent number 10,202,454 licensed (Novartis), a patent number 10,457,733 licensed (Novartis), a patent number 9,580,684 issued (none), a patent number 9,988,452 issued (none), and a patent number 10,370,446 issued (none); A. Sharpe is on the scientific advisory boards for the Massachusetts General Cancer Center, Program in Cellular and Molecular Medicine at Boston Children's Hospital, and the Human Oncology and Pathogenesis Program at Memorial Sloan Kettering Cancer Center and is a scientific editor for the Journal of Experimental Medicine. M. Singer reported personal fees from Guardant Health outside the submitted work. No other disclosures were reported.

Figures

None
Graphical abstract
Figure 1.
Figure 1.
scRNAseq of CD8+ T cells identifies MC38 TM clones in blood based on TCR sequence. (A) FACS plots showing PD-1 and CD44 protein in MC38 tumors and paired blood on day 21. Gated on singlets, live, CD45+, CD8α+ cells. Frequency of parent expressing PD-1 indicated. Data representative of four experiments, each with n = 5–9 mice. (B) Experimental design for scRNAseq. (C) Clustering and UMAP visualization of paired blood (n = 10,289 cells) and MC38 tumors (n = 8,450 cells) on day 18+, integrated from three mice (M1–3) from two experiments. Colors denote transcriptional clusters, labeled with functional annotations. (D) UMAP showing CD8+ T cells in blood that have a TCR matching to CD8+ T cells found in tumor (TM cells), colored by each mouse. Gray indicates non-TM cells. (E) Selected signatures associated with genes up-regulated in TM cells or non-TM cells in blood. Significance using a gene set enrichment analysis PreRanked analysis. Full list in Table S3. ((F) UMAP showing a CD8+ activation signature in blood (top). Violin plots of enrichment (bottom). Significance using a Wilcoxon rank sum test, P = 1 × 10−41. ***, P < 0.001. (G) UMAP showing clonal expansion in the blood (top). Box plot quantifying clonal expansion (bottom). Boxes show the first quartile, median, and third quartile, while the whiskers cover 1.5× the interquartile range. Significance using a Wilcoxon rank sum test, P = 4.6 × 10⁻⁷. (H) Frequency of Pdcd1+ cells in the blood. (I) ROC curve showing the sensitivity and specificity of Pdcd1, Btla, Ctla4, Havcr2, Lag3, Cd160, or Tigit to distinguish TM cells from non-TM cells. AUC values: Pdcd1 = 0.548, Btla = 0.486, Ctla4 = 0.535, Havcr2 = 0.500, Lag3 = 0.556, Cd160 = 0.574, and Tigit = 0.603. The dashed line represents the sensitivity and specificity values of random chance. (C–I) scRNAseq integrated from three biological replicates (M1–3) from two experiments.
Figure S1.
Figure S1.
Transcriptional landscape of CD8+ T cells in paired peripheral blood and MC38 tumors in mice. (A and B) Tables indicating details about each mouse in the discovery cohort (M1–3), including the number of cells recovered that had gene expression (GEX) data, GEX and TCR data, number of matching cells, percentage matching cells of the total sorted population, and the frequency of Pdcd1+ TM cells in peripheral blood (A) and MC38 tumors (B). The samples from M1, M2, and M3 were integrated to generate an integrated blood sample and an integrated MC38 tumor sample as a discovery cohort. These three biological replicates were generated between two independent experiments (M1, experiment 1; M2 and M3, experiment 2). (C) UMAP of the integrated blood samples (top) and MC38 tumor samples (bottom) showing the distribution of each mouse in the integrated dataset (datasets combined from M1, M2, and M3). Cells from each mouse are shown in color (M1, red; M2, green; M3, blue), and the cells from the other two mice are shown in gray for each plot. (D) UMAP of the integrated blood samples (top) and MC38 tumor samples (bottom) showing the distribution of clones shared between tissues (TM cells in blood, and blood-matching cells in tumor). Only TM cells (green), blood-matching cells (navy blue), and nonmatching cells (gray) from each individual mouse are shown, and the cells from the other two mice in the integrated object are excluded. (E and F) UMAPs showing distribution of expression of select transcripts in the integrated blood (E) and MC38 tumor (F) samples. Genes include Pdcd1 (encoding PD-1), Havcr2 (encoding Tim-3), Sell (encoding CD62L), Tcf7 (encoding TCF-1), Mki67 (encoding Ki-67), and Gzmb (encoding granzyme B). (G) Heatmap showing the fraction of cells in the integrated MC38 tumor (top) and blood (bottom) datasets with the indicated number of TCR α and β chains detected. (H–J) Top: UMAP of integrated blood samples showing expression of a cell cycle signature (Kowalczyk et al., 2015; P = 0.24; H), a CD8+ naive T cell signature (Kaech et al., 2002; P = 4.6 × 10−125; I), and a TRM signature (Beura et al., 2018; P = 5.5 × 10−60; J). Violin plots quantifying the expression of each signature in H–J in TM compared with non-TM cells in the blood (bottom). ***, P < 0.001; ns, not significant. Significance determined using Wilcoxon rank sum tests. (C–J) scRNAseq integrated from three biological replicates (M1–3) between two independent experiments.
Figure 2.
Figure 2.
Cell surface marker panels can enrich TM cells from blood. (A and B) Logistic regression showing classification of cells as TM or non-TM based on (A) all genes and (B) a selected list enriched for surface-marker genes (Chihara et al., 2018). Shown are the first two principal component projections (left), ROC curves (middle), and the recall–precision plots (right) with fivefold cross validation. (C) Top 20 surface markers by q value for identifying TM cells in the blood using COMET. Significance using an XL-minimal hypergeometric test with multiple hypothesis test corrections. Full list in Table S4. (A–C) scRNAseq integrated from three biological replicates (M1–3) from two experiments. (D) Biological functions for positive markers (q value ≤ 0.01) identified using COMET for TM cells. NK, natural killer. (E) Frequency protein+ of CD8+ T cells in the blood of mice with MC38 tumors at day 21 (n = 9 mice) by flow cytometry. Gated on singlets, live, CD45+, CD8α+. Representative of two to four independent experiments depending on the marker, each with n = 5–9 mice. Bars show the mean, and error bars represent SD. NK, natural killer. (F) FACS plots showing CD39, NKG2D, and CX3CR1 (y axis) as indicated above each plot, and CD44 (x axis) on CD8+ T cells in the blood of mice in E. (G) UMAP visualization of mice from the validation cohort, two biological replicates, mouse 4 (M4), and mouse 5 (M5). Far left shows cells colored by matching status (green, TM; gray, non-TM). The three UMAPs to the right show cells colored by protein (NKG2D, CD39, and CX3CR1) using CITE seq (red, positive; gray, negative). Significance: CD39, P = 3.87 × 10−54 and P = 7.53 × 10−71; NKG2D, P = 3.19 × 10−122 and P = 1.93 × 10−175; CX3CR1, P = 9.22 × 10⁻¹⁷ and P = 2.08 × 10⁻³⁰ for M4 and M5, respectively, assessed using Wilcoxon rank sum test. (H) ROC curves showing the sensitivity and specificity of each protein at identifying TM cells. (I) Sensitivity and specificity for proteins in identifying TM cells as single markers or two- and three-protein combinations, colored black if they are pareto-optimal (no other gate with strictly better sensitivity and specificity) and gray if not pareto-optimal. The “&” indicates an “and” gate, and the “|” indicates an “or” gate. Full list of values in Table S5. (G–I) Two biological replicates from the validation cohort (one experiment).
Figure S2.
Figure S2.
Identification and validation of markers to identify TM CD8+ T cells in blood (A) Top surface markers for identifying non-TM cells from TM cells in the blood based on COMET (Delaney et al., 2019) analysis. Significance determined using an XL-minimal hypergeometric test with multiple hypothesis test corrections. scRNAseq integrated from three biological replicates (M1–3) between two independent experiments. (B) Quantification of the frequency of bulk CD8+ T cells in the peripheral blood of mice with MC38 tumors on day 21 after implantation (n = 9 mice) that express the indicated proteins using FACS. Cells are gated on singlets, live/dead, CD45+, and CD8α+ and are further gated based on CD44 expression to compare CD44low and CD44high cells. **, P < 0.01; ***, P < 0.001. (C) Comparison of bulk CD8+ T cells (gated on singlets, live/dead, CD45+, CD8α+) from the peripheral blood of mice with MC38 tumors on day 21 after implantation (n = 9 mice) to naive B6 mice (n = 4 mice). (B and C) Data are representative of two to four independent experiments depending on the marker, with n = 3–4 naive mice and n = 5–9 mice with MC38 tumors (days 19–22). Bars show the mean, and error bars represent SD. Significance determined using multiple t tests using the Holm-Sidak method, with α = 0.05. Each row was analyzed individually, without assuming a consistent SD. Reported are the adjusted P values considering multiple tests. Significant comparisons in B are indicated with asterisks and include PD-1, P = 2.6957 × 10⁻⁵; Lag-3, P = 0.0012; TIGIT, P = 0.0012; CD39, P = 3.7639 × 10⁻⁹; NRP1, P = 5.1172 × 10⁻⁷; CX3CR1, P = 0.0002; CCR2, P = 0.0012; CCR5, P = 6.4414 × 10⁻¹⁰; CXCR6, P = 6.1903 × 10⁻⁵; CD49, P = 0.0002; CD29, P = 1.6745 × 10⁻⁹; CD11a, P = 1.1636 × 10⁻⁷; CD18, P = 1.9906 × 10⁻⁷; NKG2D, P = 1.1863 × 10⁻⁷; NKG2A, P = 1.8567 × 10⁻⁷; CD94, P = 1.8567 × 10⁻⁷; NKG2I, P = 2.6625 × 10⁻⁶; Slamf7, P = 5.06 × 10⁻¹³. In B, CD160 expression between CD44high and CD44low was not significant. In C, there were no significant differences between naive B6 and B6 mice with MC38 tumors. (D) Representative FACS contour plots showing NKG2D, CD39, and CX3CR1 expression (y axis) as indicated above each plot and CD44 (x axis) on CD8+ T cells in the MC38 tumor of mice in Fig. 2 F. Representative of three independent experiments, each with n = 5–9 mice. (E) UMAPs showing distribution of expression of select transcripts in the blood of M4 (top) and M5 (bottom), two biological replicates from the validation cohort (one experiment). Genes include Pdcd1 (encoding PD-1), Klrk1 (encoding NKG2D), Entpd1 (encoding CD39), and Cx3cr1 (encoding CX3CR1). (F) Representative FACS contour plots showing all possible pairwise combinations of NKG2D, CD39, and CX3CR1 expression (as indicated in each plot) on CD8+ T cells in the blood of mice on day 21 after implantation of MC38 tumor cells. Plots are gated on singlets, live/dead, CD45+, CD8α+. Numbers on plots indicate the percentage of cells within each quadrant of the total parent population. (G) Quantification of the flow cytometry plots in F showing the frequency of cells expressing one, two, or three of the indicated proteins (NKG2D, CD39, and CX3CR1) determined using Boolean gating, of the population of cells expressing at least one of the markers. Shown are the average frequencies of all possible combination gates from six mice. In G, 70.5% expressed only one of the markers but not the others, 20.1% expressed only two of the markers, and 9.4% expressed all three of the markers. Data in F and G are representative of three independent experiments with five to nine mice per experiment. (H and I) Quantification of the frequencies of cells expressing one, two, or three of the indicated proteins (NKG2D, CD39, and CX3CR1) of the population of cells expressing at least one of the markers in the blood of M4 and M5 using the CITE seq data (two biological replicates from the validation cohort; one experiment). The frequencies of all possible combination gates on the total population of cells from the CITE seq experiment (not subsetting based on TM status; H) and only the TM population (I). (H) 61.9% of cells expressed only one marker, 28.7% expressed only two markers, and 9.4% expressed all three markers (values averaged between M4 and M5). (I) 28.1% of cells expressed only one marker, 52.7% expressed only two markers, and 19.2%, expressed all three markers (values averaged between M4 and M5). The pie charts in G and H share the legend to the left of I.
Figure S3.
Figure S3.
TM CD8+ T cells in the blood show stronger enrichment for effector signatures and weaker enrichment for exhaustion signatures than the corresponding clones in the tumor. (A) Expansion rates of clones in blood and MC38 tumor (log scale), for M4 (left) and M5 (right). Shown are two biological replicates from the validation cohort (one experiment). Data from M1 from an independent experiment are shown in Fig. 3 D. (B) Top: UMAP visualization of signatures related to CD8+ T cell transcriptional states in the mouse integrated MC38 tumor samples. From left to right are signatures of terminal exhaustion from Miller et al. (2019); TRM cells from Beura et al. (2018); cell cycle from Kowalczyk et al. (2015); naive cells from Kaech et al. (2002); and bystander cells with TCRs that are not specific to the tumor from Mognol et al. (2017). Bottom: Violin plots quantifying the expression of each signature in blood-matching compared with non–blood matching clones. Significance determined using a Wilcoxon rank sum test. Colored bars beneath the violin plots indicate whether the mean is statistically greater in blood-matching cells (terminal exhaustion, P = 1 × 10−41; TRM P = 6.9 × 10⁻¹³), not statistically significant (cell cycle, P = 0.97), or statistically greater in non–blood-matching cells (naive, P = 2.2 × 10−65; bystander, P = 0.0016). scRNAseq integrated from three biological replicates (M1–3) between two independent experiments. (C) Shown are average gene scores per sample for mouse blood and tumor, separated by matching status. M1–3 indicate each mouse sample number (three mice between two independent experiments). For a given signature, a gene score was calculated for each cell. Shown are naive-like (Kaech et al., 2002), cell cycle (Kowalczyk et al., 2015), and the effector-like, progenitor, and terminally exhausted signatures from Miller et al. (2019). (D) Clone-by-clone analysis examining the mean expression of an effector-like gene signature or a terminal exhaustion gene signature from Miller et al. (2019). Each dot shows the average gene signature of the cells in a given clone, and lines connect the same clone between blood and tumor samples. Shown are clones detected in M2 (top) and M3 (bottom) from one experiment. Data from M1 from an independent experiment are shown in Fig. 3 E. Significance determined using a Wilcoxon signed-rank test. For M2, P = 0.0084 for the effector-like signature and P = 5.3 × 10⁻⁴ for the terminally exhausted signature. For M3, P = 0.024 for the effector-like signature, and P = 1.7 × 10⁻³ for the terminally exhausted signature. *, P< 0.05; **, P < 0.01; ***, P < 0.001; ns, not significant.
Figure 3.
Figure 3.
TM CD8+ T cells in blood are less dysfunctional than the corresponding clones in tumor. (A) CD8+ T cells from the integrated MC38 tumor samples colored by matching status. Navy blue, blood-matching cells; gray, nonmatching cells. (B) The distribution of cells in blood (top) and MC38 tumors (bottom). Shown is the percentage of each cluster that is matching versus nonmatching. Shown are clusters with >50 cells. (C) UMAP visualization showing clone size across in tumor (top). Box plot quantifying clonal expansion in the tumor (bottom). Significance using the Wilcoxon rank sum test, P = 4.9 × 10⁻²⁶. (A–C) scRNAseq integrated from three biological replicates (M1–3) from two experiments. (D) Expansion rates of clones in blood and MC38 tumor (log-scale, for M1). Shown is M1 (one experiment), analysis of M4 and M5 from an independent experiment shown in Fig. S3 A. (E) Enrichment scores for a terminal exhaustion signature (P = 1.9 × 10⁻⁹) and an effector-like signature (P = 1.3 × 10⁻⁹) in tumor and blood. Significance using a Wilcoxon signed-rank test. Each dot shows the average gene signature of the cells in a given clone, and lines connect the same clone between tissues. Shown are clones detected in M1 (one experiment). M2 and M3 from an independent experiment shown in Fig. S3 D. ***, P < 0.001.
Figure S4.
Figure S4.
Transcriptional landscape of CD8+ T cells in paired patient peripheral blood and melanoma samples. (A) Schematic of clinical parameters for patient samples. Patients were checkpoint-treatment naive at the time of initial paired blood/tumor sampling. Subsequent course of treatment indicated. Timing of longitudinal blood sample collection for follow-up analysis in patients K468 and K411 indicated. The longitudinal sample for K468 was taken 1 mo after the initial blood sample, and during that time the patient received anti–PD-1 and anti–CTLA-4 combination therapy. The longitudinal sample for K411 was taken ~16 mo after the initial sample, after the patient had received anti–PD-1 as a single agent followed by combination therapy with anti–PD-1 and tavokinogene telseplasmid (TAVO; Algazi et al., 2020 for TAVO monotherapy, and clinicaltrials.gov reference NCT03132675 for combination). (B) Table indicating details regarding each patient in the cohort, including the site of tissue resection, number of cells recovered that had gene expression (GEX) data, GEX and TCR data, number of matching cells, percentage matching cells of the total sorted population, and the frequency of PDCD1+ TM cells. Each patient and time point was processed as an independent experiment for a total of six experiments (four treatment-naive blood/tumor pairs and two longitudinal blood follow-up samples). (C–F) UMAP visualization of the integrated initial paired blood samples (C and E) and melanoma samples (D and F) showing the distribution of each patient in the integrated object. Cells are colored by patient, and the remaining cells in the integrated object are excluded from visualization. C and D indicate all cells from a given patient; E and F show matching cells colored in green (TM cells in blood) or navy blue (blood-matching cells in tumor) and nonmatching cells in gray from each patient. (G and H) UMAP visualizations showing the distribution of expression of select transcripts in the integrated blood (G) and melanoma (H) samples. Genes include PDCD1 (encoding PD-1), HAVCR2 (encoding Tim-3), SELL (encoding CD62L), TCF7 (encoding TCF-1), MKI67 (encoding Ki-67), and GZMB (encoding granzyme B). The data in C–H are integrated from the four initial blood/tumor samples, totaling four independent experiments. (I and J) Violin plots showing expression of activation (I) or naive (J) CD8+ T cell signatures in TM and non-TM cells in the longitudinal blood samples from K411 and K468. Signatures derived from Akondy et al. (2017). Significance determined used a Wilcoxon rank sum test. For the activation signature in I, P = 1.2 × 10−76 for K411 and P < 0.001 for K468. For the naive signature in J, P = 6.5 × 10−52 for K411 and P < 0.001 for K468. Each longitudinal patient sample was collected and run separately, totaling two independent experiments. ***, P < 0.001. (K) Histogram showing the distribution of AUC values averaged across the six patient samples for each of the human surface markers (Chihara et al., 2018) as positive or negative indicators of TM status. Colored lines represent the AUC for CCR7, FLT3LG, GYPC, and LTB averaged across the six patient samples as negative indicators of TM status. (L) UMAP visualizations of the top singleton marker gates in human in CD8+ cells from all six patient blood samples integrated as described in Materials and methods. In each plot, cells are colored if they pass the particular negation gate; that is, if they are selected as TM because of their low expression of the marker (labeled markerlow). For CCR7low, sensitivity = 0.827, specificity = 0.619; for FLT3LGlow, sensitivity = 0.780, specificity = 0.447; for GYPClow, sensitivity = 0.339, specificity = 0.819; for LTB low, sensitivity = 0.725, specificity = 0.716. K and L show the data integrated for all six blood samples (four initial treatment-naive samples and two longitudinal follow-up samples), totaling six independent experiments. For patient samples, “tumor” in the figure refers to resections from the primary tumor and/or metastases as indicated in Fig. S4 B.
Figure 4.
Figure 4.
TM CD8+ T cell clones can be detected in the blood of metastatic melanoma patients and show fewer signs of dysfunction than matching clones in tumor. (A and B) Clustering and UMAP visualization of paired blood (n = 21,833 cells) and tumor (n = 16,878 cells) samples from immunotherapy treatment naive patients, filtered to show CD8+ T cells. Data are integrated from four patients (four experiments, patient clinical parameters in Fig. S4 A and Table S7). Colors indicate transcriptional clusters. Functional annotations of each cluster are indicated. (C) CD8+ T cells in blood colored by matching status in each patient (color, TM; gray, non-TM). (D and E) Enrichment of activation (D) or naive (E) CD8+ T cell signatures. Significance using a Wilcoxon rank sum test. For D, P values are K409, P = 7 × 10⁻⁸; K411, P = 3.3 × 10⁻¹⁵; K468, P = 3.2 × 10−101; K484, P = 3.4 × 10⁻¹³. For E, P values are K409, P = 1.4 × 10⁻⁷; K411, P = 2.3 × 10⁻¹⁰; K468, P = 1.6 × 10−91; K484, P = 1.4 × 10⁻¹². (F) Mean value of an exhaustion signature in blood and in tumor. Significance using a Wilcoxon signed-rank test; P values are K409, P = 0.2; K411, P = 4 × 10⁻⁵; K468, P = 8.9 × 10⁻¹⁹; K484, P = 6.7 × 10⁻⁵. Each dot shows a clone, and lines connect the same clone between tissues. For patients, “tumor” refers to resections from the primary tumor and/or metastases as indicated in Fig. S4 B. (D–F) Four independent experiments. ***, P < 0.001; ns, not significant.
Figure 5.
Figure 5.
Matching clones can be detected in longitudinal blood samples from melanoma patients. (A) Number of clones detected and overlapping between samples in the initial blood, longitudinal blood, and tumor samples of K411 and K468 (two experiments). (B) Mean value of an exhaustion gene signature from tumor, initial paired blood, and longitudinal blood. Each dot shows a clone, and lines connect the same clone between samples. Shown are only clones that were detectable in all samples. Significance using a Wilcoxon signed-rank test. For patient K411, blood versus longitudinal blood, P = 0.025; blood versus tumor, P = 3.5 × 10⁻⁴; longitudinal blood versus tumor, P = 0.001. For patient K468, blood versus longitudinal blood, P = 1.2 × 10⁻¹⁴; blood versus tumor, P = 6 × 10⁻¹⁵; longitudinal blood versus tumor, P = 0.0015. *, P < 0.05; **, P < 0.01; ***, P < 0.001. (C) Scatter plot showing each gene’s AUC for selecting TM cells from blood. Purple is a comparison between longitudinal samples from the same patient (R = 0.4, P < 2.2 × 10⁻¹⁶). Green is a comparison between different patients (R = 0.83, P < 2.2 × 10⁻¹⁶). Points outlined in black are surface-expressed genes. ***, P < 0.001. Significance using the Spearman correlation test. For patients, “tumor” refers to resections from the primary tumor and/or metastases as indicated in Fig. S4 B.
Figure 6.
Figure 6.
Identification of combinations of markers for tracking TM cells across patients. (A) Frequency of PDCD1+ cells (using transcript) in the initial blood sample separated by TM and non-TM cells (four experiments). (B and C) ROC curves showing the sensitivity and specificity of inhibitory receptor transcripts to distinguish TM cells from non-TM cells in the initial blood samples (four experiments; B) and the longitudinal blood samples (two experiments; C). Legend shared between B and C. (D) Plot showing the significance values from the COMET analysis across blood samples. Significance using an XL-minimal hypergeometric test with multiple hypothesis test corrections. Circles sized by AUC for sorting TM cells from non-TM cells. The y axis corresponds to the log2(x + 1) transformation of the −log10 of the COMET q values, capped at 10. PDCD1 and consensus markers are highlighted with color. All other surface markers are gray. (E) Overlap between the single markers detected by COMET to distinguish TM cells from non-TM cells in the blood of mice (with MC38 tumors, M1–5 from three experiments) and patients (with melanoma, both treatment-naive samples and longitudinal samples, totaling six experiments). Markers included if detected as significant (q value < 0.05) in a minimum of two samples. Significance using a hypergeometric test, P = 8.39 × 10⁻⁸. Lists of genes and additional parameters in Table S11. (F) ROC curves for the consensus markers identified in D. (G) The sensitivity and specificity of all possible logic gates derived from combinations of genes CCR7low, LTBlow, GYPClow, and FLT3LGlow. Points are shaped by the number of markers used in the logical gate and colored black if they are pareto-optimal (if there is no gate with strictly better sensitivity and specificity) or gray if not pareto-optimal. A dotted line through the pareto-optimal gates represents the ROC of this combinatorial marker collection. (F and G) The dashed line represents the sensitivity and specificity values of random chance. (D, F, and G) Six experiments. (H) UMAP of CD8+ cells integrated from all patient blood samples (including longitudinal samples; data combined from six experiments). Left: True TM cells as defined by matching TCR sequence in green, nonmatching in gray. Right: Putative TM cells as determined by the best-performing gate, [CCR7low and (FLT3LGlow or LTBlow)], are colored blue; cells not expressing the marker combination in this gate in gray. For this combination, sensitivity = 0.780 and specificity = 0.716. The symbol “&” indicates the “and” gate, and the “|” indicates the “or” gate.
Figure S5.
Figure S5.
TM CD8+ T cells identified using GLIPH2 and iSMART show similar signs of activation and sensitivity/specificity rates of markers as matching cells identified based on sequence matching. (A) Summary metrics showing the increase in frequency of CD8+ T cells classified as TM cells in each of the four treatment-naive patient samples determined using the TCR cluster-based matching method (defined as cells identified as TM using both GLIPH2 and iSMART) compared with the exact sequence matching method. (B and C) Violin plots showing enrichment of activation (B) or naive CD8+ T cell signatures (C) in TM and non-TM cells on the cells identified using the TCR cluster-based matching method. Signatures derived from Akondy et al. (2017). Significance determined used Wilcoxon rank sum test. For the activation signature in B, P = 4.3 × 10⁻⁸ (K409), P = 8.5 × 10⁻¹⁵ (K411), P = 5.9 × 10−99 (K468), P = 5.4 × 10⁻¹⁴ (K484). For the naive signature in C, P = 7.2 × 10⁻⁸ (K409), P = 2.7 × 10⁻¹¹ (K411), P = 2.5 × 10−89 (K468), P = 9.6 × 10⁻¹² (K484). ***, P < 0.001. (D) Summary metrics showing the sensitivity and specificity of the PDCD1 transcript to identify TM cells from non-TM cells in the blood using exact sequence matching compared with TCR cluster-based matching. (E and F) ROC curves for TM cells classified using the TCR cluster-based matching showing the sensitivity and specificity of a collection of inhibitory receptor genes (PDCD1, BTLA, CTLA4, HAVCR2, LAG3, CD160,and TIGIT; E), or the consensus markers for identifying TM cells (CCR7low, LTBlow, GYPClow, or FLT3LGlow, referred to as negation markers; F), shown for each patient. Each treatment-naive patient sample was collected and run separately, totaling four independent experiments. Each patient is plotted individually.

References

    1. Akondy, R.S., Fitch M., Edupuganti S., Yang S., Kissick H.T., Li K.W., Youngblood B.A., Abdelsamed H.A., McGuire D.J., Cohen K.W., et al. . 2017. Origin and differentiation of human memory CD8 T cells after vaccination. Nature. 552:362–367. 10.1038/nature24633 - DOI - PMC - PubMed
    1. Algazi, A., Bhatia S., Agarwala S., Molina M., Lewis K., Faries M., Fong L., Levine L.P., Franco M., Oglesby A., et al. . 2020. Intratumoral delivery of tavokinogene telseplasmid yields systemic immune responses in metastatic melanoma patients. Ann. Oncol. 31(4):532–540. 10.1016/j.annonc.2019.12.008 - DOI - PubMed
    1. André, M.C., Sigurdardottir D., Kuttruff S., Pömmerl B., Handgretinger R., Rammensee H.G., and Steinle A.. 2012. Impaired tumor rejection by memory CD8 T cells in mice with NKG2D dysfunction. Int. J. Cancer. 131:1601–1610. 10.1002/ijc.26191 - DOI - PubMed
    1. Beltra, J.C., Manne S., Abdel-Hakeem M.S., Kurachi M., Giles J.R., Chen Z., Casella V., Ngiow S.F., Khan O., Huang Y.J., et al. . 2020. Developmental Relationships of Four Exhausted CD8+ T Cell Subsets Reveals Underlying Transcriptional and Epigenetic Landscape Control Mechanisms. Immunity. 52:825–841.e8. 10.1016/j.immuni.2020.04.014 - DOI - PMC - PubMed
    1. Best, J.A., Blair D.A., Knell J., Yang E., Mayya V., Doedens A., Dustin M.L., and Goldrath A.W.. Immunological Genome Project Consortium . 2013. Transcriptional insights into the CD8(+) T cell response to infection and memory T cell formation. Nat. Immunol. 14:404–412. 10.1038/ni.2536 - DOI - PMC - PubMed

Publication types

MeSH terms